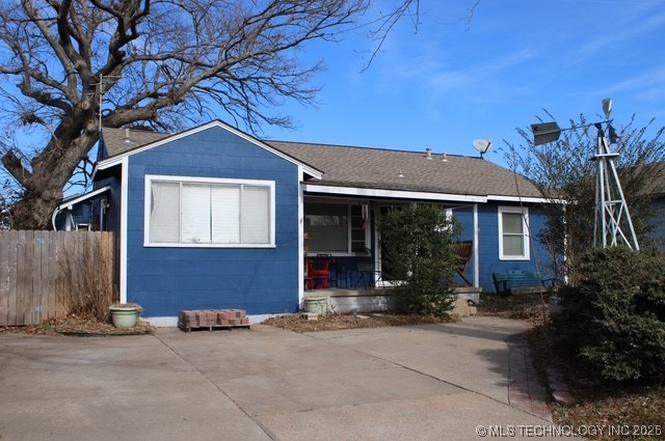
307 E 46th St · Tulsa, OK
Flood risk 1/10 · Minimal
- FEMA flood zone
- X (shaded)
- Chance of flooding over 30 yrs
- 0.0%
- Est. flood insurance / yr
- $507 – $1,088
Fire risk 1/10 · Minimal
- Est. fire insurance / yr
- $2,463 – $4,575
Heat risk 7/10 · Major
- Hot days now (above 111°F)
- 7 days/yr
- Hot days in 30 yrs
- 18 days/yr
Wind risk 3/10 · Minor
- Chance of severe wind over 30 yrs
- 4.0%
Air-quality risk 3/10 · Minor
- Unhealthy air days now
- 2 days/yr
- Unhealthy air days in 30 yrs
- 3 days/yr
Risk factors via First Street. Map © Google.
Why this score? — see what drove the B- grade
The composite is a weighted blend of 9 inputs, each scored 0–100. Each bar is that input's sub-score; the figure is the points it added to the 100-point composite (weight × sub-score).
- Cash flow +27.3/30.0
- ARV discount +15.0/15.0
- DSCR +9.5/10.0
- 1% rule +7.2/10.0
- Livability +3.8/5.0
- Rent growth +3.2/5.0
- Condition / age +2.5/5.0
- Schools +0.8/10.0
- Appreciation +0.0/10.0
$185,000
🖨 Deal sheet (PDF) 📄 Offer letter ✓ Due diligence
Listing remarks
A charming opportunity sits right in the heart of one of Tulsa's most desirable pockets near The Gathering Place - a rare find for anyone looking to create a custom home in an unbeatable location. This 1946-built home carries the character and solid bones of its era, offering 1,806 sq ft (courthouse) of potential ready to be reimagined. It's a full remodel project - ideal for investors, visionaries, or homeowners wanting to design every detail to their taste. Nestled near The Gathering Place, one of the nation's top urban parks. Minutes from River Parks trails, ideal for biking, jogging, and weekend strolls. Convenient access to shopping, dining, and local amenities. A neighborhood known fo
Key facts
- Full remodel project
- Custom home
- 8,008 sq ft lot
Tags
Property features AI
Finance
- Other: Lot size approximately 0.184 acres
Exterior
- Parking: Driveway parking
- Security: No safety shelter
- Utilities: Electricity available; Natural gas available; Public water; Public sewer
- Home design: Single-story home; South-facing
- Construction: Built in year per public records; Stucco and wood siding with wood frame construction; Asphalt/fiberglass roof; Crawlspace foundation
- Exterior features: Concrete driveway; Shed(s); Chain link and privacy fencing; No safety shelter
Interior
- Kitchen: Oven; Range
- Bedrooms: Bedrooms information not provided
- Flooring: Carpet; Hardwood; Tile; Vinyl
- Bathrooms: 2 full bathrooms; 1 half bathroom
- Heating & cooling: Gas heating with floor furnace; Window unit cooling
- Interior features: Wood window frames; Laminate counters; Electric oven and range connections; Crawl space basement; One fireplace
- Laundry & utility: Washer hookup; Electric dryer hookup; Gas dryer hookup; Gas water heater
Neighborhood map
What this means for you Summary
Snapshot
- This is a 3-bed/2.5-bath single-family listed at $185k.
Deal economics
- At list price, monthly cash flow is $536 ($6k/yr) — positive.
- The deal already cash-flows at list — no discount required.
- Meets the 1% rule at list price ($2k rent vs $185k).
- Recommended offer: $163k (12.0% below list) — sets the bar for market timing.
Location & tenants
- Location reads 75/100 on livability (#13 in OK, #4,058 nationally) — a middle-class / working-renter tenant base. Strengths: amenities A+, commute A+, cost of living A+; Watch: crime F, employment D-.
- Tulsa (urban): math 7% / reading 12% proficiency, ranked #250 of 270 in OK (top 93%) — low school quality limits family demand, transient renter base, plan for 1-2y turnover; 76% free/reduced lunch — lower-income household profile, screen leases tightly.
- Zoned schools: Project Accept Traice Es (math 10% / reading 10%, grade F, #695 of 845 statewide, top 84%, 558 students, 0% FRL); Edison Preparatory Ms (math 19% / reading 28%, grade F, #113 of 345 statewide, top 34%, 822 students, 0% FRL); Booker T. Washington Hs (math 41% / reading 61%, grade D+, #2 of 447 statewide, top 0%, 1,280 students, 0% FRL) — zoned schools average 0% FRL vs 76% district-wide (76 pts lower); this property's tenant base skews higher-income than the district average.
- Zoned-school proficiency averages 28% at this address vs 10% district-wide (+19 pts) — the actual schools serving this property are materially stronger than the Tulsa average implies; a family-tenant draw the district grade alone would hide.
- Market conditions: Rents rising (+2.8%/yr); 226 active listings in the ZIP; 6 comparable units currently listed for rent nearby; rentals at typical pace (median 25d on market — plan ~3-4 weeks tenant-placement turnaround); 2,818 units permitted in Tulsa County in 2024 (518 in 5+ unit buildings).
Forward outlook
- Local home prices are declining (-3.0%/yr); year-one equity from $1k of loan paydown is wiped out by about $6k of value loss. Plan a longer hold.
- Tulsa County population projected at +30% by 2050 — long-run rental-demand tailwind backs the buy-and-hold thesis.
- At projected returns (-3.0% appreciation + 2.8% rent growth), your $52k cash investment doubles in ~10 years — after that, you're playing with house money.
Negotiation context
- It's been on market 148 days — a 12% lower offer ($163k) is reasonable based on typical stale-listing flexibility.
- 3 sale attempts since 35y ago; this cycle's ask has dropped $40k (18%) from the opening price — seller is motivated, your offer sets the floor, not the list.
- Current owner paid $45k; list at $185k implies a 311% gain — meaningful room to come down on a strong offer.
Risks & watch-outs
- Watch-outs: built in 1946 — expect roof / HVAC / electrical / plumbing capex.
- Climate carrying-cost: extreme-heat days projected 7→18/yr by 2055 (HVAC capex compounding) — expect insurance premiums to compound above CPI over the hold.
Questions for the listing agent
- It's been on market 148 days. Have you received any prior offers? Is the seller open to a 12% concession, seller financing, or rate buy-down credit?
- Built in 1946 — when were the roof, HVAC, electrical panel, plumbing, and water heater last replaced?
- Why hasn't it sold? Are there any deal-killer items the seller is aware of (foundation, flood, title, zoning, code violations)?
- Is there a deadline driving the sale (1031 exchange, divorce, estate, relocation)? That informs how much negotiation room exists.
- Schools are F-rated, which usually means shorter tenancies and higher turnover. Who's the typical renter profile here, and what's been the actual vacancy rate?
- Crime grade is F in this area — have there been break-ins, vandalism, or insurance claims at this property in the last 3 years? What carrier currently insures it and at what premium?
- What's the average days-on-market for RENTAL listings here right now (not sales)? A rising rental-DOM trend means longer vacancies and softer asking-rent achievability than the comps imply.
- What's the recent tenant-quality profile in this submarket — average credit score on applications, eviction rate, late-payment / NSF rate, and stable-employment percentage? A property-management company in the area should have these aggregated.
- How much new for-sale + rental construction is in the pipeline within 1–3 miles? Heavy new supply typically softens prices + rents 12–24 months out; constrained supply supports both.
Investment metrics
- 1% rule
- 1.22% ✓
- Cap rate
- 9.77%
- Cash-on-cash
- 12.42%
- DSCR
- 1.55
- GRM
- 6.8
CMA / ARV
- ARV (on-the-fly)
- $316,050
- Comps found
- 12
Show comp detail 12 sales within ~0.75 mi
| Address | Dist | Beds/Ba | Sqft | Sold | Price | $/sf | Match |
|---|---|---|---|---|---|---|---|
| 304 E 45th Ct | 0.03mi | 4/2.0 (+1) | 1,741 (-4%) | 5mo | $220,000 | $126 | 82 |
| 4243 Riverside Dr | 0.33mi | 4/2.0 (+1) | 1,788 (-1%) | 1mo | $275,000 | $154 | 75 |
| 4104 S Owasso Ave | 0.54mi | 3/2.0 | 1,825 (+1%) | 10mo | $365,000 | $200 | 63 |
| 4238 S Owasso Ave | 0.35mi | 3/2.0 | 1,617 (-10%) | 3mo | $283,000 | $175 | 61 |
| 20 E 44th St | 0.21mi | 3/2.0 | 1,624 (-10%) | 14mo | $310,000 | $191 | 59 |
| 1136 E 49th St | 0.34mi | 3/2.0 | 1,604 (-11%) | 8mo | $362,600 | $226 | 57 |
| 4922 S Madison Ave | 0.32mi | 3/2.0 | 1,601 (-11%) | 13mo | $355,000 | $222 | 54 |
| 4104 S Detroit Ave | 0.50mi | 3/2.5 | 2,006 (+11%) | 13mo | $475,000 | $237 | 48 |
| 4319 S Saint Louis Ave | 0.64mi | 3/2.0 | 1,939 (+7%) | 15mo | $200,000 | $103 | 44 |
| 1211 E 39th St | 0.70mi | 3/2.0 | 1,644 (-9%) | 9mo | $275,000 | $167 | 43 |
| 1436 E 50th St | 0.66mi | 3/2.0 | 1,977 (+10%) | 13mo | $245,000 | $124 | 41 |
| 1416 E 50th St | 0.61mi | 4/2.0 (+1) | 1,538 (-15%) | 0mo | $265,000 | $172 | 39 |
Match score weights: distance 35% · size 25% · config 20% · recency 20%. Top-matched comps best support the ARV.
Projected returns pro-forma
-3.0% appreciation · 2.83% rent growth · sell at horizon
- IRR
- 1.9%
- Equity multiple
- 1.07×
- Total profit
- $3,793
- Equity at exit
- $27,584
- IRR
- 11.4%
- Equity multiple
- 1.88×
- Total profit
- $45,749
- Equity at exit
- $15,995
Cash invested: $51,800 (down + closing). Projections, not guarantees.
Landlord ↔ Tenant lean methodology
- Overall (STATE)
- 83 Strongly Landlord-Friendly
- State Oklahoma
- 83 Strongly Landlord-Friendly · R+20
- County
- — inherits STATE
- City
- — inherits STATE
ZIP-level market 74105
- Rents YoY
- 2.8%
- Active inventory
- 226
- Price-to-rent
- 6.8×
Monthly cashflow live
- Estimated rent
- $2,256 high interval (Pro) →
- Mortgage (P&I)
- −$970
- Tax from tax record
- −$199 /mo · $2,384/yr
- Insurance
- −$77
- HOA
- −$0
- Vacancy / Maint / Mgmt
- −$474
- Net cashflow
- $536
Break-even live
Sensitivity live
| Price | -10% $641 | -5% $588 | +0% $536 | +5% $484 | +10% $431 |
|---|---|---|---|---|---|
| Rent | -10% $358 | -5% $447 | +0% $536 | +5% $625 | +10% $714 |
| Rate | -1.0pp $629 | -0.5pp $583 | base $536 | +0.5pp $488 | +1.0pp $439 |
UW: 25.0% down · 7.5% · 30yr · 1.5% tax · 5.0% vac · 8.0% maint · 8.0% mgmt
Financing live
Cash to close
- Down payment
- $46,250
- Closing costs
- $5,550
- Reserves months
- —
- Total cash needed
- —
Loan-product check · same deal, 3 products live
Conventional
25% down · 7.5% · 30yr
- Down + closing
- —
- Monthly P&I
- —
- Monthly cashflow
- —
- DSCR
- —
- Eligible?
- —
Personal DTI + credit; lowest rate.
DSCR
20% down · 8.5% · 30yr
- Down + closing
- —
- Monthly P&I
- —
- Monthly cashflow
- —
- DSCR
- —
- Eligible?
- —
No personal income docs; deal must DSCR.
Hard money
10% down · 12.0% · 12mo
- Down + closing
- —
- Monthly P&I
- —
- Monthly cashflow
- —
- DSCR
- —
- Eligible?
- —
Short-term bridge; refi at stabilization.
Rent comps 6 comps
| Address | Beds | Baths | Sqft | Rent | $/sqft | DOM | Units | Dist |
|---|---|---|---|---|---|---|---|---|
| 1348 E 45th Pl Tulsa, OK | 3.0 | 1.5 | 1281 | $1,675 | $1.31 | 25d | 1 | 0.41mi |
| 3773 Riverside Dr Tulsa, OK | 2.0 | 2.0 | 1786 | $3,400 | $1.90 | 22d | 1 | 0.76mi |
| 1414 E 39th St Tulsa, OK | 1.0–2.0 | 1.0–2.0 | 1117 | $2,120 | $1.90 | 3d | 17 | 0.76mi |
| 953 E 37th St Tulsa, OK | 3.0 | 2.0 | 1794 | $2,095 | $1.17 | 25d | 1 | 0.90mi |
| 1314 E 35th Pl Tulsa, OK | 3.0 | 3.5 | 2500 | $3,550 | $1.42 | 25d | 1 | 1.11mi |
| 1426 E 32nd Pl Tulsa, OK | 3.0 | 2.5 | 1963 | $2,200 | $1.12 | 25d | 1 | 1.38mi |
Listing history 22 events
-
2026-06-22days on market $185,000 Active 148 DOM
-
2026-06-18days on market $185,000 Active 145 DOM
-
2026-06-17days on market $185,000 Active 144 DOM
-
2026-06-16days on market $185,000 Active 143 DOM
-
2026-06-15days on market $185,000 Active 142 DOM
-
2026-06-13pricedays on market $185,000 Active 140 DOM
-
2026-06-10days on market $199,900 Active 137 DOM
-
2026-06-09days on market $199,900 Active 136 DOM
-
2026-06-08days on market $199,900 Active 135 DOM
-
2026-06-07days on market $199,900 Active 134 DOM
-
2026-06-05days on market $199,900 Active 131 DOM
-
2026-06-03days on market $199,900 Active 130 DOM
-
2026-06-02days on market $199,900 Active 129 DOM
-
2026-06-01days on market $199,900 Active 128 DOM
-
2026-05-31days on market $199,900 Active 127 DOM
-
2026-04-20price $199,900
-
2026-02-12price $215,000
-
2026-01-20$225,000 Active
-
1992-06-26soldstatus $45,000
-
1992-01-24$46,500
-
1991-07-08historical
-
1991-04-08$61,500
ⓘ Source: listings_history table (triggers on properties + properties_extension) + one-shot
backfill from property_details.listing_events for pre-trigger history.
Tax reassessment forecast OK · Resets to sale price
- Current annual tax
- $2,384 · $199/mo
- Projected year-2 tax
- $2,384 · $199/mo
- Expected delta
- $0/yr ($0/mo · 0.0%)
ⓘ Screening estimate from a state-policy table — verify with the county assessor before closing.
Climate risk First Street
- Flood 1/10 Low FEMA zone X (shaded) · 0% chance over 30 yrs
- Wildfire 1/10 Low
- Heat 7/10 Severe 7 d/yr ≥111°F today · 18 d/yr by 30 yrs out
- Wind 3/10 Moderate 4% chance of damaging wind over 30 yrs
- Air quality 3/10 Moderate 2 unhealthy d/yr today · 3 by 30 yrs out
Nearby sold comps map
Loading sold comps map…
Walkable amenities ~0.75 mi
Loading nearby amenities…
Taxation est. · year 1
- Rental income
- $27,068
- − Mortgage interest
- −$10,363
- − Property taxes
- −$2,384
- − Insurance
- −$925
- − Repairs & maintenance
- −$2,165
- − Management
- −$2,165
- − Depreciation
- −$5,382
- Taxable income
- $3,683
- Est. tax owed @ 24.0%
- −$884
- After-tax cash flow
- $5,549/yr
For passive investors: Depreciation is non-cash, so a rental often shows a tax loss while cash-flowing — sheltering income. Rental losses are passive: they offset passive income freely, and up to $25,000/yr can offset ordinary (W-2) income if you actively participate and your MAGI is under $100k (phasing out to $0 by $150k); unused losses carry forward. On sale, claimed depreciation is recaptured at up to 25%, and gains may owe capital-gains tax (a 1031 exchange can defer both). Figures are a year-1 estimate at your 24.0% rate — not tax advice; consult a CPA.
Schools (NCES district)
- District
- Tulsa
- NCES district ID
- 4030240
- Math proficiency
- 7% ▼ -9.00%
- Reading proficiency
- 12% ▼ -7.00%
- Median HH income
- $37,895
- Composite
- 8.04/100
- National rank
- #9919
- State rank
- #250 of 270 in OK
Livability — Tulsa
- Score
- 75/100
- State rank
- #13
- US rank
- #4058
Category grades
Schools grade is shown separately in the Schools card above.
Census & demographics
- Census place
- Tulsa, OK
- County
- Tulsa County · 640,811 people
- City population
- 389,418
- Metro
- Tulsa, OK
- Population (ZIP)
- 26,951
- Household income
- $69,547
- Rent vs Own
- Severe rent burden
- 1214.0
Population outlook (Tulsa County) Hauer SSP2
- Today (2025)
- 723,846 people
- By 2030
- 766,033 · +5.8%
- By 2040
- 851,386 · +17.6%
- By 2050
- 938,389 · +29.6%
- By 2075
- 1,166,011 · +61.1%
- By 2100
- 1,350,277 · +86.5%
Race, ethnicity, and origin ACS 2023
- Neighborhood character
- Predominantly White (70%)
- Race & ethnicity
- White 70% Two or more races 12% Black 9% Hispanic / Latino 7% Native American 4% Asian 1%
- Hispanic origin (detail)
- Mexican 4%
- Common ancestry
- Slovak 3% Italian 3% Lithuanian 2%
- Foreign-born
- 4% · Canada, China
- Languages at home
- 94% English-only · Spanish 4%
Political lean MEDSL · Tulsa
- 2024 margin
- R (+15.2) · D 41.3% · R 56.5% · Other 2.2%
- 2008→2024 swing
- +9.2pp toward D · 2008: -24.5pp · 2024: -15.2pp
- All cycles
- 2024: R+15.2 2020: R+15.6 2016: R+22.9 2012: R+27.4 2008: R+24.5
Not yet ingested
- Civics
- —
Market trends
- HPI YoY
- ▼ -305.73%
- Current HPI
- 236.6827
- Rent YoY
- ▲ 2.83%
- Metro
- Tulsa, OK
- State GDP YoY
- ▲ 1.55%
- F500 in state
- 6
Industry mix (Fortune 500 HQ in OK)
| Industry | F500 HQs | Revenue |
|---|---|---|
| Energy | 3 | $48B |
|
||
Price history
+225.0% since first listed7 events — show timeline
- 2026-04-20 Price Changed $199,900 MLS Technology, Inc.
- 2026-02-12 Price Changed $215,000 MLS Technology, Inc.
- 2026-01-20 Listed $225,000 MLS Technology, Inc.
- 1992-06-26 Sold (Public Records) $45,000 Public Records
- 1992-01-24 Listed $46,500 MLS Technology, Inc.
- 1991-07-08 Listing Removed — MLS Technology, Inc.
- 1991-04-08 Listed $61,500 MLS Technology, Inc.
Property tax history
+4.1%/yrLatest (2025): $2,384 · +8.7% YoY. Source: county tax records.
Cash-flow waterfall
monthlySold comps — $/sqft
last 12 mo · ≤1 miLoading sold comps…