 Multi-family
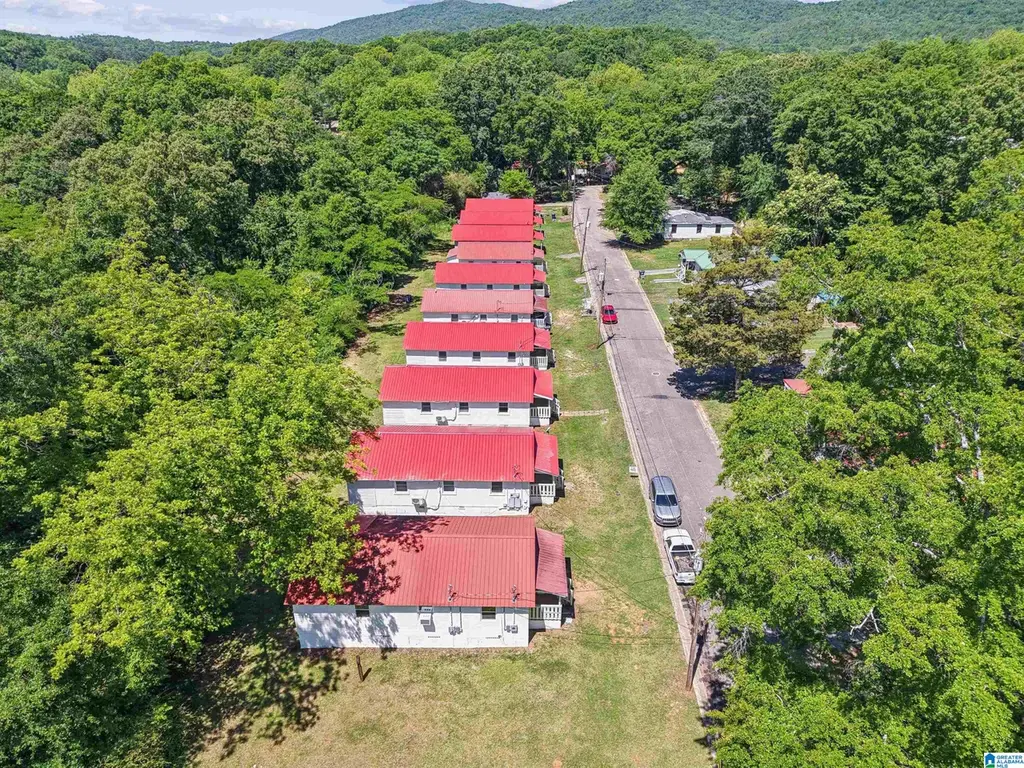
326 Wilkerson Dr · Hobson City, AL
Flood risk 8/10 · Major
- FEMA flood zone
- X (unshaded)
- Chance of flooding over 30 yrs
- 0.99%
- Est. flood insurance / yr
- $507 – $1,088
Fire risk 3/10 · Minor
- Est. fire insurance / yr
- $916 – $1,700
Heat risk 6/10 · Moderate
- Hot days now (above 106°F)
- 7 days/yr
- Hot days in 30 yrs
- 21 days/yr
Wind risk 6/10 · Moderate
- Chance of severe wind over 30 yrs
- 27.0%
Air-quality risk 3/10 · Minor
- Unhealthy air days now
- 2 days/yr
- Unhealthy air days in 30 yrs
- 3 days/yr
Risk factors via First Street. Map © Google.
Why this score? — see what drove the B- grade
The composite is a weighted blend of 9 inputs, each scored 0–100. Each bar is that input's sub-score; the figure is the points it added to the 100-point composite (weight × sub-score).
- Cash flow +30.0/30.0
- 1% rule +10.0/10.0
- DSCR +10.0/10.0
- ARV discount +7.5/15.0
- Schools +3.5/10.0
- Livability +3.2/5.0
- Rent growth +2.5/5.0
- Condition / age +2.5/5.0
- Appreciation +0.0/10.0
$699,000
🖨 Deal sheet 📄 Offer letter ✓ Due diligence
Multi-family units
County records classify this as Multi-Family (2-4 Unit). Listing-text estimate: 1 unit. estimate disagrees with records
Listing remarks
Turnkey income opportunity in the heart of Alabama's Calhoun County. This 20-unit apartment community offers a clean, consistent unit mix of all 1-bedroom/1-bathroom layouts — the most in-demand and easiest-to-manage configuration for steady occupancy and predictable cash flow. This parcel consist of 6 separate duplexes. A uniform floor plan across all 20 units means simplified maintenance, streamlined turnovers, and straightforward budgeting. 14 of the units have been completed, new roofs throughout, exterior doors and windows. Separate water and electrical meters. Parking in the front of the buildings or the street and there is land in the back for the new owner could do something w
Key facts
- Built 1950
- Listed 15 days
Property features AI
Finance
- Other: Two total units; Total interior area listed as 864 (unit-level square footage provided)
- Financial info: Expenses listed as $100 per month; Tenant pays: other (see remarks)
- HOA & community: No HOA information provided
Exterior
- Parking: Parking details not provided
- Security: No security features listed
- Utilities: Public water; Connected sewer
- Home design: Existing structure; Minor subdivision: WILKERSON
- Construction: Brick and frame construction; Slab foundation
- Exterior features: Not in a flood plain
Interior
- Kitchen: No specific kitchen appliance list provided
- Bedrooms: Two 1-bedroom units
- Flooring: Other
- Bathrooms: Two full bathrooms (one in each unit)
- Heating & cooling: Other heating (see remarks); Other cooling (see remarks)
- Interior features: Other flooring
- Laundry & utility: Washer/dryer connection in units
Neighborhood map
What this means for you Summary
Snapshot
- This is a 2-bed/2.0-bath multifamily listed at $699k.
Deal economics
- At list price, monthly cash flow is $8k ($101k/yr) — positive.
- The deal already cash-flows at list — no discount required.
- Meets the 1% rule at list price ($17k rent vs $699k).
- Recommended offer: $689k (1.5% below list) — sets the bar for market timing.
Location & tenants
- Location reads 64/100 on livability (#170 in AL) — a middle-class / working-renter tenant base. Strengths: cost of living A+, housing A-; Watch: employment D+, crime D-, amenities F.
- Oxford City (urban): math 27% / reading 55% proficiency, ranked #22 of 129 in AL (top 17%) — families likely to look elsewhere, expect single-tenant / working-renter base with shorter leases.
- Zoned schools: Oxford Elementary School (math 34% / reading 55%, grade F, #171 of 627 statewide, top 31%, 794 students, 60% FRL); Oxford High School (math 36% / reading 52%, grade F, #25 of 305 statewide, top 8%, 1,288 students, 61% FRL).
- Market conditions: 73 active listings in the ZIP; 5 comparable units currently listed for rent nearby; rentals lingering (median 44d on market — plan ~5-8 weeks vacancy on turnover, expect pricing pressure); 100% of comp listings sitting > 30 days — soft ceiling on asking rent; 135 units permitted in Calhoun County in 2024 (0 in 5+ unit buildings).
Forward outlook
- Local home prices are declining (-3.0%/yr); year-one equity from $5k of loan paydown is wiped out by about $21k of value loss. Plan a longer hold.
- Calhoun County population projected at -21% by 2050 — secular population decline; favor cash flow + early exit over multi-decade hold.
- At projected returns (-3.0% appreciation + 3.0% rent growth), your $196k cash investment doubles in ~3 years — after that, you're playing with house money.
Negotiation context
- It's been on market 15 days — a 2% lower offer ($689k) is reasonable based on typical stale-listing flexibility.
- Current owner paid $40k; list at $699k implies a 1648% gain — meaningful room to come down on a strong offer.
Risks & watch-outs
- Watch-outs: flood insurance adds $66/mo; built in 1950 — expect roof / HVAC / electrical / plumbing capex.
- Climate carrying-cost: severe flood risk; major wind risk, 27% chance of damaging wind over 30y; extreme-heat days projected 7→21/yr by 2055 (HVAC capex compounding) — expect insurance premiums to compound above CPI over the hold.
Questions for the listing agent
- Built in 1950 — when were the roof, HVAC, electrical panel, plumbing, and water heater last replaced?
- What's the actual annual flood-insurance premium (NFIP or private), and is the property in a SFHA with mandatory coverage?
- Is there a deadline driving the sale (1031 exchange, divorce, estate, relocation)? That informs how much negotiation room exists.
- Schools are D-rated, which usually means shorter tenancies and higher turnover. Who's the typical renter profile here, and what's been the actual vacancy rate?
- Crime grade is D in this area — have there been break-ins, vandalism, or insurance claims at this property in the last 3 years? What carrier currently insures it and at what premium?
- What's the average days-on-market for RENTAL listings here right now (not sales)? A rising rental-DOM trend means longer vacancies and softer asking-rent achievability than the comps imply.
- What's the recent tenant-quality profile in this submarket — average credit score on applications, eviction rate, late-payment / NSF rate, and stable-employment percentage? A property-management company in the area should have these aggregated.
- How much new apartment / multifamily construction is in the pipeline within 1–3 miles? Heavy new supply (>2% of stock underway) typically softens rents 12–24 months out; light construction supports rent growth.
Investment metrics
- 1% rule
- 2.41% ✓
- Cap rate
- 20.88%
- Cash-on-cash
- 52.10%
- DSCR
- 3.32
- GRM
- 3.5
CMA / ARV
No comps found within radius.
Projected returns pro-forma
-3.0% appreciation · 3.0% rent growth · sell at horizon
- IRR
- 49.6%
- Equity multiple
- 3.17×
- Total profit
- $424,002
- Equity at exit
- $104,223
- IRR
- 55.1%
- Equity multiple
- 6.43×
- Total profit
- $1,061,855
- Equity at exit
- $60,437
Cash invested: $195,720 (down + closing). Projections, not guarantees.
Landlord ↔ Tenant lean methodology
- Overall (STATE)
- 90 Strongly Landlord-Friendly
- State Alabama
- 90 Strongly Landlord-Friendly · R+15
- County
- — inherits STATE
- City
- — inherits STATE
ZIP-level market 36201
- Active inventory
- 73
- Price-to-rent
- 69.1×
Monthly cashflow live
- Estimated rent
- $16,871 high interval (Pro) →
- Mortgage (P&I)
- −$3,666
- Tax est. 1.5%
- −$874 /mo · $10,485/yr
- Insurance
- −$291
- Flood insurance flood zone
- −$66 /mo · $798/yr
- HOA
- −$0
- Vacancy / Maint / Mgmt
- −$3,543
- Net cashflow
- $8,431
Break-even live
20-unit breakdown (identical units grouped — click to expand)
| Units | Beds | Baths | Est. rent |
|---|---|---|---|
| 20× units | 1 | 1 | $16,880 |
| #1 | 1 | 1 | $844 |
| #2 | 1 | 1 | $844 |
| #3 | 1 | 1 | $844 |
| #4 | 1 | 1 | $844 |
| #5 | 1 | 1 | $844 |
| #6 | 1 | 1 | $844 |
| #7 | 1 | 1 | $844 |
| #8 | 1 | 1 | $844 |
| #9 | 1 | 1 | $844 |
| #10 | 1 | 1 | $844 |
| #11 | 1 | 1 | $844 |
| #12 | 1 | 1 | $844 |
| #13 | 1 | 1 | $844 |
| #14 | 1 | 1 | $844 |
| #15 | 1 | 1 | $844 |
| #16 | 1 | 1 | $844 |
| #17 | 1 | 1 | $844 |
| #18 | 1 | 1 | $844 |
| #19 | 1 | 1 | $844 |
| #20 | 1 | 1 | $844 |
| Total (20 units) | $16,871 | ||
UW: 25.0% down · 7.5% · 30yr · 1.5% tax · 5.0% vac · 8.0% maint · 8.0% mgmt
Financing live
Cash to close
- Down payment
- $174,750
- Closing costs
- $20,970
- Reserves months
- —
- Total cash needed
- —
Loan-product check · same deal, 3 products live
Conventional
25% down · 7.5% · 30yr
- Down + closing
- —
- Monthly P&I
- —
- Monthly cashflow
- —
- DSCR
- —
- Eligible?
- —
Personal DTI + credit; lowest rate.
DSCR
20% down · 8.5% · 30yr
- Down + closing
- —
- Monthly P&I
- —
- Monthly cashflow
- —
- DSCR
- —
- Eligible?
- —
No personal income docs; deal must DSCR.
Hard money
10% down · 12.0% · 12mo
- Down + closing
- —
- Monthly P&I
- —
- Monthly cashflow
- —
- DSCR
- —
- Eligible?
- —
Short-term bridge; refi at stabilization.
Rent comps 5 comps
| Address | Beds | Baths | Sqft | Rent | $/sqft | DOM | Units | Dist |
|---|---|---|---|---|---|---|---|---|
| 600 McPherson St Apt 2 Oxford, AL | 2.0 | 1.0 | 950 | $875 | $0.92 | 43d | 1 | 0.61mi |
| 1716 Hillyer Robinson Industrial Pkwy Unit F43NORTH-1 Oxford, AL | 2.0 | 2.0 | 1045 | $900 | $0.86 | 43d | 1 | 1.42mi |
| 20 Carriage Ln #8 Oxford, AL | 2.0 | 1.5 | 1100 | $1,025 | $0.93 | 43d | 1 | 1.46mi |
| 11 Carriage Ln Unit 1-8 Oxford, AL | 2.0 | 1.5 | 1100 | $995 | $0.90 | 43d | 1 | 1.48mi |
| 41 Carriage Ln Unit 4 Oxford, AL | 2.0 | 1.5 | 1100 | $995 | $0.90 | 43d | 1 | 1.48mi |
Listing history 14 events
-
2026-06-19days on market $699,000 Active 15 DOM
-
2026-06-18days on market $699,000 Active 14 DOM
-
2026-06-17days on market $699,000 Active 13 DOM
-
2026-06-16days on market $699,000 Active 12 DOM
-
2026-06-15days on market $699,000 Active 11 DOM
-
2026-06-14days on market $699,000 Active 9 DOM
-
2026-06-13days on market $699,000 Active 8 DOM
-
2026-06-10days on market $699,000 Active 6 DOM
-
2026-06-09days on market $699,000 Active 5 DOM
-
2026-06-08days on market $699,000 Active 4 DOM
-
2026-06-07days on market $699,000 Active 3 DOM
-
2026-06-05status $699,000 Active 1 DOM
-
2026-06-03remarks 693-char remark
-
2026-06-03$699,000 Coming Soon 1 DOM
ⓘ Source: listings_history table (triggers on properties + properties_extension) + one-shot
backfill from property_details.listing_events for pre-trigger history.
Climate risk First Street
- Flood 8/10 Severe FEMA zone X (unshaded) · 99% chance over 30 yrs
- Wildfire 3/10 Moderate
- Heat 6/10 Major 7 d/yr ≥106°F today · 21 d/yr by 30 yrs out
- Wind 6/10 Major 27% chance of damaging wind over 30 yrs
- Air quality 3/10 Moderate 2 unhealthy d/yr today · 3 by 30 yrs out
Nearby sold comps map
Loading sold comps map…
Walkable amenities ~0.75 mi
Loading nearby amenities…
Taxation est. · year 1
- Rental income
- $202,452
- − Mortgage interest
- −$39,155
- − Property taxes
- −$10,485
- − Insurance
- −$4,292
- − Repairs & maintenance
- −$16,196
- − Management
- −$16,196
- − Depreciation
- −$20,335
- Taxable income
- $95,793
- Est. tax owed @ 24.0%
- −$22,990
- After-tax cash flow
- $78,182/yr
For passive investors: Depreciation is non-cash, so a rental often shows a tax loss while cash-flowing — sheltering income. Rental losses are passive: they offset passive income freely, and up to $25,000/yr can offset ordinary (W-2) income if you actively participate and your MAGI is under $100k (phasing out to $0 by $150k); unused losses carry forward. On sale, claimed depreciation is recaptured at up to 25%, and gains may owe capital-gains tax (a 1031 exchange can defer both). Figures are a year-1 estimate at your 24.0% rate — not tax advice; consult a CPA.
Schools (NCES district)
- District
- Oxford City
- NCES district ID
- 0102635
- Math proficiency
- 27% ▼ -25.00%
- Reading proficiency
- 55% ▲ 5.00%
- Median HH income
- $48,971
- Composite
- 35.11/100
- National rank
- #5017
- State rank
- #22 of 129 in AL
Livability — Hobson City
- Score
- 64/100
- State rank
- #170
- US rank
- #14815
Category grades
Schools grade is shown separately in the Schools card above.
Census & demographics
- Census place
- Hobson City, AL
- Population (ZIP)
- 17,406
Population outlook (Calhoun County) Hauer SSP2
- Today (2025)
- 109,765 people
- By 2030
- 105,708 · -3.7%
- By 2040
- 96,192 · -12.4%
- By 2050
- 86,413 · -21.3%
- By 2075
- 63,467 · -42.2%
- By 2100
- 44,704 · -59.3%
Race, ethnicity, and origin ACS 2023
- Neighborhood character
- Diverse neighborhood (Simpson 0.57)
- Race & ethnicity
- White 47% Black 46% Two or more races 5% Hispanic / Latino 3%
- Common ancestry
- Lithuanian 2% Slovak 1% Scandinavian 1%
- Foreign-born
- 2% · Canada
- Languages at home
- 98% English-only · Spanish 2%
Political lean MEDSL · Calhoun
- 2024 margin
- Solid R (+44.8) · D 27.2% · R 71.9%
- 2008→2024 swing
- -12.2pp toward R · 2008: -32.5pp · 2024: -44.8pp
- All cycles
- 2024: R+44.8 2020: R+39.0 2016: R+41.4 2012: R+31.9 2008: R+32.5
Not yet ingested
- Civics
- —
Market trends
- HPI YoY
- ▼ -78.92%
- Current HPI
- 59.1512
- Rent YoY
- —
- Metro
- —
- State GDP YoY
- ▲ 2.94%
- F500 in state
- 4
Industry mix (Fortune 500 HQ in AL)
| Industry | F500 HQs | Revenue |
|---|---|---|
| Financial Services | 1 | $8B |
|
||
| Healthcare | 1 | $5B |
|
||
Price history
+1647.5% since first listed2 events — show timeline
- 2026-06-03 Coming Soon $699,000 Greater Alabama MLS
- 2024-08-08 Sold (Public Records) $40,000 Public Records
Property tax history
+4.4%/yrLatest (2025): $527 · +0.0% YoY. Source: county tax records.
Cash-flow waterfall
monthlySold comps — $/sqft
last 12 mo · ≤1 miLoading sold comps…