55 E 8th Ave · Bay Springs, MS
Flood risk No data
- FEMA flood zone
- —
- Chance of flooding over 30 yrs
- —
- Est. flood insurance / yr
- —
Fire risk No data
- Est. fire insurance / yr
- —
Heat risk 7/10 · Major
- Hot days now (above threshold)
- 7 days/yr
- Hot days in 30 yrs
- 20 days/yr
Wind risk No data
- Chance of severe wind over 30 yrs
- —
Air-quality risk 1/10 · Minimal
- Unhealthy air days now
- 0 days/yr
- Unhealthy air days in 30 yrs
- 0 days/yr
Risk factors via First Street. Map © Google.
Why this score? — see what drove the D grade
The composite is a weighted blend of 9 inputs, each scored 0–100. Each bar is that input's sub-score; the figure is the points it added to the 100-point composite (weight × sub-score).
- Cash flow +11.4/30.0
- ARV discount +7.2/15.0
- Appreciation +5.2/10.0
- 1% rule +3.3/10.0
- DSCR +3.3/10.0
- Livability +3.2/5.0
- Schools +3.0/10.0
- Rent growth +2.5/5.0
- Condition / age +2.2/5.0
$124,990
🖨 Deal sheet (PDF) 📄 Offer letter ✓ Due diligence
Listing remarks MLS
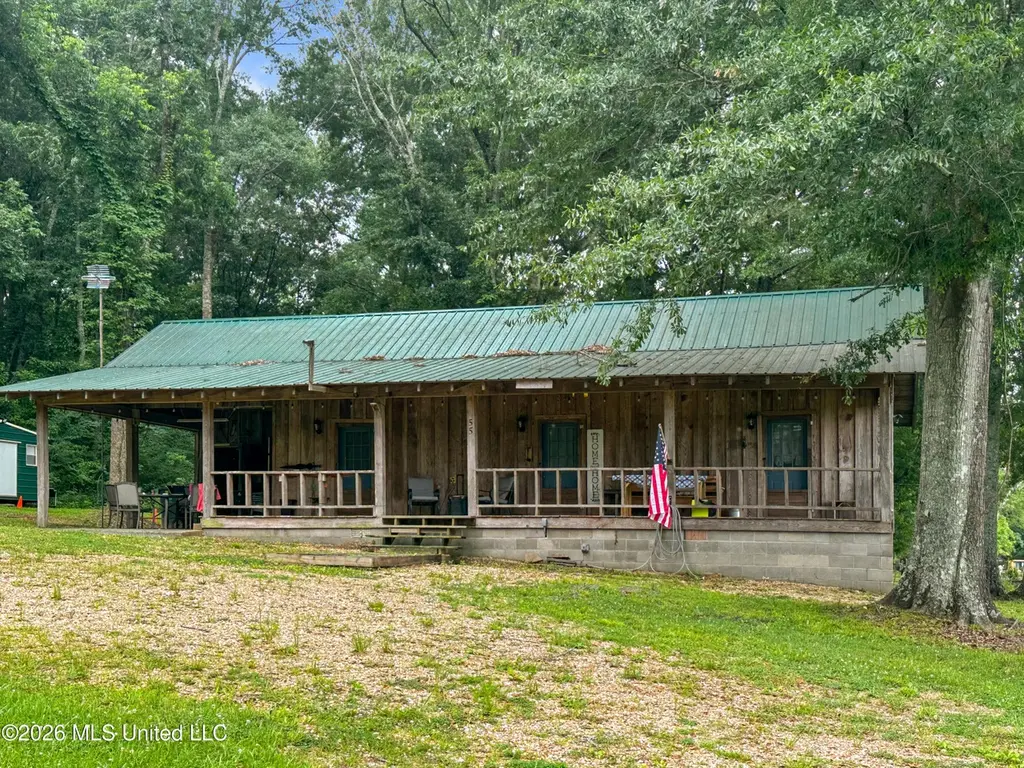
Located in Bay Springs, this quaint home is convenient to a wide array of businesses, unique shops, restaurants, parks, and other attractions. It is definitely worth considering if you are looking for a small town getaway, a Airbnb investment property or a place to call home.
Key facts
- Large front porch
- Outdoor space
- 1.01 acre lot
Tags
Property features AI
Exterior
- Parking: Attached carport (1 space); Circular driveway
- Utilities: Public sewer; Community water; Electricity available; Natural gas available; Fiber to the house
- Home design: Single-family residence (cabin); One story; Raised foundation
- Construction: Board & batten siding; Metal roof; Built (year source: assessor)
- Exterior features: Front porch; Portable building; Corner lot; Front yard; Many trees
Interior
- Kitchen: Electric range; Refrigerator
- Flooring: Laminate
- Bathrooms: 2 full bathrooms
- Heating & cooling: Central heating; Central air; Ceiling fan(s)
- Interior features: Ceiling fan(s); Move-in ready
- Laundry & utility: Laundry inside; Electric water heater
Neighborhood map
What this means for you Summary
Snapshot
- This is a 3-bed/2.0-bath single-family listed at $125k. Condition is rated fair.
Deal economics
- At list price, monthly cash flow is $-44 ($-527/yr) — negative.
- To cash-flow at today's rent, offer at most $119k (5.1% below list).
- To meet the 1% rule (rent ≥ 1% of price), the offer needs to be $104k (17.0% below list).
- Recommended offer: $104k (17.0% below list) — sets the bar for 1% rule.
Location & tenants
- Location reads 65/100 on livability (#113 in MS) — a middle-class / working-renter tenant base. Strengths: cost of living A+, housing A+; Watch: amenities F, commute F, employment D-.
- West Jasper Consolidated Schools (rural): math 38% / reading 34% proficiency, ranked #53 of 130 in MS (top 41%) — families likely to look elsewhere, expect single-tenant / working-renter base with shorter leases; 71% free/reduced lunch — lower-income household profile, screen leases tightly.
- Zoned schools: Bay Springs Elem Sch (math 47% / reading 37%, grade F, #108 of 375 statewide, top 30%, 405 students, 99% FRL); Bay Springs Middle Sch (math 27% / reading 22%, grade F, #100 of 179 statewide, top 57%, 197 students, 98% FRL); Bay Springs High School (math 5% / reading 15%, grade F, #168 of 197 statewide, top 86%, 225 students, 99% FRL) — zoned schools average 99% FRL vs 71% district-wide (28 pts higher); higher-poverty schools than district average — tighter screening recommended.
- Market conditions: 15 active listings in the ZIP; 3 units permitted in Jasper County in 2024 (0 in 5+ unit buildings).
Forward outlook
- In year one you build about $1k of equity ($864 loan paydown + $427 appreciation (0.3% local appreciation)).
- Jasper County population projected at -24% by 2050 — secular population decline; favor cash flow + early exit over multi-decade hold.
Negotiation context
- Only 14 days on market — expect competitive offers; lowballing is unlikely to land.
- 2 sale attempts since 2y ago with the ask held roughly flat each time — persistent listings suggest the price (not the market) is what's stuck; bring a comps-based counter.
Risks & watch-outs
- Climate carrying-cost: extreme-heat days projected 7→20/yr by 2055 (HVAC capex compounding) — expect insurance premiums to compound above CPI over the hold.
Questions for the listing agent
- What do current leases actually rent for vs. the listed asking? Can we see a recent rent roll and the last 12 months of T-12 income?
- Have any recent inspections been done? Can we get a copy of the seller's disclosures and any deferred-maintenance estimates?
- Is there a deadline driving the sale (1031 exchange, divorce, estate, relocation)? That informs how much negotiation room exists.
- Schools are D-rated, which usually means shorter tenancies and higher turnover. Who's the typical renter profile here, and what's been the actual vacancy rate?
- The area grade is low — what's the realistic commute time and amenity access for the typical tenant pool here? Any planned neighborhood developments (good or bad) we should know about?
- What's the average days-on-market for RENTAL listings here right now (not sales)? A rising rental-DOM trend means longer vacancies and softer asking-rent achievability than the comps imply.
- What's the recent tenant-quality profile in this submarket — average credit score on applications, eviction rate, late-payment / NSF rate, and stable-employment percentage? A property-management company in the area should have these aggregated.
- How much new for-sale + rental construction is in the pipeline within 1–3 miles? Heavy new supply typically softens prices + rents 12–24 months out; constrained supply supports both.
Investment metrics
- 1% rule
- 0.83% ✗
- Cap rate
- 5.87%
- Cash-on-cash
- -1.51%
- DSCR
- 0.93
- GRM
- 10.0
CMA / ARV
- ARV (on-the-fly)
- $124,224
- Comps found
- 1
Show comp detail 1 sale within ~0.75 mi
| Address | Dist | Beds/Ba | Sqft | Sold | Price | $/sf | Match |
|---|---|---|---|---|---|---|---|
| 27 N Third St | 0.48mi | 2/2.0 (-1) | 1,140 (-12%) | 12mo | $110,000 | $96 | 43 |
Match score weights: distance 35% · size 25% · config 20% · recency 20%. Top-matched comps best support the ARV.
Projected returns pro-forma
0.34% appreciation · 3.0% rent growth · sell at horizon
- IRR
- -2.6%
- Equity multiple
- 0.87×
- Total profit
- $-4,418
- Equity at exit
- $38,443
- IRR
- 2.9%
- Equity multiple
- 1.32×
- Total profit
- $11,327
- Equity at exit
- $47,962
Cash invested: $34,997 (down + closing). Projections, not guarantees.
Landlord ↔ Tenant lean methodology
- Overall (STATE)
- 90 Strongly Landlord-Friendly
- State Mississippi
- 90 Strongly Landlord-Friendly · R+11
- County
- — inherits STATE
- City
- — inherits STATE
ZIP-level market 39422
- Home prices YoY
- 0.3%
- Active inventory
- 15
- Price-to-rent
- 10.0×
Monthly cashflow live
- Estimated rent
- $1,038 medium interval (Pro) →
- Mortgage (P&I)
- −$655
- Tax est. 1.5%
- −$156 /mo · $1,875/yr
- Insurance
- −$52
- HOA
- −$0
- Vacancy / Maint / Mgmt
- −$218
- Net cashflow
- $-44
Break-even live
Sensitivity live
| Price | -10% $42 | -5% $-1 | +0% $-44 | +5% $-87 | +10% $-130 |
|---|---|---|---|---|---|
| Rent | -10% $-126 | -5% $-85 | +0% $-44 | +5% $-3 | +10% $38 |
| Rate | -1.0pp $19 | -0.5pp $-12 | base $-44 | +0.5pp $-76 | +1.0pp $-109 |
UW: 25.0% down · 7.5% · 30yr · 1.5% tax · 5.0% vac · 8.0% maint · 8.0% mgmt
Financing live
Cash to close
- Down payment
- $31,248
- Closing costs
- $3,750
- Reserves months
- —
- Total cash needed
- —
Loan-product check · same deal, 3 products live
Conventional
25% down · 7.5% · 30yr
- Down + closing
- —
- Monthly P&I
- —
- Monthly cashflow
- —
- DSCR
- —
- Eligible?
- —
Personal DTI + credit; lowest rate.
DSCR
20% down · 8.5% · 30yr
- Down + closing
- —
- Monthly P&I
- —
- Monthly cashflow
- —
- DSCR
- —
- Eligible?
- —
No personal income docs; deal must DSCR.
Hard money
10% down · 12.0% · 12mo
- Down + closing
- —
- Monthly P&I
- —
- Monthly cashflow
- —
- DSCR
- —
- Eligible?
- —
Short-term bridge; refi at stabilization.
Listing history 11 events
-
2026-06-22days on market $124,990 Active 14 DOM
-
2026-06-21days on market $124,990 Active 13 DOM
-
2026-06-21days on market $124,990 Active 12 DOM
-
2026-06-18days on market $124,990 Active 10 DOM
-
2026-06-17days on market $124,990 Active 9 DOM
-
2026-06-16days on market $124,990 Active 8 DOM
-
2026-06-15days on market $124,990 Active 7 DOM
-
2026-06-13days on market $124,990 Active 5 DOM
-
2026-06-12days on market $124,990 Active 4 DOM
-
2026-06-09remarks 569-char remark
-
2026-06-09$124,990 Active 1 DOM
ⓘ Source: listings_history table (triggers on properties + properties_extension) + one-shot
backfill from property_details.listing_events for pre-trigger history.
Climate risk First Street
- Heat 7/10 Severe
- Air quality 1/10 Low 0 unhealthy d/yr today · 0 by 30 yrs out
Nearby sold comps map
Loading sold comps map…
Walkable amenities ~0.75 mi
Loading nearby amenities…
Taxation est. · year 1
- Rental income
- $12,453
- − Mortgage interest
- −$7,001
- − Property taxes
- −$1,875
- − Insurance
- −$625
- − Repairs & maintenance
- −$996
- − Management
- −$996
- − Depreciation
- −$3,636
- Taxable loss
- −$2,676
- Est. tax savings @ 24.0%
- +$642
- After-tax cash flow
- $115/yr
For passive investors: Depreciation is non-cash, so a rental often shows a tax loss while cash-flowing — sheltering income. Rental losses are passive: they offset passive income freely, and up to $25,000/yr can offset ordinary (W-2) income if you actively participate and your MAGI is under $100k (phasing out to $0 by $150k); unused losses carry forward. On sale, claimed depreciation is recaptured at up to 25%, and gains may owe capital-gains tax (a 1031 exchange can defer both). Figures are a year-1 estimate at your 24.0% rate — not tax advice; consult a CPA.
Condition & rehab AI · 12 photos
This cabin requires significant repairs and updates to its exterior and interior, but presents a charming and cozy atmosphere. With proper renovations, it has the potential to become a move-in-ready property with increased value.
Repairs flagged
- Major Exterior siding — Significant wear and tear
- Major Roof — Weathered and exposed
- Major Flooring — Worn and in need of replacement
- Major Interior walls and paint — Worn and in need of repainting
Value-add opportunities
- Both Exterior siding and roof repair — Enhances curb appeal and structural integrity
- Both Interior painting — Refreshes the interior and improves curb appeal
- Both Flooring replacement — Improves comfort and aesthetics
- Both Kitchen and bathroom updates — Modernizes the home and improves functionality
Renovation cost estimate screening
| Repair item | Severity | Est. cost |
|---|---|---|
| Exterior siding · Significant wear and tear | Major | $15,000–50,000 |
| Roof · Weathered and exposed | Major | $15,000–50,000 |
| Flooring · Worn and in need of replacement | Major | $15,000–50,000 |
| Interior walls and paint · Worn and in need of repainting | Major | $15,000–50,000 |
| Total estimated repair cost · 4 items | $60,000–200,000 |
Value-add ROI direction
- Both Exterior siding and roof repair — Enhances curb appeal and structural integrity ↑
- Both Interior painting — Refreshes the interior and improves curb appeal ↑
- Both Flooring replacement — Improves comfort and aesthetics ↑
- Both Kitchen and bathroom updates — Modernizes the home and improves functionality ↑
ⓘ Cost ranges are severity-bucket heuristics (US national rule-of-thumb). Get contractor quotes + a written scope before underwriting a rehab budget.
Schools (NCES district)
- District
- West Jasper Consolidated Schools
- NCES district ID
- 2804590
- Math proficiency
- 38% ▼ -12.00%
- Reading proficiency
- 34% ▼ -6.00%
- Median HH income
- $33,785
- Composite
- 29.65/100
- National rank
- #6467
- State rank
- #53 of 130 in MS
Livability — Bay Springs
- Score
- 65/100
- State rank
- #113
- US rank
- #12871
Category grades
Schools grade is shown separately in the Schools card above.
Census & demographics
- Census place
- Bay Springs, MS
- City population
- 4,534
- Population (ZIP)
- 4,534
Population outlook (Jasper County) Hauer SSP2
- Today (2025)
- 15,383 people
- By 2030
- 14,629 · -4.9%
- By 2040
- 13,119 · -14.7%
- By 2050
- 11,742 · -23.7%
- By 2075
- 9,102 · -40.8%
- By 2100
- 7,062 · -54.1%
Race, ethnicity, and origin ACS 2023
- Race & ethnicity
- Black 50% White 48% Two or more races 2%
- Common ancestry
- Serbian 1% Italian 1%
- Foreign-born
- 1%
Political lean MEDSL · Jasper
- 2024 margin
- Lean R (+5.0) · D 47.2% · R 52.2%
- 2008→2024 swing
- -14.7pp toward R · 2008: 9.7pp · 2024: -5.0pp
- All cycles
- 2024: R+5.0 2020: D+0.5 2016: D+4.0 2012: D+9.7 2008: D+9.7
Not yet ingested
- Civics
- —
Market trends
- HPI YoY
- ▲ 0.34%
- Current HPI
- 96.8601
- Rent YoY
- —
- Metro
- —
- State GDP YoY
- —
- F500 in state
- 0
Price history
+21.5% since first listed6 events — show timeline
- 2026-06-08 Listed $124,990 MLSU
- 2024-10-08 Sold (MLS) — HAAR
- 2024-09-25 Pending — HAAR
- 2024-06-18 Price Changed $83,900 HAAR
- 2024-05-10 Price Changed $88,900 HAAR
- 2024-04-22 Listed $102,900 HAAR
Cash-flow waterfall
monthlySold comps — $/sqft
last 12 mo · ≤1 miLoading sold comps…