 🏗️ New Construction
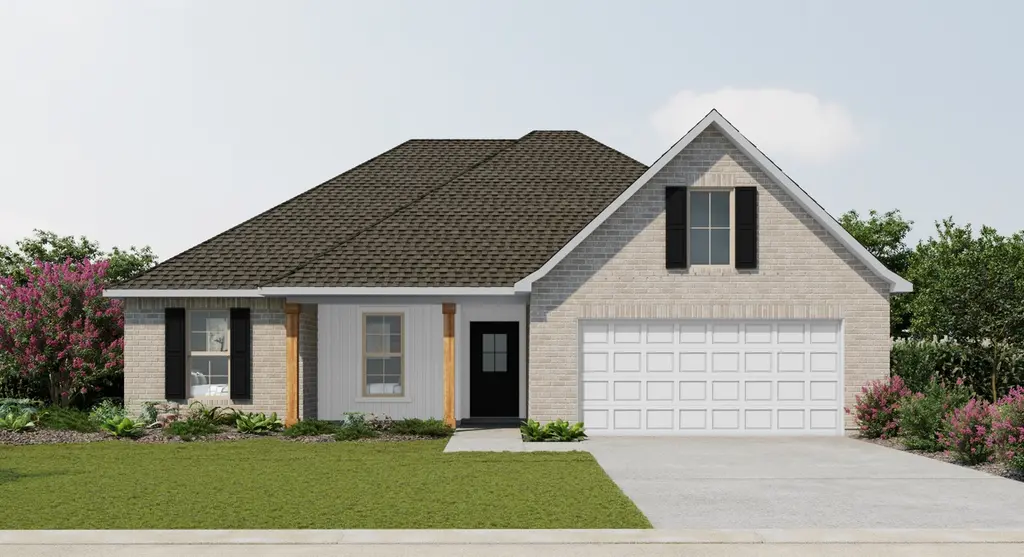
Ravenswood V G Plan · Lyman, MS
Flood risk No data
- FEMA flood zone
- —
- Chance of flooding over 30 yrs
- —
- Est. flood insurance / yr
- —
Fire risk No data
- Est. fire insurance / yr
- —
Heat risk No data
- Hot days now (above threshold)
- —
- Hot days in 30 yrs
- —
Wind risk No data
- Chance of severe wind over 30 yrs
- —
Air-quality risk No data
- Unhealthy air days now
- —
- Unhealthy air days in 30 yrs
- —
Risk factors via First Street. Map © Google.
Why this score? — see what drove the D- grade
The composite is a weighted blend of 9 inputs, each scored 0–100. Each bar is that input's sub-score; the figure is the points it added to the 100-point composite (weight × sub-score).
- Cash flow +10.8/30.0
- ARV discount +7.5/15.0
- Rent growth +4.2/5.0
- Schools +4.2/10.0
- Livability +3.5/5.0
- 1% rule +3.2/10.0
- DSCR +3.1/10.0
- Condition / age +2.2/5.0
- Appreciation +0.0/10.0
$270,990
🖨 Deal sheet (PDF) 📄 Offer letter ✓ Due diligence
Listing remarks MLS
- Open Floor Plan - Four Bedrooms, Two Bathrooms - Brick and Siding Exterior - Master garden tub - Separate master shower - Double master vanity - Double walk-in master closets - Canned lighting in kitchen - Covered rear patio - Two-car garage
Key facts
- Open floor plan
- Master garden tub
- Double master vanity
Tags
Neighborhood map
What this means for you Summary
Snapshot
- This is a 4-bed/2.0-bath single-family listed at $271k. Condition is rated fair.
Deal economics
- At list price, monthly cash flow is $-131 ($-2k/yr) — negative.
- To cash-flow at today's rent, offer at most $264k (2.7% below list).
- To meet the 1% rule (rent ≥ 1% of price), the offer needs to be $231k (14.9% below list).
- Recommended offer: $231k (14.9% below list) — sets the bar for 1% rule.
- Cap rate 5.7% vs local median 4.4% in Lyman — top-decile yield for the area; either an underpriced asset or a hidden risk that comps aren't pricing in. Stress-test before assuming the spread holds.
Location & tenants
- Location reads 69/100 on livability (#47 in MS) — a middle-class / working-renter tenant base. Strengths: crime A+, employment A+, cost of living A+; Watch: schools F, amenities F, commute F.
- Harrison County School District (rural): math 52% / reading 46% proficiency, ranked #14 of 130 in MS (top 11%) — families likely to look elsewhere, expect single-tenant / working-renter base with shorter leases; 62% free/reduced lunch — lower-income household profile, screen leases tightly.
- Market conditions: Rents rising fast (+7.0%/yr); 770 active listings in the ZIP; 4 comparable units currently listed for rent nearby; rentals at typical pace (median 23d on market — plan ~3-4 weeks tenant-placement turnaround); 2,194 units permitted in Harrison County in 2024 (0 in 5+ unit buildings).
- This rent runs 44% of the median local income ($63k/yr) — at the standard rent-burdened threshold; future hikes will face affordability resistance.
Forward outlook
- Local home prices are declining (-3.0%/yr); year-one equity from $2k of loan paydown is wiped out by about $8k of value loss. Plan a longer hold.
- Harrison County population projected at +27% by 2050 — long-run rental-demand tailwind backs the buy-and-hold thesis.
Negotiation context
- It's been on market 612 days — a 12% lower offer ($238k) is reasonable based on typical stale-listing flexibility.
Questions for the listing agent
- What do current leases actually rent for vs. the listed asking? Can we see a recent rent roll and the last 12 months of T-12 income?
- It's been on market 612 days. Have you received any prior offers? Is the seller open to a 15% concession, seller financing, or rate buy-down credit?
- Have any recent inspections been done? Can we get a copy of the seller's disclosures and any deferred-maintenance estimates?
- Why hasn't it sold? Are there any deal-killer items the seller is aware of (foundation, flood, title, zoning, code violations)?
- Is there a deadline driving the sale (1031 exchange, divorce, estate, relocation)? That informs how much negotiation room exists.
- Schools are F-rated, which usually means shorter tenancies and higher turnover. Who's the typical renter profile here, and what's been the actual vacancy rate?
- The area grade is low — what's the realistic commute time and amenity access for the typical tenant pool here? Any planned neighborhood developments (good or bad) we should know about?
- What's the average days-on-market for RENTAL listings here right now (not sales)? A rising rental-DOM trend means longer vacancies and softer asking-rent achievability than the comps imply.
- What's the recent tenant-quality profile in this submarket — average credit score on applications, eviction rate, late-payment / NSF rate, and stable-employment percentage? A property-management company in the area should have these aggregated.
- How much new for-sale + rental construction is in the pipeline within 1–3 miles? Heavy new supply typically softens prices + rents 12–24 months out; constrained supply supports both.
Investment metrics
- 1% rule
- 0.82% ✗
- Cap rate
- 5.74%
- Cash-on-cash
- -1.99%
- DSCR
- 0.91
- GRM
- 10.2
CMA / ARV
- ARV (median comp)
- $282,555
- List price
- $270,990
- Delta
- -4.09%
- Verdict
- FAIR
- Comps
- 20 within 1.0 mi
Show comp detail 12 sales within ~0.75 mi
| Address | Dist | Beds/Ba | Sqft | Sold | Price | $/sf | Match |
|---|---|---|---|---|---|---|---|
| 15562 Soaring Loop | 0.15mi | 3/2.0 (-1) | 1,925 (+2%) | 1mo | $287,900 | $150 | 84 |
| 15123 High Point Dr | 0.29mi | 3/2.0 (-1) | 1,925 (+2%) | 1mo | $279,120 | $145 | 77 |
| 15162 High Point Dr | 0.32mi | 3/2.0 (-1) | 1,848 (-2%) | 0mo | $275,477 | $149 | 77 |
| 15163 High Point Dr | 0.32mi | 3/2.0 (-1) | 1,848 (-2%) | 2mo | $279,164 | $151 | 75 |
| 15264 High Point Dr | 0.11mi | 3/2.0 (-1) | 1,710 (-9%) | 3mo | $263,780 | $154 | 72 |
| 15184 High Point Dr | 0.37mi | 3/2.0 (-1) | 1,925 (+2%) | 4mo | $277,190 | $144 | 71 |
| 15124 High Point Dr | 0.18mi | 3/2.0 (-1) | 1,710 (-9%) | 4mo | $262,500 | $154 | 68 |
| 15115 High Point Dr | 0.29mi | 3/2.0 (-1) | 1,710 (-9%) | 1mo | $262,996 | $154 | 65 |
| 15193 High Point Dr | 0.23mi | 3/2.0 (-1) | 1,710 (-9%) | 4mo | $262,500 | $154 | 65 |
| 15065 High Point Dr | 0.27mi | 3/2.0 (-1) | 1,710 (-9%) | 4mo | $261,365 | $153 | 63 |
| 15207 High Point Dr | 0.31mi | 3/2.0 (-1) | 1,624 (-14%) | 0mo | $252,455 | $155 | 57 |
| 15363 Serene St | 0.53mi | 3/2.0 (-1) | 1,710 (-9%) | 1mo | $256,417 | $150 | 54 |
Match score weights: distance 35% · size 25% · config 20% · recency 20%. Top-matched comps best support the ARV.
Projected returns pro-forma
-3.0% appreciation · 6.99% rent growth · sell at horizon
- IRR
- -15.2%
- Equity multiple
- 0.44×
- Total profit
- $-44,492
- Equity at exit
- $42,130
- IRR
- -1.0%
- Equity multiple
- 0.92×
- Total profit
- $-6,484
- Equity at exit
- $24,430
Cash invested: $79,115 (down + closing). Projections, not guarantees.
Landlord ↔ Tenant lean methodology
- Overall (STATE)
- 90 Strongly Landlord-Friendly
- State Mississippi
- 90 Strongly Landlord-Friendly · R+11
- County
- — inherits STATE
- City
- — inherits STATE
ZIP-level market 39503
- Home prices YoY
- -21.5%
- Rents YoY
- 7.0%
- Active inventory
- 770
- Price-to-rent
- 9.8×
Monthly cashflow live
- Estimated rent
- $2,305 medium interval (Pro) →
- Mortgage (P&I)
- −$1,482
- Tax est. 1.5%
- −$353 /mo · $4,238/yr
- Insurance
- −$118
- HOA
- −$0
- Vacancy / Maint / Mgmt
- −$484
- Net cashflow
- $-131
Break-even live
Sensitivity live
| Price | -10% $64 | -5% $-34 | +0% $-131 | +5% $-229 | +10% $-327 |
|---|---|---|---|---|---|
| Rent | -10% $-314 | -5% $-222 | +0% $-131 | +5% $-40 | +10% $51 |
| Rate | -1.0pp $11 | -0.5pp $-60 | base $-131 | +0.5pp $-205 | +1.0pp $-279 |
UW: 25.0% down · 7.5% · 30yr · 1.5% tax · 5.0% vac · 8.0% maint · 8.0% mgmt
Financing live
Cash to close
- Down payment
- $70,639
- Closing costs
- $8,477
- Reserves months
- —
- Total cash needed
- —
Loan-product check · same deal, 3 products live
Conventional
25% down · 7.5% · 30yr
- Down + closing
- —
- Monthly P&I
- —
- Monthly cashflow
- —
- DSCR
- —
- Eligible?
- —
Personal DTI + credit; lowest rate.
DSCR
20% down · 8.5% · 30yr
- Down + closing
- —
- Monthly P&I
- —
- Monthly cashflow
- —
- DSCR
- —
- Eligible?
- —
No personal income docs; deal must DSCR.
Hard money
10% down · 12.0% · 12mo
- Down + closing
- —
- Monthly P&I
- —
- Monthly cashflow
- —
- DSCR
- —
- Eligible?
- —
Short-term bridge; refi at stabilization.
Rent comps 4 comps
| Address | Beds | Baths | Sqft | Rent | $/sqft | DOM | Units | Dist |
|---|---|---|---|---|---|---|---|---|
| 15395 Percy St Gulfport, MS | 3.0 | 2.0 | 1710 | $1,975 | $1.15 | 45d | 1 | 0.73mi |
| 15740 Rachael Dr Gulfport, MS | 4.0 | 2.0 | 1928 | $2,400 | $1.24 | 15d | 1 | 0.93mi |
| 15033 S White Swan Dr Gulfport, MS | 4.0 | 2.5 | 1933 | $2,495 | $1.29 | 23d | 1 | 1.16mi |
| 15336 Lakeview Ct Gulfport, MS | 3.0 | 2.0 | 1837 | $2,195 | $1.19 | 23d | 1 | 1.17mi |
Listing history 18 events
-
2026-06-21days on market $270,990 Active 612 DOM
-
2026-06-18days on market $270,990 Active 609 DOM
-
2026-06-17days on market $270,990 Active 608 DOM
-
2026-06-16days on market $270,990 Active 607 DOM
-
2026-06-15days on market $270,990 Active 606 DOM
-
2026-06-14days on market $270,990 Active 604 DOM
-
2026-06-13days on market $270,990 Active 603 DOM
-
2026-06-10days on market $270,990 Active 601 DOM
-
2026-06-09days on market $270,990 Active 600 DOM
-
2026-06-08days on market $270,990 Active 599 DOM
-
2026-06-07days on market $270,990 Active 598 DOM
-
2026-06-02days on market $270,990 Active 593 DOM
-
2026-06-01days on market $270,990 Active 592 DOM
-
2026-05-31days on market $270,990 Active 591 DOM
-
2026-05-30days on market $270,990 Active 590 DOM
-
2025-07-15price $270,990 246-char remark
Show marketing remark (246 chars)
- Open Floor Plan - Four Bedrooms, Two Bathrooms - Brick and Siding Exterior - Master garden tub - Separate master shower - Double master vanity - Double walk-in master closets - Canned lighting in kitchen - Covered rear patio - Two-car garage
-
2025-05-09price $269,990 246-char remark
Show marketing remark (246 chars)
- Open Floor Plan - Four Bedrooms, Two Bathrooms - Brick and Siding Exterior - Master garden tub - Separate master shower - Double master vanity - Double walk-in master closets - Canned lighting in kitchen - Covered rear patio - Two-car garage
-
2024-10-17$266,990 Active 246-char remark
Show marketing remark (246 chars)
- Open Floor Plan - Four Bedrooms, Two Bathrooms - Brick and Siding Exterior - Master garden tub - Separate master shower - Double master vanity - Double walk-in master closets - Canned lighting in kitchen - Covered rear patio - Two-car garage
ⓘ Source: listings_history table (triggers on properties + properties_extension) + one-shot
backfill from property_details.listing_events for pre-trigger history.
Nearby sold comps map
Loading sold comps map…
Walkable amenities ~0.75 mi
Loading nearby amenities…
Taxation est. · year 1
- Rental income
- $27,665
- − Mortgage interest
- −$15,827
- − Property taxes
- −$4,238
- − Insurance
- −$1,413
- − Repairs & maintenance
- −$2,213
- − Management
- −$2,213
- − Depreciation
- −$8,220
- Taxable loss
- −$6,459
- Est. tax savings @ 24.0%
- +$1,550
- After-tax cash flow
- $-26/yr
For passive investors: Depreciation is non-cash, so a rental often shows a tax loss while cash-flowing — sheltering income. Rental losses are passive: they offset passive income freely, and up to $25,000/yr can offset ordinary (W-2) income if you actively participate and your MAGI is under $100k (phasing out to $0 by $150k); unused losses carry forward. On sale, claimed depreciation is recaptured at up to 25%, and gains may owe capital-gains tax (a 1031 exchange can defer both). Figures are a year-1 estimate at your 24.0% rate — not tax advice; consult a CPA.
Condition & rehab AI · 3 photos
The home has a fair condition with some exterior repairs and maintenance needed. Landscaping and fencing repairs would significantly enhance its curb appeal and property value.
Repairs flagged
- Major Landscaping — Overgrown grass and weeds need trimming
- Major Fencing — White picket fence appears weathered and needs repainting
Value-add opportunities
- Both Landscaping and fencing repairs — Enhances curb appeal and property value
- Both Paint exterior — Improves curb appeal and property value
Renovation cost estimate screening
| Repair item | Severity | Est. cost |
|---|---|---|
| Landscaping · Overgrown grass and weeds need trimming | Major | $15,000–50,000 |
| Fencing · White picket fence appears weathered and needs repainting | Major | $15,000–50,000 |
| Total estimated repair cost · 2 items | $30,000–100,000 |
Value-add ROI direction
- Both Landscaping and fencing repairs — Enhances curb appeal and property value ↑
- Both Paint exterior — Improves curb appeal and property value ↑
ⓘ Cost ranges are severity-bucket heuristics (US national rule-of-thumb). Get contractor quotes + a written scope before underwriting a rehab budget.
Schools (NCES district)
- District
- Harrison County School District
- NCES district ID
- 2801770
- Math proficiency
- 52% ▼ -4.00%
- Reading proficiency
- 46% ▼ -4.00%
- Median HH income
- $46,504
- Composite
- 41.66/100
- National rank
- #3419
- State rank
- #14 of 130 in MS
Livability — Lyman
- Score
- 69/100
- State rank
- #47
- US rank
- #8189
Category grades
Schools grade is shown separately in the Schools card above.
Census & demographics
- County
- Harrison County · 178,171 people
- Metro
- Gulfport-Biloxi, MS
- Population (ZIP)
- 55,059
- Household income
- $62,641
- Rent vs Own
- Severe rent burden
- 1686.0
Population outlook (Harrison County) Hauer SSP2
- Today (2025)
- 228,444 people
- By 2030
- 241,942 · +5.9%
- By 2040
- 267,531 · +17.1%
- By 2050
- 291,062 · +27.4%
- By 2075
- 346,711 · +51.8%
- By 2100
- 378,165 · +65.5%
Race, ethnicity, and origin ACS 2023
- Neighborhood character
- Diverse neighborhood (Simpson 0.58)
- Race & ethnicity
- White 58% Black 27% Two or more races 9% Hispanic / Latino 6% Asian 2%
- Hispanic origin (detail)
- Mexican 2% Puerto Rican 1%
- Common ancestry
- Lithuanian 5% Slovak 1% Portuguese 1%
- Foreign-born
- 3% · Canada
- Languages at home
- 95% English-only · Spanish 3%
Political lean MEDSL · Harrison
- 2024 margin
- Strong R (+28.9) · D 35.0% · R 63.9% · Other 1.1%
- 2008→2024 swing
- -2.9pp toward R · 2008: -26.0pp · 2024: -28.9pp
- All cycles
- 2024: R+28.9 2020: R+25.2 2016: R+30.7 2012: R+26.6 2008: R+26.0
Not yet ingested
- Civics
- —
Market trends
- HPI YoY
- ▼ -51.39%
- Current HPI
- 187.285
- Rent YoY
- ▲ 6.99%
- Metro
- Gulfport-Biloxi, MS
- State GDP YoY
- —
- F500 in state
- 0
Price history
+1.5% since first listed3 events — show timeline
- 2025-07-15 Price Changed $270,990 Zillow
- 2025-05-09 Price Changed $269,990 Zillow
- 2024-10-17 Listed $266,990 Zillow
Cash-flow waterfall
monthlySold comps — $/sqft
last 12 mo · ≤1 miLoading sold comps…