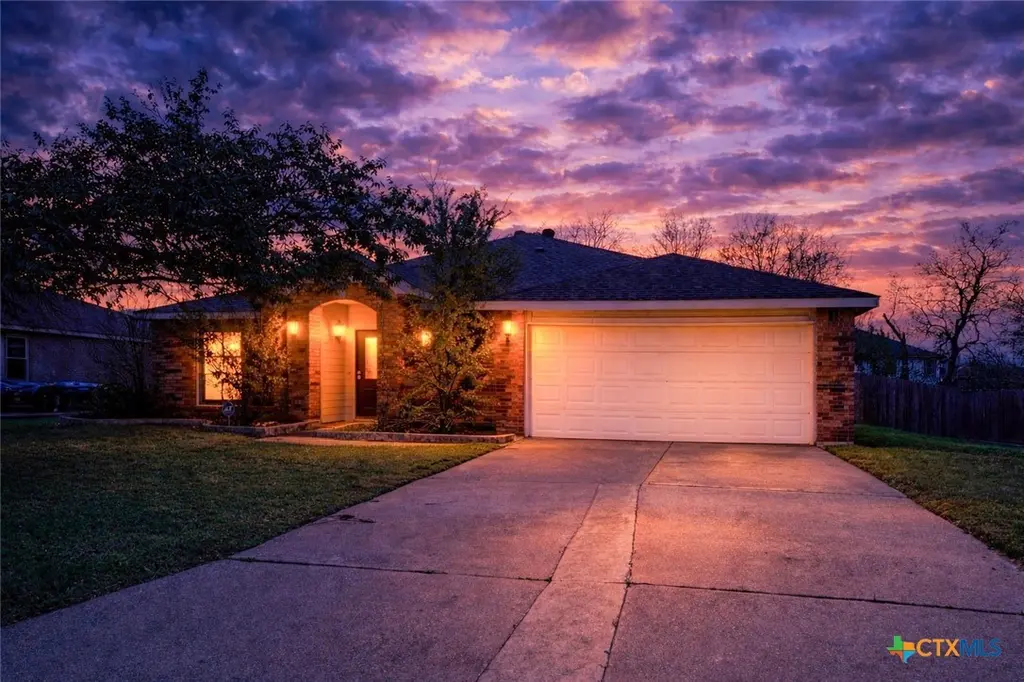
2112 Modoc Dr · Harker Heights, TX
Flood risk 1/10 · Minimal
- FEMA flood zone
- X (unshaded)
- Chance of flooding over 30 yrs
- 0.0%
- Est. flood insurance / yr
- $507 – $1,088
Fire risk 3/10 · Minor
- Est. fire insurance / yr
- $1,222 – $2,270
Heat risk 8/10 · Major
- Hot days now (above 107°F)
- 7 days/yr
- Hot days in 30 yrs
- 24 days/yr
Wind risk 6/10 · Moderate
- Chance of severe wind over 30 yrs
- 59.0%
Air-quality risk 1/10 · Minimal
- Unhealthy air days now
- 0 days/yr
- Unhealthy air days in 30 yrs
- 0 days/yr
Risk factors via First Street. Map © Google.
Why this score? — see what drove the D grade
The composite is a weighted blend of 9 inputs, each scored 0–100. Each bar is that input's sub-score; the figure is the points it added to the 100-point composite (weight × sub-score).
- ARV discount +15.0/15.0
- Cash flow +8.7/30.0
- Livability +4.0/5.0
- 1% rule +3.6/10.0
- Schools +3.0/10.0
- Rent growth +2.7/5.0
- Condition / age +2.5/5.0
- DSCR +2.4/10.0
- Appreciation +0.0/10.0
$219,000
🖨 Deal sheet (PDF) 📄 Offer letter ✓ Due diligence
Listing remarks MLS
Welcome to this charming 4-bedroom, 2-bath brick home in the heart of Harker Heights! Designed with both comfort and functionality in mind, this home features a spacious layout that opens seamlessly into the living area perfect for everyday living and entertaining. Enjoy cozy evenings by the wood-burning fireplace and gatherings centered around the kitchen’s island, complete with granite countertops, tile backsplash, and beautiful custom oak cabinetry. All appliances, including the refrigerator, will convey. The private primary suite is thoughtfully situated on one side of the home and offers its own screened-in patio—an ideal spot to unwind. The en-suite bathroom features a separate 5-jetted tub and shower, dual vanities, and ample space. Additional features include a manual garage, generous living areas, and a layout full of potential to make your own. Conveniently located near Fort Hood, shopping, dining, and more, this home offers both location and opportunity. Being sold as-is, this property is perfect for buyers looking to add their personal touch and create something special.
Key facts
- Custom oak cabinetry
- Kitchen island
- Granite countertops
Tags
Neighborhood map
What this means for you Summary
Snapshot
- This is a 4-bed/2.0-bath single-family listed at $219k.
Deal economics
- At list price, monthly cash flow is $-184 ($-2k/yr) — negative.
- To cash-flow at today's rent, offer at most $186k (14.9% below list).
- To meet the 1% rule (rent ≥ 1% of price), the offer needs to be $189k (13.8% below list).
- Recommended offer: $186k (14.9% below list) — sets the bar for cash-flow.
- Cap rate 5.3% vs local median 3.8% in Harker Heights — top-decile yield for the area; either an underpriced asset or a hidden risk that comps aren't pricing in. Stress-test before assuming the spread holds.
Location & tenants
- Location reads 79/100 on livability (#61 in TX, #2,271 nationally) — a middle-class / working-renter tenant base. Strengths: cost of living A+, housing A+, health & safety A+; Watch: amenities F, commute F.
- Killeen ISD (urban): math 31% / reading 38% proficiency, ranked #524 of 826 in TX (top 63%) — families likely to look elsewhere, expect single-tenant / working-renter base with shorter leases.
- Zoned schools: Mountain View El (math 34% / reading 39%, grade F, #1,883 of 4,322 statewide, top 44%, 787 students, 45% FRL); Union Grove Middle (math 41% / reading 44%, grade D-, #553 of 1,662 statewide, top 34%, 633 students, 40% FRL); Harker Heights H S (math 29% / reading 60%, grade F, #652 of 1,632 statewide, top 43%, 2,359 students, 34% FRL).
- Market conditions: Rents flat; 272 active listings in the ZIP; 40 comparable units currently listed for rent nearby; rentals lingering (median 46d on market — plan ~5-8 weeks vacancy on turnover, expect pricing pressure); 58% of comp listings sitting > 30 days — soft ceiling on asking rent; solid renter incomes; 3,222 units permitted in Bell County in 2024 (246 in 5+ unit buildings).
Forward outlook
- Local home prices are declining (-3.0%/yr); year-one equity from $2k of loan paydown is wiped out by about $7k of value loss. Plan a longer hold.
- Bell County population projected at +21% by 2050 — long-run rental-demand tailwind backs the buy-and-hold thesis.
Negotiation context
- It's been on market 60 days — a 3% lower offer ($212k) is reasonable based on typical stale-listing flexibility.
- 7 sale attempts since 21y ago; this cycle's ask has dropped $31k (12%) from the opening price — seller is motivated, your offer sets the floor, not the list.
- Current owner paid $159k; 38% above their basis — modest negotiation headroom, anchor on the comps not their cost.
Risks & watch-outs
- Climate carrying-cost: major wind risk, 59% chance of damaging wind over 30y; extreme-heat days projected 7→24/yr by 2055 (HVAC capex compounding) — expect insurance premiums to compound above CPI over the hold.
Questions for the listing agent
- What do current leases actually rent for vs. the listed asking? Can we see a recent rent roll and the last 12 months of T-12 income?
- It's been on market 60 days. Have you received any prior offers? Is the seller open to a 15% concession, seller financing, or rate buy-down credit?
- Is there a deadline driving the sale (1031 exchange, divorce, estate, relocation)? That informs how much negotiation room exists.
- The area grade is low — what's the realistic commute time and amenity access for the typical tenant pool here? Any planned neighborhood developments (good or bad) we should know about?
- What's the average days-on-market for RENTAL listings here right now (not sales)? A rising rental-DOM trend means longer vacancies and softer asking-rent achievability than the comps imply.
- What's the recent tenant-quality profile in this submarket — average credit score on applications, eviction rate, late-payment / NSF rate, and stable-employment percentage? A property-management company in the area should have these aggregated.
- How much new for-sale + rental construction is in the pipeline within 1–3 miles? Heavy new supply typically softens prices + rents 12–24 months out; constrained supply supports both.
Investment metrics
- 1% rule
- 0.86% ✗
- Cap rate
- 5.28%
- Cash-on-cash
- -3.61%
- DSCR
- 0.84
- GRM
- 9.7
CMA / ARV
- ARV (median comp)
- $269,652
- List price
- $219,000
- Delta
- -18.78%
- Verdict
- UNDERPRICED
- Comps
- 20 within 1.0 mi
Show comp detail 12 sales within ~0.75 mi
| Address | Dist | Beds/Ba | Sqft | Sold | Price | $/sf | Match |
|---|---|---|---|---|---|---|---|
| 5404 Kemosabe Dr | 0.32mi | 4/2.0 | 2,147 (-2%) | 6mo | $407,500 | $190 | 77 |
| 2210 Calumet Dr | 0.22mi | 4/2.0 | 2,351 (+7%) | 2mo | $299,990 | $128 | 76 |
| 104 Missouri Dr | 0.18mi | 4/2.0 | 2,400 (+10%) | 7mo | $360,000 | $150 | 70 |
| 110 Harvest Loop | 0.32mi | 3/2.5 (-1) | 2,097 (-4%) | 4mo | $254,900 | $122 | 67 |
| 606 E Briarwood Ln | 0.61mi | 4/2.0 | 2,265 (+3%) | 2mo | $292,000 | $129 | 64 |
| 5105 Birmingham Cir | 0.53mi | 4/2.5 | 2,312 (+6%) | 3mo | $249,000 | $108 | 62 |
| 6300 Emilie Ln | 0.36mi | 3/2.0 (-1) | 2,378 (+8%) | 4mo | $266,000 | $112 | 61 |
| 2423 Catawba Loop | 0.45mi | 4/2.0 | 2,014 (-8%) | 7mo | $265,000 | $132 | 60 |
| 210 Black Hawk Trl | 0.41mi | 3/2.0 (-1) | 1,990 (-9%) | 6mo | $259,000 | $130 | 56 |
| 210 W Iowa Dr | 0.73mi | 4/2.0 | 2,351 (+7%) | 6mo | $335,000 | $142 | 49 |
| 1705 Redwood Dr | 0.56mi | 3/2.0 (-1) | 2,417 (+10%) | 6mo | $300,000 | $124 | 47 |
| 108 Oakmont | 0.70mi | 4/2.0 | 1,874 (-14%) | 7mo | $200,000 | $107 | 38 |
Match score weights: distance 35% · size 25% · config 20% · recency 20%. Top-matched comps best support the ARV.
Projected returns pro-forma
-3.0% appreciation · 0.93% rent growth · sell at horizon
- IRR
- -24.9%
- Equity multiple
- 0.17×
- Total profit
- $-50,959
- Equity at exit
- $32,654
- IRR
- -29.3%
- Equity multiple
- -0.21×
- Total profit
- $-74,145
- Equity at exit
- $18,935
Cash invested: $61,320 (down + closing). Projections, not guarantees.
Landlord ↔ Tenant lean methodology
- Overall (STATE)
- 87 Strongly Landlord-Friendly
- State Texas
- 87 Strongly Landlord-Friendly · R+5
- County
- — inherits STATE
- City
- — inherits STATE
ZIP-level market 76548
- Home prices YoY
- -25.2%
- Rents YoY
- 0.9%
- Active inventory
- 272
- Price-to-rent
- 9.7×
Monthly cashflow live
- Estimated rent
- $1,888 high interval (Pro) →
- Mortgage (P&I)
- −$1,148
- Tax from tax record
- −$436 /mo · $5,235/yr
- Insurance
- −$91
- HOA
- −$0
- Vacancy / Maint / Mgmt
- −$396
- Net cashflow
- $-184
Break-even live
Sensitivity live
| Price | -10% $-60 | -5% $-122 | +0% $-184 | +5% $-246 | +10% $-308 |
|---|---|---|---|---|---|
| Rent | -10% $-334 | -5% $-259 | +0% $-184 | +5% $-110 | +10% $-35 |
| Rate | -1.0pp $-74 | -0.5pp $-129 | base $-184 | +0.5pp $-241 | +1.0pp $-299 |
UW: 25.0% down · 7.5% · 30yr · 1.5% tax · 5.0% vac · 8.0% maint · 8.0% mgmt
Financing live
Cash to close
- Down payment
- $54,750
- Closing costs
- $6,570
- Reserves months
- —
- Total cash needed
- —
Loan-product check · same deal, 3 products live
Conventional
25% down · 7.5% · 30yr
- Down + closing
- —
- Monthly P&I
- —
- Monthly cashflow
- —
- DSCR
- —
- Eligible?
- —
Personal DTI + credit; lowest rate.
DSCR
20% down · 8.5% · 30yr
- Down + closing
- —
- Monthly P&I
- —
- Monthly cashflow
- —
- DSCR
- —
- Eligible?
- —
No personal income docs; deal must DSCR.
Hard money
10% down · 12.0% · 12mo
- Down + closing
- —
- Monthly P&I
- —
- Monthly cashflow
- —
- DSCR
- —
- Eligible?
- —
Short-term bridge; refi at stabilization.
Rent comps 40 comps
| Address | Beds | Baths | Sqft | Rent | $/sqft | DOM | Units | Dist |
|---|---|---|---|---|---|---|---|---|
| 2128 Modoc Dr Harker Heights, TX | 4.0 | 2.0 | 2283 | $1,652 | $0.72 | 25d | 1 | 0.17mi |
| 226 Lottie Ln Harker Heights, TX | 3.0 | 2.0 | 2469 | $1,727 | $0.70 | 45d | 1 | 0.21mi |
| 3020 Rain Dance Loop Harker Heights, TX | 3.0 | 2.5 | 2212 | $2,150 | $0.97 | 45d | 1 | 0.31mi |
| 2208 Illinois Dr Harker Heights, TX | 3.0 | 2.5 | 1894 | $1,795 | $0.95 | 25d | 1 | 0.42mi |
| 6110 Melanie Dr Killeen, TX | 3.0 | 2.0 | 1814 | $1,900 | $1.05 | 25d | 1 | 0.44mi |
| 5402 Birmingham Cir Killeen, TX | 4.0 | 2.0 | 2194 | $1,900 | $0.87 | 45d | 1 | 0.44mi |
| 5302 Rose Garden Loop Unit 100P Killeen, TX | 3.0 | 2.0 | 2492 | $1,500 | $0.60 | 15d | 1 | 0.44mi |
| 5322 Birmingham Cir Killeen, TX | 4.0 | 2.0 | 1773 | $1,667 | $0.94 | 45d | 1 | 0.47mi |
| 307 Illinois Dr Harker Heights, TX | 3.0 | 2.0 | 2195 | $1,875 | $0.85 | 45d | 1 | 0.51mi |
| 2304 Skipcha Dr Harker Heights, TX | 3.0 | 2.0 | 1892 | $1,895 | $1.00 | 15d | 1 | 0.54mi |
| 5106 White Rose Dr Killeen, TX | 3.0 | 2.0 | 1419 | $1,650 | $1.16 | 45d | 1 | 0.71mi |
| 1612 Harley Dr Harker Heights, TX | 4.0 | 2.0 | 1449 | $1,495 | $1.03 | 45d | 1 | 0.74mi |
| 5110 Glenoak Dr Killeen, TX | 4.0 | 2.0 | 1929 | $1,795 | $0.93 | 45d | 1 | 0.86mi |
| 2105 Ocelot Cir Harker Heights, TX | 5.0 | 3.0 | 2441 | $2,100 | $0.86 | 25d | 1 | 0.89mi |
| 5006 Parkwood Dr Killeen, TX | 4.0 | 2.0 | 1506 | $1,550 | $1.03 | 45d | 1 | 0.95mi |
| 210 Dale Earnhardt Dr Unit B Harker Heights, TX | 3.0 | 2.0 | 2275 | $1,250 | $0.55 | 45d | 1 | 1.06mi |
| 407 Chieftain Trl Harker Heights, TX | 4.0 | 2.5 | 2068 | $1,995 | $0.96 | 45d | 1 | 1.06mi |
| 5311 White Rock Dr Killeen, TX | 4.0 | 2.5 | 2247 | $1,975 | $0.88 | 45d | 1 | 1.10mi |
| 5010 White Rock Dr Killeen, TX | 3.0 | 2.5 | 2249 | $1,600 | $0.71 | 45d | 1 | 1.10mi |
| 4901 Citrine Dr Killeen, TX | 3.0 | 2.0 | 1751 | $1,695 | $0.97 | 45d | 1 | 1.14mi |
| 5107 Daybreak Dr Killeen, TX | 3.0 | 2.0 | 2301 | $1,175 | $0.51 | 25d | 1 | 1.14mi |
| 5510 Shawn Dr Killeen, TX | 4.0 | 2.0 | 2186 | $1,700 | $0.78 | 25d | 1 | 1.15mi |
| 5006 Morning Star Ln Killeen, TX | 4.0 | 2.0 | 1611 | $1,695 | $1.05 | 25d | 1 | 1.15mi |
| 4905 Citrine Dr Killeen, TX | 4.0 | 2.0 | 1904 | $1,795 | $0.94 | 25d | 1 | 1.16mi |
| 5005 Shawn Dr Killeen, TX | 3.0 | 2.0 | 1530 | $1,400 | $0.92 | 45d | 1 | 1.16mi |
| 803 White Meadow Ln Unit B Harker Heights, TX | 3.0 | 2.5 | 2802 | $1,450 | $0.52 | 45d | 1 | 1.18mi |
| 603 Mustang Trl Harker Heights, TX | 4.0 | 2.5 | 2074 | $2,000 | $0.96 | 45d | 1 | 1.18mi |
| 4806 Greenlee Dr Killeen, TX | 3.0 | 2.5 | 1620 | $1,400 | $0.86 | 45d | 1 | 1.22mi |
| 6403 Flag Stone Dr Killeen, TX | 4.0 | 2.5 | 2203 | $1,900 | $0.86 | 25d | 1 | 1.22mi |
| 423 Reservation Dr Harker Heights, TX | 4.0 | 3.0 | 2629 | $2,250 | $0.86 | 45d | 1 | 1.23mi |
| 313 Jeff Gordon Dr Unit A Harker Heights, TX | 3.0 | 2.0 | 2316 | $1,125 | $0.49 | 15d | 1 | 1.25mi |
| 4807 Teal Dr Killeen, TX | 3.0 | 2.0 | 1421 | $1,495 | $1.05 | 45d | 1 | 1.28mi |
| 4716 Glass Mountain Dr Killeen, TX | 3.0 | 2.0 | 1480 | $1,545 | $1.04 | 15d | 1 | 1.28mi |
| 5600 Golden Dr Killeen, TX | 4.0 | 2.0 | 1735 | $1,697 | $0.98 | 45d | 1 | 1.28mi |
| 4609 Telluride Dr Killeen, TX | 3.0 | 2.0 | 1641 | $1,550 | $0.94 | 25d | 1 | 1.29mi |
| 5617 Cobalt Ln Killeen, TX | 4.0 | 2.0 | 1714 | $1,875 | $1.09 | 45d | 1 | 1.33mi |
| 5702 Graphite Dr Killeen, TX | 3.0 | 2.5 | 2300 | $2,100 | $0.91 | 25d | 1 | 1.34mi |
| 5900 Sulfur Spring Dr Killeen, TX | 3.0 | 2.0 | 1692 | $1,645 | $0.97 | 25d | 1 | 1.36mi |
| 1701 Lynx Cir Harker Heights, TX | 4.0 | 2.0 | 1451 | $2,800 | $1.93 | 45d | 1 | 1.36mi |
| 5606 Montrose Dr Killeen, TX | 4.0 | 3.0 | 2555 | $1,955 | $0.77 | 25d | 1 | 1.43mi |
Listing history 20 events
-
2026-05-11price $219,000 1111-char remark
Show marketing remark (1111 chars)
Welcome to this charming 4-bedroom, 2-bath brick home in the heart of Harker Heights! Designed with both comfort and functionality in mind, this home features a spacious layout that opens seamlessly into the living area perfect for everyday living and entertaining. Enjoy cozy evenings by the wood-burning fireplace and gatherings centered around the kitchen’s island, complete with granite countertops, tile backsplash, and beautiful custom oak cabinetry. All appliances, including the refrigerator, will convey. The private primary suite is thoughtfully situated on one side of the home and offers its own screened-in patio—an ideal spot to unwind. The en-suite bathroom features a separate 5-jetted tub and shower, dual vanities, and ample space. Additional features include a manual garage, generous living areas, and a layout full of potential to make your own. Conveniently located near Fort Hood, shopping, dining, and more, this home offers both location and opportunity. Being sold as-is, this property is perfect for buyers looking to add their personal touch and create something special.
-
2026-03-20$249,900 Active 1111-char remark
Show marketing remark (1111 chars)
Welcome to this charming 4-bedroom, 2-bath brick home in the heart of Harker Heights! Designed with both comfort and functionality in mind, this home features a spacious layout that opens seamlessly into the living area perfect for everyday living and entertaining. Enjoy cozy evenings by the wood-burning fireplace and gatherings centered around the kitchen’s island, complete with granite countertops, tile backsplash, and beautiful custom oak cabinetry. All appliances, including the refrigerator, will convey. The private primary suite is thoughtfully situated on one side of the home and offers its own screened-in patio—an ideal spot to unwind. The en-suite bathroom features a separate 5-jetted tub and shower, dual vanities, and ample space. Additional features include a manual garage, generous living areas, and a layout full of potential to make your own. Conveniently located near Fort Hood, shopping, dining, and more, this home offers both location and opportunity. Being sold as-is, this property is perfect for buyers looking to add their personal touch and create something special.
-
2020-05-06soldstatus
-
2020-03-14status Pending
-
2020-03-14status Active
-
2020-03-14status Pending
-
2020-03-04status Active
-
2020-02-25status Pending
-
2020-02-07price $189,400
-
2019-11-03price $191,400
-
2019-10-23$193,400 Active
-
2019-10-21historical
-
2019-10-02price $193,500
-
2019-08-09$195,000 Active
-
2016-01-25soldstatus
-
2015-07-02$169,900
-
2005-05-24soldstatus $159,000
-
2005-05-24soldstatus
-
2005-03-04$159,900
-
1997-12-09soldstatus
ⓘ Source: listings_history table (triggers on properties + properties_extension) + one-shot
backfill from property_details.listing_events for pre-trigger history.
Tax reassessment forecast TX · Resets to sale price
- Current annual tax
- $5,235 · $436/mo
- Projected year-2 tax
- $5,235 · $436/mo
- Expected delta
- $0/yr ($0/mo · 0.0%)
ⓘ Screening estimate from a state-policy table — verify with the county assessor before closing.
Climate risk First Street
- Flood 1/10 Low FEMA zone X (unshaded) · 0% chance over 30 yrs
- Wildfire 3/10 Moderate
- Heat 8/10 Severe 7 d/yr ≥107°F today · 24 d/yr by 30 yrs out
- Wind 6/10 Major 59% chance of damaging wind over 30 yrs
- Air quality 1/10 Low 0 unhealthy d/yr today · 0 by 30 yrs out
Nearby sold comps map
Loading sold comps map…
Walkable amenities ~0.75 mi
Loading nearby amenities…
Taxation est. · year 1
- Rental income
- $22,655
- − Mortgage interest
- −$12,267
- − Property taxes
- −$5,235
- − Insurance
- −$1,095
- − Repairs & maintenance
- −$1,812
- − Management
- −$1,812
- − Depreciation
- −$6,371
- Taxable loss
- −$5,937
- Est. tax savings @ 24.0%
- +$1,425
- After-tax cash flow
- $-788/yr
For passive investors: Depreciation is non-cash, so a rental often shows a tax loss while cash-flowing — sheltering income. Rental losses are passive: they offset passive income freely, and up to $25,000/yr can offset ordinary (W-2) income if you actively participate and your MAGI is under $100k (phasing out to $0 by $150k); unused losses carry forward. On sale, claimed depreciation is recaptured at up to 25%, and gains may owe capital-gains tax (a 1031 exchange can defer both). Figures are a year-1 estimate at your 24.0% rate — not tax advice; consult a CPA.
Schools (NCES district)
- District
- Killeen ISD
- NCES district ID
- 4825660
- Math proficiency
- 31% ▼ -16.00%
- Reading proficiency
- 38% ▼ -3.00%
- Median HH income
- $47,665
- Composite
- 29.69/100
- National rank
- #6458
- State rank
- #524 of 826 in TX
Livability — Harker Heights
- Score
- 79/100
- State rank
- #61
- US rank
- #2271
Category grades
Schools grade is shown separately in the Schools card above.
Census & demographics
- Census place
- Harker Heights, TX
- County
- Bell County · 345,090 people
- City population
- 33,729
- Metro
- Killeen-Temple, TX
- Population (ZIP)
- 33,729
- Household income
- $80,520
- Rent vs Own
- Severe rent burden
- 672.0
Population outlook (Bell County) Hauer SSP2
- Today (2025)
- 371,114 people
- By 2030
- 389,104 · +4.8%
- By 2040
- 420,592 · +13.3%
- By 2050
- 447,779 · +20.7%
- By 2075
- 499,130 · +34.5%
- By 2100
- 505,680 · +36.3%
Race, ethnicity, and origin ACS 2023
- Neighborhood character
- Highly diverse neighborhood (Simpson 0.72)
- Race & ethnicity
- White 40% Black 27% Hispanic / Latino 22% Two or more races 13% Asian 3% Pacific Islander 2% Native American 1%
- Hispanic origin (detail)
- Mexican 14% Puerto Rican 3%
- Common ancestry
- Iranian 3% Lithuanian 2% Italian 2%
- Foreign-born
- 10% · Canada, Vietnam, South Korea
- Languages at home
- 83% English-only · Spanish 9% French/Haitian/Cajun 2% German/W. Germanic 1%
Political lean MEDSL · Bell
- 2024 margin
- R (+16.2) · D 41.3% · R 57.6% · Other 1.1%
- 2008→2024 swing
- -6.5pp toward R · 2008: -9.8pp · 2024: -16.2pp
- All cycles
- 2024: R+16.2 2020: R+8.5 2016: R+15.1 2012: R+16.4 2008: R+9.8
Not yet ingested
- Civics
- —
Market trends
- HPI YoY
- ▼ -52.76%
- Current HPI
- 156.4499
- Rent YoY
- ▲ 0.93%
- Metro
- Killeen-Temple, TX
- State GDP YoY
- ▲ 3.95%
- F500 in state
- 110
Industry mix (Fortune 500 HQ in TX)
| Industry | F500 HQs | Revenue |
|---|---|---|
| Energy | 16 | $1,198B |
|
||
| Technology | 5 | $198B |
|
||
| Engineering / Construction | 4 | $72B |
|
||
| Energy Services | 3 | $60B |
|
||
| Utilities | 3 | $41B |
|
||
| Healthcare | 2 | $330B |
|
||
Price history
+37.0% since first listed20 events — show timeline
- 2026-05-11 Price Changed $219,000 CTXMLS
- 2026-03-20 Listed $249,900 CTXMLS
- 2020-05-06 Sold (Public Records) — Public Records
- 2020-03-14 Pending — CTXMLS
- 2020-03-14 Relisted — CTXMLS
- 2020-03-14 Pending — CTXMLS
- 2020-03-04 Relisted — CTXMLS
- 2020-02-25 Pending — CTXMLS
- 2020-02-07 Price Changed $189,400 CTXMLS
- 2019-11-03 Price Changed $191,400 CTXMLS
- 2019-10-23 Listed $193,400 CTXMLS
- 2019-10-21 Listing Removed — CTXMLS
- 2019-10-02 Price Changed $193,500 CTXMLS
- 2019-08-09 Listed $195,000 CTXMLS
- 2016-01-25 Sold (Public Records) — Public Records
- 2015-07-02 Listed $169,900 CTXMLS
- 2005-05-24 Sold (Public Records) — Public Records
- 2005-05-24 Sold (MLS) $159,000 CTXMLS
- 2005-03-04 Listed $159,900 CTXMLS
- 1997-12-09 Sold (Public Records) — Public Records
Property tax history
+3.3%/yrLatest (2025): $5,235 · -3.8% YoY. Source: county tax records.
Cash-flow waterfall
monthlySold comps — $/sqft
last 12 mo · ≤1 miLoading sold comps…