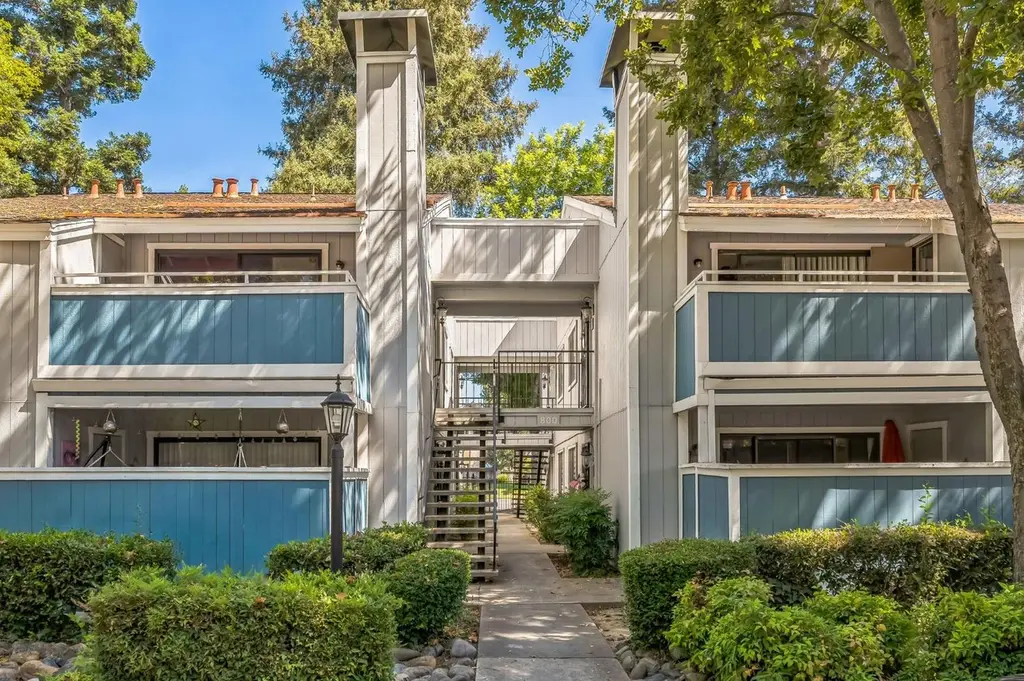
800 Del Verde #6 · Sacramento, CA
Flood risk No data
- FEMA flood zone
- —
- Chance of flooding over 30 yrs
- —
- Est. flood insurance / yr
- —
Fire risk No data
- Est. fire insurance / yr
- —
Heat risk No data
- Hot days now (above threshold)
- —
- Hot days in 30 yrs
- —
Wind risk No data
- Chance of severe wind over 30 yrs
- —
Air-quality risk No data
- Unhealthy air days now
- —
- Unhealthy air days in 30 yrs
- —
Risk factors via First Street. Map © Google.
Why this score? — see what drove the D grade
The composite is a weighted blend of 9 inputs, each scored 0–100. Each bar is that input's sub-score; the figure is the points it added to the 100-point composite (weight × sub-score).
- ARV discount +15.0/15.0
- Cash flow +7.2/30.0
- 1% rule +5.0/10.0
- Schools +4.1/10.0
- Livability +3.6/5.0
- Rent growth +3.5/5.0
- Condition / age +2.5/5.0
- DSCR +1.4/10.0
- Appreciation +0.0/10.0
$200,000
🖨 Deal sheet (PDF) 📄 Offer letter ✓ Due diligence
Listing remarks
Welcome to this upper-level 2-bedroom, 1-bath condo in the desirable Del Verde Estates community! Tucked inside a secure gated complex, this bright and airy unit features an open-concept layout, spacious living room with fireplace, and a private balcony perfect for relaxing or entertaining. The kitchen offers ample counter space and cabinetry, while both bedrooms are generously sized with plenty of natural light. Enjoy updated finishes throughout, central HVAC, and in-unit laundry. Conveniently located in vibrant South Natomasjust minutes from downtown Sacramento, major freeways (I-80 & I-5), shopping centers, dining, and entertainment. The community also includes a sparkling pool, sp
Key facts
- Gated complex
- Central hvac
- Ample counter space
Tags
Neighborhood map
What this means for you Summary
Snapshot
- This is a 2-bed/1.0-bath condo listed at $200k.
Deal economics
- At list price, monthly cash flow is $-276 ($-3k/yr) — negative.
- To cash-flow at today's rent, offer at most $151k (24.4% below list).
- Meets the 1% rule at list price ($2k rent vs $200k).
- Recommended offer: $151k (24.4% below list) — sets the bar for cash-flow.
- Cap rate 4.6% vs local median 3.0% in Sacramento — top-decile yield for the area; either an underpriced asset or a hidden risk that comps aren't pricing in. Stress-test before assuming the spread holds.
Location & tenants
- Location reads 71/100 on livability (#218 in CA) — a middle-class / working-renter tenant base. Strengths: amenities A+, commute A+, housing A; Watch: crime F, cost of living F.
- Natomas Unified (urban): math 33% / reading 60% proficiency, ranked #155 of 517 in CA (top 30%) — families likely to look elsewhere, expect single-tenant / working-renter base with shorter leases.
- Zoned schools: Jefferson (713 students, 68% FRL); Natomas Middle (662 students, 65% FRL); Natomas High (math 17% / reading 37%, grade F, #788 of 1,170 statewide, top 69%, 1,229 students, 63% FRL) — zoned schools average 65% FRL vs 45% district-wide (21 pts higher); higher-poverty schools than district average — tighter screening recommended.
- Zoned-school proficiency averages 27% at this address vs 46% district-wide (-20 pts) — the specific schools serving this property underperform the Natomas Unified average; the district grade overstates school quality for this exact location.
- Market conditions: Rents rising (+3.8%/yr); 136 active listings in the ZIP; 36 comparable units currently listed for rent nearby; rentals leasing fast (median 1d on market — plan ~1-2 weeks tenant-placement turnaround); solid renter incomes; 6,825 units permitted in Sacramento County in 2024 (1,752 in 5+ unit buildings).
Forward outlook
- Local home prices are declining (-3.0%/yr); year-one equity from $1k of loan paydown is wiped out by about $6k of value loss. Plan a longer hold.
- Sacramento County population projected at +17% by 2050 — long-run rental-demand tailwind backs the buy-and-hold thesis.
Negotiation context
- It's been on market 140 days — a 12% lower offer ($176k) is reasonable based on typical stale-listing flexibility.
- Current owner paid $54k; list at $200k implies a 274% gain — meaningful room to come down on a strong offer.
Risks & watch-outs
- Watch-outs: HOA is 27% of rent.
Questions for the listing agent
- What do current leases actually rent for vs. the listed asking? Can we see a recent rent roll and the last 12 months of T-12 income?
- It's been on market 140 days. Have you received any prior offers? Is the seller open to a 24% concession, seller financing, or rate buy-down credit?
- What does the HOA fee cover, when was the last increase, and are there any pending special assessments or reserve-fund shortfalls?
- Any open or pending special assessments — roof, HVAC, plumbing, elevator, façade? What's the per-unit balance and payoff schedule, and is the seller paying it off at close or rolling it to the buyer?
- Why hasn't it sold? Are there any deal-killer items the seller is aware of (foundation, flood, title, zoning, code violations)?
- Is there a deadline driving the sale (1031 exchange, divorce, estate, relocation)? That informs how much negotiation room exists.
- Schools are D-rated, which usually means shorter tenancies and higher turnover. Who's the typical renter profile here, and what's been the actual vacancy rate?
- Crime grade is F in this area — have there been break-ins, vandalism, or insurance claims at this property in the last 3 years? What carrier currently insures it and at what premium?
- The area grade is low — what's the realistic commute time and amenity access for the typical tenant pool here? Any planned neighborhood developments (good or bad) we should know about?
- What's the average days-on-market for RENTAL listings here right now (not sales)? A rising rental-DOM trend means longer vacancies and softer asking-rent achievability than the comps imply.
- What's the recent tenant-quality profile in this submarket — average credit score on applications, eviction rate, late-payment / NSF rate, and stable-employment percentage? A property-management company in the area should have these aggregated.
- How much new apartment / multifamily construction is in the pipeline within 1–3 miles? Heavy new supply (>2% of stock underway) typically softens rents 12–24 months out; light construction supports rent growth.
Investment metrics
- 1% rule
- 1.00% ✓
- Cap rate
- 4.64%
- Cash-on-cash
- -5.91%
- DSCR
- 0.74
- GRM
- 8.3
CMA / ARV
- ARV (median comp)
- $261,751
- List price
- $200,000
- Delta
- -23.59%
- Verdict
- UNDERPRICED
- Comps
- 20 within 1.0 mi
Projected returns pro-forma
-3.0% appreciation · 3.82% rent growth · sell at horizon
- IRR
- -24.9%
- Equity multiple
- 0.14×
- Total profit
- $-47,993
- Equity at exit
- $29,821
- IRR
- -17.2%
- Equity multiple
- -0.00×
- Total profit
- $-56,165
- Equity at exit
- $17,292
Cash invested: $56,000 (down + closing). Projections, not guarantees.
Landlord ↔ Tenant lean methodology
- Overall (STATE)
- 18 Strongly Tenant-Friendly
- State California
- 18 Strongly Tenant-Friendly · D+13
- County
- — inherits STATE
- City
- — inherits STATE
ZIP-level market 95833
- Rents YoY
- 3.8%
- Active inventory
- 136
- Price-to-rent
- 8.3×
Monthly cashflow live
- Estimated rent
- $2,001 high interval (Pro) →
- Mortgage (P&I)
- −$1,049
- Tax from tax record
- −$186 /mo · $2,234/yr
- Insurance
- −$83
- HOA
- −$538
- Vacancy / Maint / Mgmt
- −$420
- Net cashflow
- $-276
Break-even live
Sensitivity live
| Price | -10% $-163 | -5% $-219 | +0% $-276 | +5% $-332 | +10% $-389 |
|---|---|---|---|---|---|
| Rent | -10% $-434 | -5% $-355 | +0% $-276 | +5% $-197 | +10% $-118 |
| Rate | -1.0pp $-175 | -0.5pp $-225 | base $-276 | +0.5pp $-328 | +1.0pp $-380 |
UW: 25.0% down · 7.5% · 30yr · 1.5% tax · 5.0% vac · 8.0% maint · 8.0% mgmt
Financing live
Cash to close
- Down payment
- $50,000
- Closing costs
- $6,000
- Reserves months
- —
- Total cash needed
- —
Loan-product check · same deal, 3 products live
Conventional
25% down · 7.5% · 30yr
- Down + closing
- —
- Monthly P&I
- —
- Monthly cashflow
- —
- DSCR
- —
- Eligible?
- —
Personal DTI + credit; lowest rate.
DSCR
20% down · 8.5% · 30yr
- Down + closing
- —
- Monthly P&I
- —
- Monthly cashflow
- —
- DSCR
- —
- Eligible?
- —
No personal income docs; deal must DSCR.
Hard money
10% down · 12.0% · 12mo
- Down + closing
- —
- Monthly P&I
- —
- Monthly cashflow
- —
- DSCR
- —
- Eligible?
- —
Short-term bridge; refi at stabilization.
Rent comps 36 comps
| Address | Beds | Baths | Sqft | Rent | $/sqft | DOM | Units | Dist |
|---|---|---|---|---|---|---|---|---|
| 600 Del Verde Cir #7 Sacramento, CA | 2.0 | 1.0 | 956 | $1,600 | $1.67 | 45d | 1 | 0.07mi |
| 600 Del Verde Cir #2 Sacramento, CA | 2.0 | 1.0 | 956 | $1,950 | $2.04 | 45d | 1 | 0.07mi |
| 3310 Winter Park Dr Sacramento, CA | 1.0–2.0 | 1.0–2.0 | 786 | $1,915 | $2.44 | 0d | 6 | 0.23mi |
| 3334 Smoketree Dr Sacramento, CA | 1.0–2.0 | 1.0–2.0 | 749 | $1,965 | $2.62 | 0d | 25 | 0.35mi |
| 2028 San Juan Rd Sacramento, CA | 2.0 | 2.0 | 875 | $2,070 | $2.37 | 25d | 1 | 0.39mi |
| 2028 San Juan Rd Sacramento, CA | 1.0 | 1.0 | 655 | $1,520 | $2.32 | 14d | 1 | 0.39mi |
| 2028 San Juan Rd Sacramento, CA | 2.0 | 2.0 | 875 | $1,915 | $2.19 | 0d | 1 | 0.39mi |
| 3271 Azevedo Dr Unit 140 Sacramento, CA | 2.0 | 2.0 | 875 | $1,800 | $2.06 | 45d | 1 | 0.49mi |
| 3271 Azevedo Dr Unit 0222 Sacramento, CA | 2.0 | 2.0 | 875 | $1,800 | $2.06 | 5d | 1 | 0.49mi |
| 3271 Azevedo Dr Unit 0254 Sacramento, CA | 1.0 | 1.0 | 655 | $1,499 | $2.29 | 25d | 1 | 0.49mi |
| 3271 Azevedo Dr Unit 266 Sacramento, CA | 2.0 | 1.0 | 825 | $1,600 | $1.94 | 25d | 1 | 0.49mi |
| 3271 Azevedo Dr Unit 164 Sacramento, CA | 2.0 | 1.0 | 825 | $1,695 | $2.05 | 45d | 1 | 0.49mi |
| 3525 Cattle Dr Sacramento, CA | 3.0 | 2.0 | 1025 | $2,295 | $2.24 | 25d | 1 | 0.51mi |
| 3271 Azevedo Dr Sacramento, CA | 1.0–2.0 | 1.0–2.0 | 765 | $1,800 | $2.35 | 12d | 21 | 0.55mi |
| 2025 W El Camino Ave Sacramento, CA | 1.0–2.0 | 1.0–2.0 | 744 | $2,053 | $2.76 | 0d | 1 | 0.88mi |
| 3421 N Freeway Blvd Sacramento, CA | 2.0 | 1.0–2.0 | 862 | $3,030 | $3.51 | 0d | 86 | 0.91mi |
| 2660 Stonecreek Dr Sacramento, CA | 1.0 | 1.0 | 680 | $1,620 | $2.38 | 0d | 1 | 0.98mi |
| 2660 Stonecreek Dr Sacramento, CA | 2.0 | 2.0 | 887 | $2,055 | $2.32 | 21d | 1 | 0.98mi |
| 2490 Quiet Trail Ln Sacramento, CA | 1.0–3.0 | 1.0–2.0 | 1113 | $2,924 | $2.63 | 0d | 14 | 0.99mi |
| 801 San Juan Rd Sacramento, CA | 1.0–2.0 | 1.0–2.0 | 765 | $1,660 | $2.17 | 3d | 3 | 1.00mi |
| 2593 Millcreek Dr Sacramento, CA | 1.0–2.0 | 1.0–2.0 | 787 | $1,800 | $2.29 | 0d | 9 | 1.04mi |
| 2450 Seamist Dr Sacramento, CA | 1.0–2.0 | 1.0–2.0 | 755 | $1,804 | $2.39 | 0d | 20 | 1.09mi |
| 3741 Tice Creek Way Sacramento, CA | 2.0 | 2.5 | 1027 | $2,295 | $2.23 | 9d | 1 | 1.10mi |
| 1560 Waterwheel Dr Sacramento, CA | 2.0 | 2.0 | 1070 | $1,925 | $1.80 | 0d | 1 | 1.19mi |
| 1560 Waterwheel Dr Sacramento, CA | 1.0 | 1.0 | 770 | $1,745 | $2.27 | 5d | 1 | 1.19mi |
| 1560 Waterwheel Dr Sacramento, CA | 2.0 | 2.0 | 1119 | $2,115 | $1.89 | 25d | 1 | 1.19mi |
| 2900 Weald Way Sacramento, CA | 1.0–3.0 | 1.0–2.0 | 1055 | $2,616 | $2.48 | 0d | 16 | 1.21mi |
| 2205 Natomas Park Dr Sacramento, CA | 1.0–3.0 | 1.0–2.0 | 900 | $2,590 | $2.88 | 0d | 20 | 1.27mi |
| 3351 Duckhorn Dr Sacramento, CA | 1.0 | 1.0 | 981 | $1,988 | $2.03 | 0d | 8 | 1.28mi |
| 2800 Grasslands Dr Sacramento, CA | 1.0–2.0 | 1.0–2.0 | 941 | $2,495 | $2.65 | 0d | 12 | 1.28mi |
| 3761 E Commerce Way Sacramento, CA | 2.0 | 1.0–2.0 | 865 | $3,231 | $3.74 | 3d | 29 | 1.31mi |
| 3791 E Commerce Way Sacramento, CA | 2.0 | 1.0–2.0 | 834 | $2,920 | $3.50 | 0d | 20 | 1.36mi |
| 4101 Innovator Dr Sacramento, CA | 1.0–2.0 | 1.0–2.0 | 950 | $2,730 | $2.87 | 0d | 10 | 1.37mi |
| 4100 Innovator Dr Sacramento, CA | 2.0 | 1.0–2.0 | 860 | $2,990 | $3.47 | 0d | 20 | 1.39mi |
| 2580 W El Camino Ave #14103 Sacramento, CA | 2.0 | 1.0 | 1113 | $2,095 | $1.88 | 0d | 1 | 1.46mi |
| 3610 Duckhorn Dr Sacramento, CA | 1.0–3.0 | 1.0–2.0 | 927 | $2,615 | $2.82 | 0d | 29 | 1.47mi |
HOA detail condo
- Monthly dues
- $538 · $6,456/yr
- Likely covers
- poolsecurity
- Assessments
- None detected in remarks — confirm with the listing agent.
Listing history 14 events
-
2026-06-21days on market $200,000 Active 140 DOM
-
2026-06-18days on market $200,000 Active 137 DOM
-
2026-06-17days on market $200,000 Active 136 DOM
-
2026-06-16days on market $200,000 Active 135 DOM
-
2026-06-15days on market $200,000 Active 134 DOM
-
2026-06-13days on market $200,000 Active 132 DOM
-
2026-06-13days on market $200,000 Active 131 DOM
-
2026-06-09days on market $200,000 Active 128 DOM
-
2026-06-08days on market $200,000 Active 127 DOM
-
2026-06-07days on market $200,000 Active 126 DOM
-
2026-06-05days on market $200,000 Active 123 DOM
-
2026-06-01days on market $200,000 Active 122 DOM
-
2026-05-31days on market $200,000 Active 121 DOM
-
1981-11-25soldstatus $53,500
ⓘ Source: listings_history table (triggers on properties + properties_extension) + one-shot
backfill from property_details.listing_events for pre-trigger history.
Tax reassessment forecast CA · Resets to sale price
- Current annual tax
- $2,234 · $186/mo
- Projected year-2 tax
- $2,234 · $186/mo
- Expected delta
- $0/yr ($0/mo · 0.0%)
ⓘ Screening estimate from a state-policy table — verify with the county assessor before closing.
Nearby sold comps map
Loading sold comps map…
Walkable amenities ~0.75 mi
Loading nearby amenities…
Taxation est. · year 1
- Rental income
- $24,007
- − Mortgage interest
- −$11,203
- − Property taxes
- −$2,234
- − Insurance
- −$1,000
- − Repairs & maintenance
- −$1,921
- − Management
- −$1,921
- − HOA
- −$6,456
- − Depreciation
- −$5,818
- Taxable loss
- −$6,545
- Est. tax savings @ 24.0%
- +$1,571
- After-tax cash flow
- $-1,739/yr
For passive investors: Depreciation is non-cash, so a rental often shows a tax loss while cash-flowing — sheltering income. Rental losses are passive: they offset passive income freely, and up to $25,000/yr can offset ordinary (W-2) income if you actively participate and your MAGI is under $100k (phasing out to $0 by $150k); unused losses carry forward. On sale, claimed depreciation is recaptured at up to 25%, and gains may owe capital-gains tax (a 1031 exchange can defer both). Figures are a year-1 estimate at your 24.0% rate — not tax advice; consult a CPA.
Schools (NCES district)
- District
- Natomas Unified
- NCES district ID
- 0600036
- Math proficiency
- 33% ▼ -1.00%
- Reading proficiency
- 60% ▲ 13.00%
- Median HH income
- $67,969
- Composite
- 41.49/100
- National rank
- #3457
- State rank
- #155 of 517 in CA
Livability — Sacramento
- Score
- 71/100
- State rank
- #218
- US rank
- #6957
Category grades
Schools grade is shown separately in the Schools card above.
Census & demographics
- Census place
- Sacramento, CA
- County
- Sacramento County · 1,539,646 people
- City population
- 761,410
- Metro
- Sacramento-Roseville-Folsom, CA
- Population (ZIP)
- 42,265
- Household income
- $97,792
- Rent vs Own
- Severe rent burden
- 1743.0
Population outlook (Sacramento County) Hauer SSP2
- Today (2025)
- 1,660,763 people
- By 2030
- 1,732,990 · +4.3%
- By 2040
- 1,855,755 · +11.7%
- By 2050
- 1,941,335 · +16.9%
- By 2075
- 2,046,162 · +23.2%
- By 2100
- 1,961,444 · +18.1%
Race, ethnicity, and origin ACS 2023
- Neighborhood character
- Highly diverse neighborhood (Simpson 0.73)
- Race & ethnicity
- Hispanic / Latino 41% White 27% Two or more races 20% Black 12% Asian 10% Pacific Islander 1%
- Hispanic origin (detail)
- Mexican 35%
- Common ancestry
- Russian 2% Lithuanian 1% Italian 1%
- Foreign-born
- 19% · Canada, China, Vietnam
- Languages at home
- 66% English-only · Spanish 22% Other Indo-European 4% Other Asian/Pacific 2%
Political lean MEDSL · Sacramento
- 2024 margin
- D (+19.7) · D 58.1% · R 38.4% · Other 3.5%
- 2008→2024 swing
- +0.7pp no change · 2008: 19.0pp · 2024: 19.7pp
- All cycles
- 2024: D+19.7 2020: D+25.3 2016: D+23.7 2012: D+16.3 2008: D+19.0
Not yet ingested
- Civics
- —
Market trends
- HPI YoY
- ▼ -230.78%
- Current HPI
- 307.7212
- Rent YoY
- ▲ 3.82%
- Metro
- Sacramento-Roseville-Folsom, CA
- State GDP YoY
- ▲ 3.21%
- F500 in state
- 116
Industry mix (Fortune 500 HQ in CA)
| Industry | F500 HQs | Revenue |
|---|---|---|
| Technology | 27 | $1,492B |
|
||
| Financial Services | 3 | $174B |
|
||
| Retail | 3 | $44B |
|
||
| Insurance | 3 | $26B |
|
||
| Media / Entertainment | 2 | $115B |
|
||
| Pharmaceuticals / Biotech | 2 | $62B |
|
||
Price history
1 event — show timeline
- 1981-11-25 Sold (Public Records) $53,500 Public Records
Property tax history
+4.5%/yrLatest (2025): $2,234 · -15.2% YoY. Source: county tax records.
Cash-flow waterfall
monthlySold comps — $/sqft
last 12 mo · ≤1 miLoading sold comps…