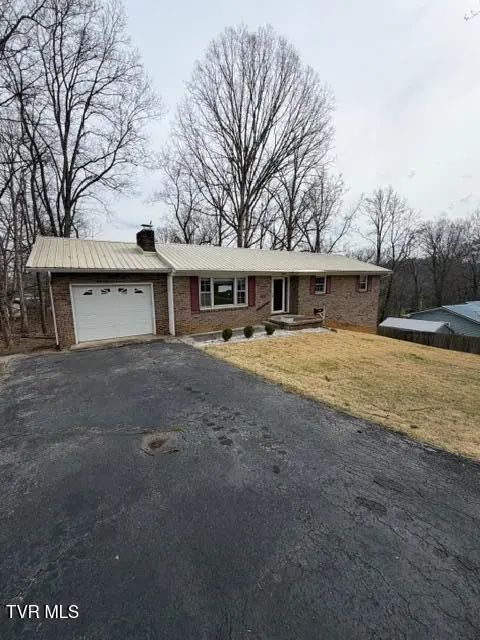
1933 Noble St · Kingsport, TN
Flood risk 1/10 · Minimal
- FEMA flood zone
- X (unshaded)
- Chance of flooding over 30 yrs
- 0.0%
- Est. flood insurance / yr
- $473 – $860
Fire risk 4/10 · Minor
- Est. fire insurance / yr
- $949 – $1,763
Heat risk 4/10 · Minor
- Hot days now (above 100°F)
- 5 days/yr
- Hot days in 30 yrs
- 15 days/yr
Wind risk 2/10 · Minimal
- Chance of severe wind over 30 yrs
- —
Air-quality risk 1/10 · Minimal
- Unhealthy air days now
- 0 days/yr
- Unhealthy air days in 30 yrs
- 0 days/yr
Risk factors via First Street. Map © Google.
Why this score? — see what drove the C grade
The composite is a weighted blend of 9 inputs, each scored 0–100. Each bar is that input's sub-score; the figure is the points it added to the 100-point composite (weight × sub-score).
- Cash flow +23.1/30.0
- ARV discount +7.5/15.0
- DSCR +7.4/10.0
- 1% rule +5.5/10.0
- Livability +3.6/5.0
- Schools +3.0/10.0
- Rent growth +2.5/5.0
- Condition / age +2.5/5.0
- Appreciation +1.3/10.0
$193,600
🖨 Deal sheet 📄 Offer letter ✓ Due diligence
Listing remarks
Welcome Home to Noble Street This lovely brick ranch in the heart of Kingsport is the one you've been waiting for. From the moment you step inside, you'll love the warmth of the hardwood floors and the inviting fireplace in the oversized living room. The home features a traditional 3-bedroom layout and sits on a sprawling 0.70-acre lot, giving you all the privacy and space of a rural setting with the convenience of an established neighborhood. Bonus: the full basement provides all the extra space you could ever need. Don't miss this opportunity to own a piece of Midfields Addition! This is a HUD home being sold in AS IS Condition without warranty of any kind. All information is offered
Key facts
- Inviting fireplace
- Full basement
- Hardwood floors
Tags
Property features AI
Exterior
- Parking: Asphalt parking; One garage space
- Utilities: Public water; Public sewer; Cable available; Underground utilities
- Home design: Single-family house; One level; Residential property
- Construction: Brick construction; Composition roof; Block foundation; Built as a house
- Exterior features: Storm door(s); Partially wooded lot with rolling slope; Curbs
Interior
- Kitchen: Cooktop; Refrigerator
- Flooring: Carpet; Hardwood; Vinyl
- Bathrooms: One full bathroom; One half bathroom
- Heating & cooling: Central heating; Heat pump; Central air conditioning
- Interior features: Insulated windows; Two fireplaces located in the den and living room; Partially finished basement; Eight total rooms
- Laundry & utility: Washer hookup; Electric dryer hookup
Neighborhood map
What this means for you Summary
Snapshot
- This is a 3-bed/2.0-bath single-family listed at $194k.
Deal economics
- At list price, monthly cash flow is $347 ($4k/yr) — positive.
- The deal already cash-flows at list — no discount required.
- Meets the 1% rule at list price ($2k rent vs $194k).
- Recommended offer: $182k (6.0% below list) — sets the bar for market timing.
- Cap rate 8.4% vs local median 3.8% in Kingsport — top-decile yield for the area; either an underpriced asset or a hidden risk that comps aren't pricing in. Stress-test before assuming the spread holds.
Location & tenants
- Location reads 71/100 on livability (#39 in TN) — a middle-class / working-renter tenant base. Strengths: cost of living A+, health & safety A+, housing A; Watch: amenities C-, crime F, commute F.
- Kingsport (urban): math 35% / reading 38% proficiency, ranked #26 of 139 in TN (top 19%) — families likely to look elsewhere, expect single-tenant / working-renter base with shorter leases.
- Zoned schools: Theodore Roosevelt Elementary School (math 27% / reading 22%, grade F, #546 of 952 statewide, top 61%, 277 students, 0% FRL); John Sevier Middle School (math 21% / reading 24%, grade F, #172 of 333 statewide, top 52%, 750 students, 0% FRL); Dobyns - Bennett High School (math 23% / reading 56%, grade F, #28 of 332 statewide, top 9%, 2,514 students, 0% FRL) — zoned schools average 0% FRL vs 47% district-wide (47 pts lower); this property's tenant base skews higher-income than the district average.
- Market conditions: 30 active listings in the ZIP; 5 comparable units currently listed for rent nearby; rentals at typical pace (median 21d on market — plan ~3-4 weeks tenant-placement turnaround); 453 units permitted in Sullivan County in 2024 (6 in 5+ unit buildings).
Forward outlook
- Local home prices are declining (-3.0%/yr); year-one equity from $1k of loan paydown is wiped out by about $6k of value loss. Plan a longer hold.
- Sullivan County population projected to shrink 5% by 2050 — rents likely to lag national; underwrite the cash flow, not the appreciation.
Negotiation context
- It's been on market 72 days — a 6% lower offer ($182k) is reasonable based on typical stale-listing flexibility.
Questions for the listing agent
- It's been on market 72 days. Have you received any prior offers? Is the seller open to a 6% concession, seller financing, or rate buy-down credit?
- Built in 1969 — when were the roof, HVAC, electrical panel, plumbing, and water heater last replaced?
- Why hasn't it sold? Are there any deal-killer items the seller is aware of (foundation, flood, title, zoning, code violations)?
- Is there a deadline driving the sale (1031 exchange, divorce, estate, relocation)? That informs how much negotiation room exists.
- Schools are D-rated, which usually means shorter tenancies and higher turnover. Who's the typical renter profile here, and what's been the actual vacancy rate?
- Crime grade is F in this area — have there been break-ins, vandalism, or insurance claims at this property in the last 3 years? What carrier currently insures it and at what premium?
- What's the average days-on-market for RENTAL listings here right now (not sales)? A rising rental-DOM trend means longer vacancies and softer asking-rent achievability than the comps imply.
- What's the recent tenant-quality profile in this submarket — average credit score on applications, eviction rate, late-payment / NSF rate, and stable-employment percentage? A property-management company in the area should have these aggregated.
- How much new for-sale + rental construction is in the pipeline within 1–3 miles? Heavy new supply typically softens prices + rents 12–24 months out; constrained supply supports both.
Investment metrics
- 1% rule
- 1.05% ✓
- Cap rate
- 8.45%
- Cash-on-cash
- 7.69%
- DSCR
- 1.34
- GRM
- 8.0
CMA / ARV
- ARV (on-the-fly)
- $432,228
- Comps found
- 4
Show comp detail 4 sales within ~0.75 mi
| Address | Dist | Beds/Ba | Sqft | Sold | Price | $/sf | Match |
|---|---|---|---|---|---|---|---|
| 548 Holston River Dr | 0.52mi | 3/3.0 | 2,588 (+8%) | 11mo | $347,000 | $134 | 48 |
| 437 Holston River Dr | 0.74mi | 4/3.0 (+1) | 2,295 (-4%) | 23mo | $415,000 | $181 | 31 |
| 864 Granby Rd Rd | 0.74mi | 3/2.5 | 2,700 (+13%) | 16mo | $425,000 | $157 | 29 |
| 884 Granby Rd | 0.74mi | 4/3.5 (+1) | 2,630 (+10%) | 21mo | $513,500 | $195 | 20 |
Match score weights: distance 35% · size 25% · config 20% · recency 20%. Top-matched comps best support the ARV.
Projected returns pro-forma
-3.0% appreciation · 3.0% rent growth · sell at horizon
- IRR
- -4.6%
- Equity multiple
- 0.83×
- Total profit
- $-9,264
- Equity at exit
- $28,866
- IRR
- 5.1%
- Equity multiple
- 1.38×
- Total profit
- $20,340
- Equity at exit
- $16,739
Cash invested: $54,208 (down + closing). Projections, not guarantees.
Landlord ↔ Tenant lean methodology
- Overall (STATE)
- 87 Strongly Landlord-Friendly
- State Tennessee
- 87 Strongly Landlord-Friendly · R+13
- County
- — inherits STATE
- City
- — inherits STATE
ZIP-level market 37665
- Home prices YoY
- -2.6%
- Active inventory
- 30
- Price-to-rent
- 8.0×
Monthly cashflow live
- Estimated rent
- $2,027 high interval (Pro) →
- Mortgage (P&I)
- −$1,015
- Tax from tax record
- −$158 /mo · $1,893/yr
- Insurance
- −$81
- HOA
- −$0
- Vacancy / Maint / Mgmt
- −$426
- Net cashflow
- $347
Break-even live
UW: 25.0% down · 7.5% · 30yr · 1.5% tax · 5.0% vac · 8.0% maint · 8.0% mgmt
Financing live
Cash to close
- Down payment
- $48,400
- Closing costs
- $5,808
- Reserves months
- —
- Total cash needed
- —
Loan-product check · same deal, 3 products live
Conventional
25% down · 7.5% · 30yr
- Down + closing
- —
- Monthly P&I
- —
- Monthly cashflow
- —
- DSCR
- —
- Eligible?
- —
Personal DTI + credit; lowest rate.
DSCR
20% down · 8.5% · 30yr
- Down + closing
- —
- Monthly P&I
- —
- Monthly cashflow
- —
- DSCR
- —
- Eligible?
- —
No personal income docs; deal must DSCR.
Hard money
10% down · 12.0% · 12mo
- Down + closing
- —
- Monthly P&I
- —
- Monthly cashflow
- —
- DSCR
- —
- Eligible?
- —
Short-term bridge; refi at stabilization.
Rent comps 5 comps
| Address | Beds | Baths | Sqft | Rent | $/sqft | DOM | Units | Dist |
|---|---|---|---|---|---|---|---|---|
| 541 N Holston River Dr Kingsport, TN | 3.0 | 2.5 | 1705 | $2,000 | $1.17 | 13d | 1 | 0.60mi |
| 1100 Harrison Ave Unit 1 Kingsport, TN | 3.0 | 1.0 | 2100 | $1,695 | $0.81 | 13d | 1 | 0.84mi |
| 1441 Gress Mag Mtn Kingsport, TN | 3.0 | 2.5 | 2218 | $2,200 | $0.99 | 21d | 1 | 1.20mi |
| 1240 Stamp Lodge Rd Kingsport, TN | 4.0 | 2.5 | 1991 | $2,170 | $1.09 | 21d | 1 | 1.25mi |
| 1104 Tay Sta Kingsport, TN | 3.0 | 3.0 | 2136 | $2,250 | $1.05 | 21d | 1 | 1.34mi |
Listing history 20 events
-
2026-06-19days on market $193,600 Active 72 DOM
-
2026-06-18days on market $193,600 Active 71 DOM
-
2026-06-17days on market $193,600 Active 70 DOM
-
2026-06-16days on market $193,600 Active 69 DOM
-
2026-06-15days on market $193,600 Active 68 DOM
-
2026-06-14pricedays on market $193,600 Active 66 DOM
-
2026-06-13days on market $220,000 Active 65 DOM
-
2026-06-10days on market $220,000 Active 63 DOM
-
2026-06-09days on market $220,000 Active 62 DOM
-
2026-06-09status $220,000 Active 61 DOM
-
2026-06-08days on market $220,000 Active Under Contract 61 DOM
-
2026-06-07days on market $220,000 Active Under Contract 60 DOM
-
2026-06-05days on market $220,000 Active Under Contract 57 DOM
-
2026-06-03days on market $220,000 Active Under Contract 56 DOM
-
2026-06-02days on market $220,000 Active Under Contract 55 DOM
-
2026-06-01days on market $220,000 Active Under Contract 54 DOM
-
2026-05-31days on market $220,000 Active Under Contract 53 DOM
-
2026-05-30days on market $220,000 Active Under Contract 52 DOM
-
2026-05-15historical Active Under Contract
-
2026-04-08$220,000 Active
ⓘ Source: listings_history table (triggers on properties + properties_extension) + one-shot
backfill from property_details.listing_events for pre-trigger history.
Tax reassessment forecast TN · Resets to sale price
- Current annual tax
- $1,893 · $158/mo
- Projected year-2 tax
- $1,893 · $158/mo
- Expected delta
- $0/yr ($0/mo · 0.0%)
ⓘ Screening estimate from a state-policy table — verify with the county assessor before closing.
Climate risk First Street
- Flood 1/10 Low FEMA zone X (unshaded) · 0% chance over 30 yrs
- Wildfire 4/10 Moderate
- Heat 4/10 Moderate 5 d/yr ≥100°F today · 15 d/yr by 30 yrs out
- Wind 2/10 Low
- Air quality 1/10 Low 0 unhealthy d/yr today · 0 by 30 yrs out
Nearby sold comps map
Loading sold comps map…
Walkable amenities ~0.75 mi
Loading nearby amenities…
Taxation est. · year 1
- Rental income
- $24,321
- − Mortgage interest
- −$10,845
- − Property taxes
- −$1,893
- − Insurance
- −$968
- − Repairs & maintenance
- −$1,946
- − Management
- −$1,946
- − Depreciation
- −$5,632
- Taxable income
- $1,092
- Est. tax owed @ 24.0%
- −$262
- After-tax cash flow
- $3,907/yr
For passive investors: Depreciation is non-cash, so a rental often shows a tax loss while cash-flowing — sheltering income. Rental losses are passive: they offset passive income freely, and up to $25,000/yr can offset ordinary (W-2) income if you actively participate and your MAGI is under $100k (phasing out to $0 by $150k); unused losses carry forward. On sale, claimed depreciation is recaptured at up to 25%, and gains may owe capital-gains tax (a 1031 exchange can defer both). Figures are a year-1 estimate at your 24.0% rate — not tax advice; consult a CPA.
Schools (NCES district)
- District
- Kingsport
- NCES district ID
- 4702190
- Math proficiency
- 35% ▼ -12.00%
- Reading proficiency
- 38% ▼ -5.00%
- Median HH income
- $38,017
- Composite
- 30.44/100
- National rank
- #6233
- State rank
- #26 of 139 in TN
Livability — Kingsport
- Score
- 71/100
- State rank
- #39
- US rank
- #6587
Category grades
Schools grade is shown separately in the Schools card above.
Census & demographics
- Census place
- Kingsport, TN
- City population
- 83,493
- Population (ZIP)
- 5,156
Population outlook (Sullivan County) Hauer SSP2
- Today (2025)
- 157,030 people
- By 2030
- 156,415 · -0.4%
- By 2040
- 153,778 · -2.1%
- By 2050
- 149,018 · -5.1%
- By 2075
- 138,068 · -12.1%
- By 2100
- 119,927 · -23.6%
Race, ethnicity, and origin ACS 2023
- Neighborhood character
- Predominantly White (94%)
- Race & ethnicity
- White 94% Hispanic / Latino 4% Two or more races 3%
- Common ancestry
- Italian 6% Serbian 3% Slovak 1%
- Foreign-born
- 1% · Canada
- Languages at home
- 93% English-only · Spanish 7%
Political lean MEDSL · Sullivan
- 2024 margin
- Solid R (+55.0) · D 22.0% · R 77.0% · Other 1.0%
- 2008→2024 swing
- -13.6pp toward R · 2008: -41.3pp · 2024: -55.0pp
- All cycles
- 2024: R+55.0 2020: R+51.9 2016: R+56.2 2012: R+47.2 2008: R+41.3
Not yet ingested
- Civics
- —
Market trends
- HPI YoY
- ▼ -7.36%
- Current HPI
- 275.7692
- Rent YoY
- —
- Metro
- —
- State GDP YoY
- ▲ 2.78%
- F500 in state
- 22
Industry mix (Fortune 500 HQ in TN)
| Industry | F500 HQs | Revenue |
|---|---|---|
| Healthcare | 3 | $91B |
|
||
| Retail | 3 | $72B |
|
||
| Transportation / Logistics | 1 | $88B |
|
||
| Paper / Packaging | 1 | $19B |
|
||
| Insurance | 1 | $13B |
|
||
| Energy | 1 | $12B |
|
||
Price history
2 events — show timeline
- 2026-05-15 Contingent — TVRMLS
- 2026-04-08 Listed $220,000 TVRMLS
Property tax history
+3.4%/yrLatest (2025): $1,893 · +23.2% YoY. Source: county tax records.
Cash-flow waterfall
monthlySold comps — $/sqft
last 12 mo · ≤1 miLoading sold comps…