109 E Main Blvd · Church Hill, TN
Flood risk No data
- FEMA flood zone
- —
- Chance of flooding over 30 yrs
- —
- Est. flood insurance / yr
- —
Fire risk No data
- Est. fire insurance / yr
- —
Heat risk No data
- Hot days now (above threshold)
- —
- Hot days in 30 yrs
- —
Wind risk No data
- Chance of severe wind over 30 yrs
- —
Air-quality risk No data
- Unhealthy air days now
- —
- Unhealthy air days in 30 yrs
- —
Risk factors via First Street. Map © Google.
Why this score? — see what drove the B- grade
The composite is a weighted blend of 9 inputs, each scored 0–100. Each bar is that input's sub-score; the figure is the points it added to the 100-point composite (weight × sub-score).
- Cash flow +30.0/30.0
- 1% rule +10.0/10.0
- DSCR +10.0/10.0
- ARV discount +7.5/15.0
- Livability +3.6/5.0
- Rent growth +2.5/5.0
- Condition / age +2.2/5.0
- Schools +2.0/10.0
- Appreciation +0.0/10.0
$99,995
🖨 Deal sheet (PDF) 📄 Offer letter ✓ Due diligence
Listing remarks
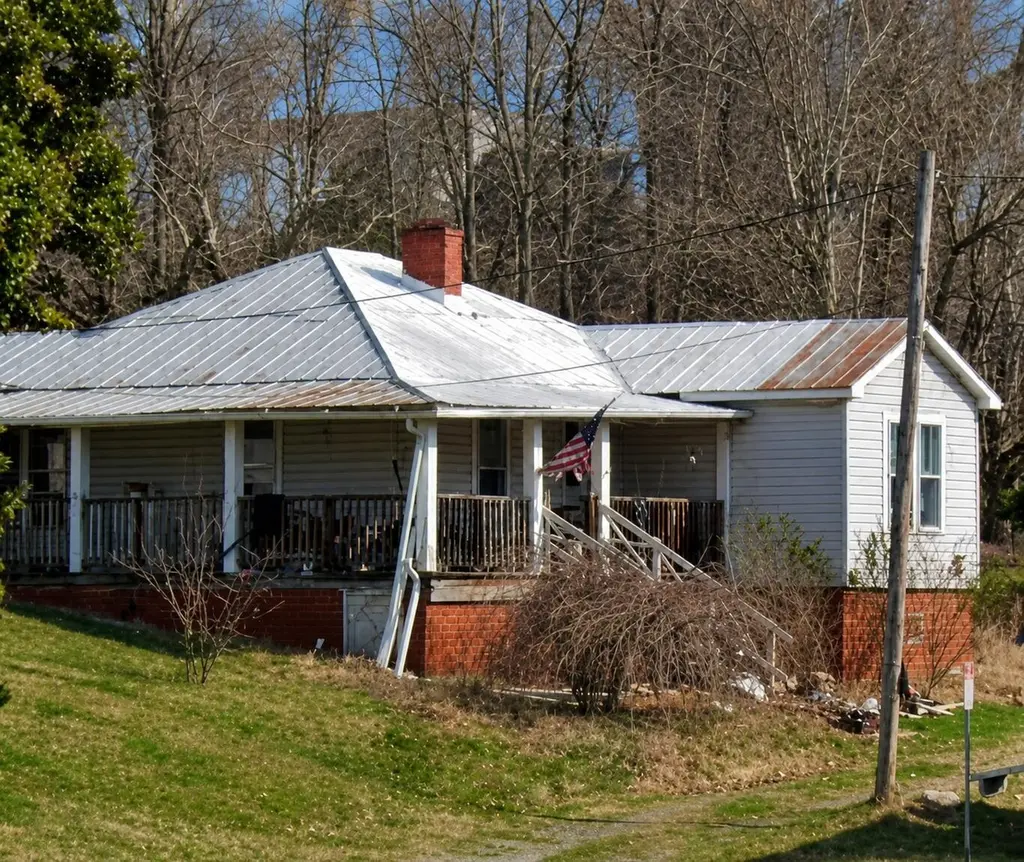
Step into this 3 bed, 2 bath home set on about an acre of land, complete with a covered front porch that’s perfectly suited for relaxing. It’s full of potential and ready for its next owner to add their own touches. With a solid layout and plenty of room to update to your style, this is a great opportunity to own a home at an attractive price and make it truly yours.
Key facts
- 1 acre lot
- Built 1946
- Listed 5 days
Property features AI
Finance
- HOA & community: Pets allowed: contact seller/agent
Exterior
- Utilities: Public water; Public sewer; Water available
- Home design: Single-family residence; One story; Frame construction
- Construction: Brick/mortar foundation
- Exterior features: Stable(s); 1-acre lot
Interior
- Kitchen: Dishwasher
- Bedrooms: 3 bedrooms (all on the main level)
- Flooring: Laminate flooring
- Bathrooms: 2 full bathrooms
- Heating & cooling: Central heating; Central air conditioning
- Interior features: Built-in features
Neighborhood map
What this means for you Summary
Snapshot
- This is a 3-bed/2.0-bath single-family listed at $100k. Condition is rated fair.
Deal economics
- At list price, monthly cash flow is $1k ($15k/yr) — positive.
- The deal already cash-flows at list — no discount required.
- Meets the 1% rule at list price ($2k rent vs $100k).
- Cap rate 21.7% vs local median 3.5% in Church Hill — top-decile yield for the area; either an underpriced asset or a hidden risk that comps aren't pricing in. Stress-test before assuming the spread holds.
Location & tenants
- Location reads 71/100 on livability (#42 in TN) — a middle-class / working-renter tenant base. Strengths: crime A+, cost of living A+, housing A+; Watch: employment D+, amenities F, commute F.
- Hawkins County (rural): math 23% / reading 26% proficiency, ranked #93 of 139 in TN (top 67%) — low school quality limits family demand, transient renter base, plan for 1-2y turnover.
- Zoned schools: Church Hill Elementary (math 27% / reading 37%, grade F, #369 of 952 statewide, top 42%, 328 students, 0% FRL); Church Hill Intermediate School (math 27% / reading 27%, grade F, #128 of 333 statewide, top 40%, 372 students, 0% FRL); Volunteer High School (math 19% / reading 37%, grade F, #101 of 332 statewide, top 30%, 1,045 students, 0% FRL) — zoned schools average 0% FRL vs 57% district-wide (57 pts lower); this property's tenant base skews higher-income than the district average.
- Market conditions: 125 active listings in the ZIP; 1 comparable units currently listed for rent nearby; 151 units permitted in Hawkins County in 2024 (0 in 5+ unit buildings).
Forward outlook
- Local home prices are declining (-3.0%/yr); year-one equity from $691 of loan paydown is wiped out by about $3k of value loss. Plan a longer hold.
- Hawkins County population projected at -17% by 2050 — secular population decline; favor cash flow + early exit over multi-decade hold.
- At projected returns (-3.0% appreciation + 3.0% rent growth), your $28k cash investment doubles in ~3 years — after that, you're playing with house money.
Negotiation context
- Only 6 days on market — expect competitive offers; lowballing is unlikely to land.
Risks & watch-outs
- Watch-outs: built in 1946 — expect roof / HVAC / electrical / plumbing capex.
Questions for the listing agent
- Have any recent inspections been done? Can we get a copy of the seller's disclosures and any deferred-maintenance estimates?
- Built in 1946 — when were the roof, HVAC, electrical panel, plumbing, and water heater last replaced?
- Is there a deadline driving the sale (1031 exchange, divorce, estate, relocation)? That informs how much negotiation room exists.
- Schools are F-rated, which usually means shorter tenancies and higher turnover. Who's the typical renter profile here, and what's been the actual vacancy rate?
- What's the average days-on-market for RENTAL listings here right now (not sales)? A rising rental-DOM trend means longer vacancies and softer asking-rent achievability than the comps imply.
- What's the recent tenant-quality profile in this submarket — average credit score on applications, eviction rate, late-payment / NSF rate, and stable-employment percentage? A property-management company in the area should have these aggregated.
- How much new for-sale + rental construction is in the pipeline within 1–3 miles? Heavy new supply typically softens prices + rents 12–24 months out; constrained supply supports both.
Investment metrics
- 1% rule
- 2.50% ✓
- Cap rate
- 21.70%
- Cash-on-cash
- 55.03%
- DSCR
- 3.45
- GRM
- 3.3
CMA / ARV
- ARV (on-the-fly)
- $248,368
- Comps found
- 7
Show comp detail 7 sales within ~0.75 mi
| Address | Dist | Beds/Ba | Sqft | Sold | Price | $/sf | Match |
|---|---|---|---|---|---|---|---|
| 220 Fern St | 0.41mi | 3/2.0 | 1,682 (+3%) | 2mo | $140,000 | $83 | 75 |
| 119 Cole Ln | 0.35mi | 3/2.0 | 1,476 (-10%) | 2mo | $225,000 | $152 | 66 |
| 327 Oak St | 0.41mi | 3/2.0 | 1,736 (+6%) | 12mo | $290,000 | $167 | 60 |
| 217 Fern St | 0.42mi | 4/2.0 (+1) | 1,600 (-2%) | 23mo | $262,000 | $164 | 53 |
| 117 Parkview St | 0.69mi | 3/2.0 | 1,716 (+5%) | 14mo | $266,000 | $155 | 48 |
| 411 Main Blvd | 0.66mi | 3/2.0 | 1,808 (+11%) | 5mo | $234,000 | $129 | 47 |
| 403 Main Blvd | 0.61mi | 3/1.0 | 1,406 (-14%) | 14mo | $125,000 | $89 | 32 |
Match score weights: distance 35% · size 25% · config 20% · recency 20%. Top-matched comps best support the ARV.
Projected returns pro-forma
-3.0% appreciation · 3.0% rent growth · sell at horizon
- IRR
- 53.3%
- Equity multiple
- 3.34×
- Total profit
- $65,610
- Equity at exit
- $14,910
- IRR
- 58.5%
- Equity multiple
- 6.81×
- Total profit
- $162,585
- Equity at exit
- $8,646
Cash invested: $27,999 (down + closing). Projections, not guarantees.
Landlord ↔ Tenant lean methodology
- Overall (STATE)
- 87 Strongly Landlord-Friendly
- State Tennessee
- 87 Strongly Landlord-Friendly · R+13
- County
- — inherits STATE
- City
- — inherits STATE
ZIP-level market 37642
- Home prices YoY
- -16.0%
- Active inventory
- 125
- Price-to-rent
- 3.3×
Monthly cashflow live
- Estimated rent
- $2,500 medium interval (Pro) →
- Mortgage (P&I)
- −$524
- Tax est. 1.5%
- −$125 /mo · $1,500/yr
- Insurance
- −$42
- HOA
- −$0
- Vacancy / Maint / Mgmt
- −$525
- Net cashflow
- $1,284
Break-even live
Sensitivity live
| Price | -10% $1,353 | -5% $1,319 | +0% $1,284 | +5% $1,249 | +10% $1,215 |
|---|---|---|---|---|---|
| Rent | -10% $1,086 | -5% $1,185 | +0% $1,284 | +5% $1,383 | +10% $1,481 |
| Rate | -1.0pp $1,334 | -0.5pp $1,309 | base $1,284 | +0.5pp $1,258 | +1.0pp $1,232 |
UW: 25.0% down · 7.5% · 30yr · 1.5% tax · 5.0% vac · 8.0% maint · 8.0% mgmt
Financing live
Cash to close
- Down payment
- $24,999
- Closing costs
- $3,000
- Reserves months
- —
- Total cash needed
- —
Loan-product check · same deal, 3 products live
Conventional
25% down · 7.5% · 30yr
- Down + closing
- —
- Monthly P&I
- —
- Monthly cashflow
- —
- DSCR
- —
- Eligible?
- —
Personal DTI + credit; lowest rate.
DSCR
20% down · 8.5% · 30yr
- Down + closing
- —
- Monthly P&I
- —
- Monthly cashflow
- —
- DSCR
- —
- Eligible?
- —
No personal income docs; deal must DSCR.
Hard money
10% down · 12.0% · 12mo
- Down + closing
- —
- Monthly P&I
- —
- Monthly cashflow
- —
- DSCR
- —
- Eligible?
- —
Short-term bridge; refi at stabilization.
Rent comps 1 comps
| Address | Beds | Baths | Sqft | Rent | $/sqft | DOM | Units | Dist |
|---|---|---|---|---|---|---|---|---|
| 403 Silver Lake Rd Church Hill, TN | 3.0 | 1.0 | 1413 | $2,500 | $1.77 | 45d | 1 | 1.28mi |
Listing history 5 events
-
2026-06-08days on market $99,995 Active 6 DOM
-
2026-06-07days on market $99,995 Active 5 DOM
-
2026-06-05days on market $99,995 Active 2 DOM
-
2026-06-03remarks 369-char remark
-
2026-06-03$99,995 Active 1 DOM
ⓘ Source: listings_history table (triggers on properties + properties_extension) + one-shot
backfill from property_details.listing_events for pre-trigger history.
Nearby sold comps map
Loading sold comps map…
Walkable amenities ~0.75 mi
Loading nearby amenities…
Taxation est. · year 1
- Rental income
- $30,000
- − Mortgage interest
- −$5,601
- − Property taxes
- −$1,500
- − Insurance
- −$500
- − Repairs & maintenance
- −$2,400
- − Management
- −$2,400
- − Depreciation
- −$2,909
- Taxable income
- $14,690
- Est. tax owed @ 24.0%
- −$3,526
- After-tax cash flow
- $11,882/yr
For passive investors: Depreciation is non-cash, so a rental often shows a tax loss while cash-flowing — sheltering income. Rental losses are passive: they offset passive income freely, and up to $25,000/yr can offset ordinary (W-2) income if you actively participate and your MAGI is under $100k (phasing out to $0 by $150k); unused losses carry forward. On sale, claimed depreciation is recaptured at up to 25%, and gains may owe capital-gains tax (a 1031 exchange can defer both). Figures are a year-1 estimate at your 24.0% rate — not tax advice; consult a CPA.
Condition & rehab AI · 12 photos
This single-family home requires moderate renovations, focusing on the roof, exterior, and bathroom. Upgrades will significantly enhance its curb appeal and value.
Repairs flagged
- Major roof — Significant rust and damage
- Major exterior siding — Peeling paint and ivy growth
- Major bathroom — Outdated fixtures and clutter
Value-add opportunities
- Both Paint exterior siding — Enhances curb appeal and value
- Both Replace roof — Critical structural repair and improves energy efficiency
- Both Update bathroom fixtures — Modernizes space and adds value
Renovation cost estimate screening
| Repair item | Severity | Est. cost |
|---|---|---|
| roof · Significant rust and damage | Major | $15,000–50,000 |
| exterior siding · Peeling paint and ivy growth | Major | $15,000–50,000 |
| bathroom · Outdated fixtures and clutter | Major | $15,000–50,000 |
| Total estimated repair cost · 3 items | $45,000–150,000 |
Value-add ROI direction
- Both Paint exterior siding — Enhances curb appeal and value ↑
- Both Replace roof — Critical structural repair and improves energy efficiency ↑
- Both Update bathroom fixtures — Modernizes space and adds value ↑
ⓘ Cost ranges are severity-bucket heuristics (US national rule-of-thumb). Get contractor quotes + a written scope before underwriting a rehab budget.
Schools (NCES district)
- District
- Hawkins County
- NCES district ID
- 4701740
- Math proficiency
- 23% ▼ -9.00%
- Reading proficiency
- 26% ▼ -6.00%
- Median HH income
- $37,555
- Composite
- 20.45/100
- National rank
- #8581
- State rank
- #93 of 139 in TN
Livability — Church Hill
- Score
- 71/100
- State rank
- #42
- US rank
- #6706
Category grades
Schools grade is shown separately in the Schools card above.
Census & demographics
- Census place
- Church Hill, TN
- City population
- 14,491
- Population (ZIP)
- 14,491
Population outlook (Hawkins County) Hauer SSP2
- Today (2025)
- 55,226 people
- By 2030
- 53,784 · -2.6%
- By 2040
- 50,015 · -9.4%
- By 2050
- 45,682 · -17.3%
- By 2075
- 36,211 · -34.4%
- By 2100
- 26,536 · -52.0%
Race, ethnicity, and origin ACS 2023
- Neighborhood character
- Predominantly White (95%)
- Race & ethnicity
- White 95% Two or more races 2% Hispanic / Latino 1% Black 1%
- Common ancestry
- Serbian 2% Iranian 2% Italian 1%
- Foreign-born
- 0%
Political lean MEDSL · Hawkins
- 2024 margin
- Solid R (+68.8) · D 15.2% · R 84.0%
- 2008→2024 swing
- -26.9pp toward R · 2008: -42.0pp · 2024: -68.8pp
- All cycles
- 2024: R+68.8 2020: R+65.8 2016: R+63.4 2012: R+47.0 2008: R+42.0
Not yet ingested
- Civics
- —
Market trends
- HPI YoY
- ▼ -56.69%
- Current HPI
- 297.1526
- Rent YoY
- —
- Metro
- —
- State GDP YoY
- ▲ 2.78%
- F500 in state
- 22
Industry mix (Fortune 500 HQ in TN)
| Industry | F500 HQs | Revenue |
|---|---|---|
| Healthcare | 3 | $91B |
|
||
| Retail | 3 | $72B |
|
||
| Transportation / Logistics | 1 | $88B |
|
||
| Paper / Packaging | 1 | $19B |
|
||
| Insurance | 1 | $13B |
|
||
| Energy | 1 | $12B |
|
||
Price history
1 event — show timeline
- 2026-06-02 Listed $99,995 REALTRACS as Distributed by MLS Grid
Cash-flow waterfall
monthlySold comps — $/sqft
last 12 mo · ≤1 miLoading sold comps…