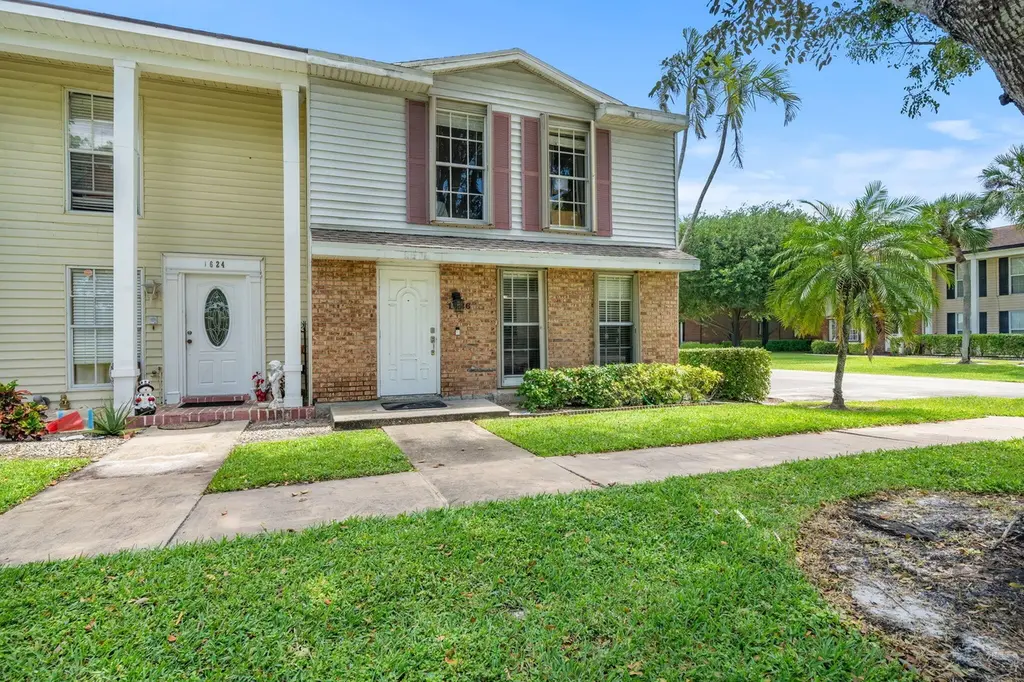
1626 Brier Patch Trl · Wellington, FL
Flood risk 2/10 · Minimal
- FEMA flood zone
- X (unshaded)
- Chance of flooding over 30 yrs
- 0.07%
- Est. flood insurance / yr
- $507 – $1,088
Fire risk 1/10 · Minimal
- Est. fire insurance / yr
- $947 – $1,759
Heat risk 10/10 · Severe
- Hot days now (above 107°F)
- 7 days/yr
- Hot days in 30 yrs
- 26 days/yr
Wind risk 10/10 · Severe
- Chance of severe wind over 30 yrs
- 99.0%
Air-quality risk 2/10 · Minimal
- Unhealthy air days now
- 0 days/yr
- Unhealthy air days in 30 yrs
- 1 days/yr
Risk factors via First Street. Map © Google.
Why this score? — see what drove the F grade
The composite is a weighted blend of 9 inputs, each scored 0–100. Each bar is that input's sub-score; the figure is the points it added to the 100-point composite (weight × sub-score).
- Cash flow +11.7/30.0
- 1% rule +4.3/10.0
- Schools +4.3/10.0
- Livability +3.7/5.0
- DSCR +3.4/10.0
- Rent growth +3.1/5.0
- Condition / age +2.5/5.0
- ARV discount +0.0/15.0
- Appreciation +0.0/10.0
$335,000
🖨 Deal sheet 📄 Offer letter ✓ Due diligence
Listing remarks MLS
Feel right at home in this two-story townhouse in the community of Brier Patch, which has twenty-eight colonial-style townhomes. This corner lot three bedrooms, two and a half bath home features a new roof, updated kitchen and bathrooms, a spacious living room, large screened-in cover patio, and much more. Located within walking distance to the Wellington Town Center and close to schools, hospitals, shopping centers, and restaurants.
Key facts
- Screened patio
- Well-kept community
- $160 HOA
Tags
Property features AI
Finance
- Other: Not waterfront
- HOA & community: HOA present with monthly fee of $160 covering common areas; Association: Victory Accounting Services; Association amenities: None listed; Pets allowed with possible restrictions and number limits
Exterior
- Parking: Assigned parking (2 spaces)
- Utilities: Public water; Public sewer; Cable connected; Electricity connected; Phone connected; Water connected; Sewer connected
- Home design: Townhouse; Two levels; Entry at level 1; Faces west; Resale property
- Construction: Stucco and wood frame construction; Shingle roof; Single-story building count listed as 1
- Exterior features: Open patio; Screened porch; Patio and porch
Interior
- Kitchen: Dishwasher; Refrigerator
- Bedrooms: No main level bedrooms
- Flooring: Tile flooring
- Bathrooms: 2 full bathrooms and 1 half bathroom (3 total); 1 bathroom on the main level
- Heating & cooling: Central heating; Central air conditioning
- Interior features: No notable built-in interior features listed; Unfurnished
- Laundry & utility: Laundry on main level; Gas water heater
Neighborhood map
What this means for you Summary
Snapshot
- This is a 3-bed/2.5-bath townhouse listed at $335k.
Deal economics
- At list price, monthly cash flow is $-100 ($-1k/yr) — negative.
- To cash-flow at today's rent, offer at most $317k (5.3% below list).
- To meet the 1% rule (rent ≥ 1% of price), the offer needs to be $312k (7.0% below list).
- Recommended offer: $312k (7.0% below list) — sets the bar for 1% rule.
- Cap rate 5.9% vs local median 3.4% in Wellington — top-decile yield for the area; either an underpriced asset or a hidden risk that comps aren't pricing in. Stress-test before assuming the spread holds.
Location & tenants
- Location reads 73/100 on livability (#294 in FL, #4,986 nationally) — a middle-class / working-renter tenant base. Strengths: crime A+, employment A+, housing A+; Watch: amenities F, commute F, cost of living F.
- Palm Beach (suburban): math 46% / reading 53% proficiency, ranked #34 of 73 in FL (top 47%) — families likely to look elsewhere, expect single-tenant / working-renter base with shorter leases.
- Zoned schools: Elbridge Gale Elementary School (math 70% / reading 75%, grade A, #281 of 2,144 statewide, top 13%, 915 students, 40% FRL); Emerald Cove Middle School (math 61% / reading 64%, grade B+, #116 of 571 statewide, top 21%, 1,241 students, 36% FRL); Wellington High School (math 57% / reading 65%, grade C+, #102 of 667 statewide, top 15%, 2,688 students, 29% FRL) — zoned schools average 35% FRL vs 52% district-wide (17 pts lower); this property's tenant base skews higher-income than the district average.
- Zoned-school proficiency averages 65% at this address vs 50% district-wide (+16 pts) — the actual schools serving this property are materially stronger than the Palm Beach average implies; a family-tenant draw the district grade alone would hide.
- Market conditions: Rents rising (+2.3%/yr); 616 active listings in the ZIP; 40 comparable units currently listed for rent nearby; rentals at typical pace (median 22d on market — plan ~3-4 weeks tenant-placement turnaround); high-income renter base; 3,974 units permitted in Palm Beach County in 2024 (1,012 in 5+ unit buildings).
- This rent runs 33% of the median local income ($112k/yr) — at the standard rent-burdened threshold; future hikes will face affordability resistance.
Forward outlook
- Local home prices are declining (-3.0%/yr); year-one equity from $2k of loan paydown is wiped out by about $10k of value loss. Plan a longer hold.
- Palm Beach County population projected at +30% by 2050 — long-run rental-demand tailwind backs the buy-and-hold thesis.
Negotiation context
- It's been on market 18 days — a 2% lower offer ($330k) is reasonable based on typical stale-listing flexibility.
- 9 sale attempts since 17y ago with the ask held roughly flat each time — persistent listings suggest the price (not the market) is what's stuck; bring a comps-based counter.
- Current owner paid $255k; 31% above their basis — modest negotiation headroom, anchor on the comps not their cost.
Risks & watch-outs
- Climate carrying-cost: severe wind risk, 99% chance of damaging wind over 30y; extreme-heat days projected 7→26/yr by 2055 (HVAC capex compounding) — expect insurance premiums to compound above CPI over the hold.
Questions for the listing agent
- What do current leases actually rent for vs. the listed asking? Can we see a recent rent roll and the last 12 months of T-12 income?
- Built in 1978 — when were the roof, HVAC, electrical panel, plumbing, and water heater last replaced?
- What does the HOA fee cover, when was the last increase, and are there any pending special assessments or reserve-fund shortfalls?
- Is there a deadline driving the sale (1031 exchange, divorce, estate, relocation)? That informs how much negotiation room exists.
- Schools are A-rated — typically a magnet for longer-tenancy family renters. What's the average tenant stay here, and is there a school-zone premium baked into asking?
- The area grade is low — what's the realistic commute time and amenity access for the typical tenant pool here? Any planned neighborhood developments (good or bad) we should know about?
- What's the average days-on-market for RENTAL listings here right now (not sales)? A rising rental-DOM trend means longer vacancies and softer asking-rent achievability than the comps imply.
- What's the recent tenant-quality profile in this submarket — average credit score on applications, eviction rate, late-payment / NSF rate, and stable-employment percentage? A property-management company in the area should have these aggregated.
- How much new for-sale + rental construction is in the pipeline within 1–3 miles? Heavy new supply typically softens prices + rents 12–24 months out; constrained supply supports both.
Investment metrics
- 1% rule
- 0.93% ✗
- Cap rate
- 5.93%
- Cash-on-cash
- -1.28%
- DSCR
- 0.94
- GRM
- 9.0
CMA / ARV
- ARV (on-the-fly)
- $275,264
- Comps found
- 1
Show comp detail 1 sale within ~0.75 mi
| Address | Dist | Beds/Ba | Sqft | Sold | Price | $/sf | Match |
|---|---|---|---|---|---|---|---|
| 11995 Shakerwood Ln | 0.14mi | 2/2.5 (-1) | 1,577 (+5%) | 18mo | $290,000 | $184 | 64 |
Match score weights: distance 35% · size 25% · config 20% · recency 20%. Top-matched comps best support the ARV.
Projected returns pro-forma
-3.0% appreciation · 2.31% rent growth · sell at horizon
- IRR
- -19.2%
- Equity multiple
- 0.33×
- Total profit
- $-62,623
- Equity at exit
- $49,950
- IRR
- -13.3%
- Equity multiple
- 0.25×
- Total profit
- $-70,646
- Equity at exit
- $28,965
Cash invested: $93,800 (down + closing). Projections, not guarantees.
Landlord ↔ Tenant lean methodology
- Overall (STATE)
- 87 Strongly Landlord-Friendly
- State Florida
- 87 Strongly Landlord-Friendly · R+3
- County
- — inherits STATE
- City
- — inherits STATE
ZIP-level market 33414
- Home prices YoY
- -30.2%
- Rents YoY
- 2.3%
- Active inventory
- 616
- Price-to-rent
- 9.0×
Monthly cashflow live
- Estimated rent
- $3,117 high interval (Pro) →
- Mortgage (P&I)
- −$1,757
- Tax from tax record
- −$506 /mo · $6,073/yr
- Insurance
- −$140
- HOA
- −$160
- Vacancy / Maint / Mgmt
- −$654
- Net cashflow
- $-100
Break-even live
UW: 25.0% down · 7.5% · 30yr · 1.5% tax · 5.0% vac · 8.0% maint · 8.0% mgmt
Financing live
Cash to close
- Down payment
- $83,750
- Closing costs
- $10,050
- Reserves months
- —
- Total cash needed
- —
Loan-product check · same deal, 3 products live
Conventional
25% down · 7.5% · 30yr
- Down + closing
- —
- Monthly P&I
- —
- Monthly cashflow
- —
- DSCR
- —
- Eligible?
- —
Personal DTI + credit; lowest rate.
DSCR
20% down · 8.5% · 30yr
- Down + closing
- —
- Monthly P&I
- —
- Monthly cashflow
- —
- DSCR
- —
- Eligible?
- —
No personal income docs; deal must DSCR.
Hard money
10% down · 12.0% · 12mo
- Down + closing
- —
- Monthly P&I
- —
- Monthly cashflow
- —
- DSCR
- —
- Eligible?
- —
Short-term bridge; refi at stabilization.
Rent comps 40 comps
| Address | Beds | Baths | Sqft | Rent | $/sqft | DOM | Units | Dist |
|---|---|---|---|---|---|---|---|---|
| 11862 Brier Patch Ct E Wellington, FL | 3.0 | 2.5 | 1320 | $3,500 | $2.65 | 24d | 1 | 0.04mi |
| 11830 Brier Patch Ct E Wellington, FL | 3.0 | 2.5 | 1496 | $2,750 | $1.84 | 24d | 1 | 0.04mi |
| 11883 Sturbridge Ln Unit 11883 Wellington, FL | 2.0 | 2.0 | 1000 | $2,300 | $2.30 | 24d | 1 | 0.09mi |
| 1569 Shaker Cir Wellington, FL | 2.0 | 2.5 | 1577 | $3,500 | $2.22 | 24d | 1 | 0.10mi |
| 11890 Sturbridge Ln Wellington, FL | 2.0 | 2.0 | 997 | $1,795 | $1.80 | 7d | 1 | 0.11mi |
| 11925 Suellen Cir Wellington, FL | 3.0 | 2.0 | 1695 | $2,700 | $1.59 | 21d | 1 | 0.13mi |
| 11937 Sturbridge Ln Wellington, FL | 3.0 | 2.0 | 1156 | $2,000 | $1.73 | 24d | 1 | 0.14mi |
| 1604 Shaker Cir Wellington, FL | 3.0 | 2.5 | 1622 | $2,800 | $1.73 | 24d | 1 | 0.15mi |
| 1520 Shaker Cir Wellington, FL | 3.0 | 2.5 | 1622 | $3,000 | $1.85 | 24d | 1 | 0.18mi |
| 1453 White Pine Dr Wellington, FL | 2.0 | 2.0 | 1492 | $2,900 | $1.94 | 7d | 1 | 0.21mi |
| 1437 White Pine Dr Wellington, FL | 2.0 | 2.0 | 1172 | $2,300 | $1.96 | 7d | 1 | 0.23mi |
| 1403 White Pine Dr Wellington, FL | 2.0 | 2.0 | 1444 | $2,400 | $1.66 | 7d | 1 | 0.26mi |
| 1382 Birkdale Dr Unit 1388 Wellington, FL | 2.0 | 2.0 | 980 | $2,400 | $2.45 | 14d | 1 | 0.28mi |
| 1348 The 12th Fairway Wellington, FL | 2.0 | 2.0 | 1444 | $2,800 | $1.94 | 24d | 1 | 0.28mi |
| 1456 Waterway Cove Dr Wellington, FL | 3.0 | 2.0 | 1585 | $3,650 | $2.30 | 24d | 1 | 0.29mi |
| 1352 Wyndcliff Dr Wellington, FL | 4.0 | 2.0 | 1740 | $5,000 | $2.87 | 24d | 1 | 0.30mi |
| 1665 Cabot Ln Unit A4 Wellington, FL | 2.0 | 2.0 | 1315 | $2,500 | $1.90 | 16d | 1 | 0.37mi |
| 1665 Cabot Ln Unit A3 Wellington, FL | 2.0 | 2.0 | 1315 | $2,500 | $1.90 | 24d | 1 | 0.37mi |
| 12244 Sag Harbor Ct #2 Wellington, FL | 3.0 | 2.5 | 1661 | $3,000 | $1.81 | 24d | 1 | 0.41mi |
| 11770 Saint Andrews Pl Wellington, FL | 2.0–3.0 | 2.0 | 1403 | $3,500 | $2.49 | 7d | 4 | 0.41mi |
| 11770 Saint Andrews Pl Wellington, FL | 2.0–3.0 | 2.0 | 1403 | $3,500 | $2.49 | 21d | 5 | 0.41mi |
| 11780 Saint Andrews Pl Wellington, FL | 2.0–3.0 | 2.0 | 1482 | $2,800 | $1.89 | 24d | 3 | 0.42mi |
| 11780 Saint Andrews Pl Wellington, FL | 2.0–3.0 | 2.0 | 1403 | $2,800 | $2.00 | 7d | 3 | 0.42mi |
| 11790 Saint Andrews Pl #302 Wellington, FL | 3.0 | 2.0 | 1479 | $2,780 | $1.88 | 4d | 1 | 0.43mi |
| 11750 Saint Andrews Pl Wellington, FL | 2.0–3.0 | 2.0 | 1351 | $2,700 | $2.00 | 24d | 2 | 0.44mi |
| 11750 Saint Andrews Pl Wellington, FL | 2.0–3.0 | 2.0 | 1351 | $2,700 | $2.00 | 24d | 2 | 0.44mi |
| 11790 Saint Andrews Pl Wellington, FL | 2.0–3.0 | 2.0 | 1405 | $2,950 | $2.10 | 16d | 3 | 0.44mi |
| 11790 Saint Andrews Pl Wellington, FL | 2.0–3.0 | 2.0 | 1405 | $2,780 | $1.98 | 3d | 2 | 0.44mi |
| 11771 Saint Andrews Pl #101 Wellington, FL | 2.0 | 2.5 | 1401 | $6,800 | $4.85 | 20d | 1 | 0.44mi |
| 11771 Saint Andrews Pl #104 Wellington, FL | 2.0 | 2.5 | 1401 | $2,700 | $1.93 | 3d | 1 | 0.44mi |
| 11775 Saint Andrews Pl #103 Wellington, FL | 2.0 | 2.5 | 1427 | $5,500 | $3.85 | 1d | 1 | 0.44mi |
| 11785 Saint Andrews Pl #106 Wellington, FL | 2.0 | 2.5 | 1401 | $3,000 | $2.14 | 18d | 1 | 0.45mi |
| 11789 Saint Andrews Pl #103 Wellington, FL | 2.0 | 2.5 | 1427 | $2,800 | $1.96 | 24d | 1 | 0.45mi |
| 12781 Peconic Ct Wellington, FL | 2.0 | 2.0 | 1005 | $1,950 | $1.94 | 2d | 1 | 0.46mi |
| 11740 Saint Andrews Pl Wellington, FL | 3.0 | 2.0 | 1556 | $5,350 | $3.44 | 7d | 2 | 0.47mi |
| 11740 St Andrews Pl Wellington, FL | 3.0 | 2.0 | 1479 | $5,500 | $3.72 | 24d | 1 | 0.47mi |
| 11730 Saint Andrews Pl #302 Wellington, FL | 3.0 | 2.0 | 1479 | $3,000 | $2.03 | 24d | 1 | 0.48mi |
| 12738 Peconic Ct Wellington, FL | 3.0 | 2.5 | 1428 | $2,800 | $1.96 | 16d | 1 | 0.49mi |
| 11720 Saint Andrews Pl Wellington, FL | 2.0–3.0 | 2.0 | 1405 | $6,000 | $4.27 | 19d | 2 | 0.49mi |
| 1379 Pinetta Cir Wellington, FL | 3.0 | 2.0 | 1452 | $3,350 | $2.31 | 24d | 1 | 0.49mi |
HOA detail
- Monthly dues
- $160 · $1,920/yr
Listing history 32 events
-
2026-05-07status Pending
-
2026-04-24historical Active Under Contract
-
2026-04-19$335,000 Active
-
2025-10-07historical
-
2025-07-28$355,000 Active
-
2025-07-22historical
-
2025-07-08historical $6,000
-
2025-06-02price $6,000
-
2025-05-20price $2,900
-
2025-05-01$3,000
-
2024-05-28historical $3,500
-
2024-04-27$3,500
-
2021-04-22soldstatus $255,000 Closed 437-char remark
Show marketing remark (437 chars)
Feel right at home in this two-story townhouse in the community of Brier Patch, which has twenty-eight colonial-style townhomes. This corner lot three bedrooms, two and a half bath home features a new roof, updated kitchen and bathrooms, a spacious living room, large screened-in cover patio, and much more. Located within walking distance to the Wellington Town Center and close to schools, hospitals, shopping centers, and restaurants.
-
2021-03-26status Pending 437-char remark
Show marketing remark (437 chars)
Feel right at home in this two-story townhouse in the community of Brier Patch, which has twenty-eight colonial-style townhomes. This corner lot three bedrooms, two and a half bath home features a new roof, updated kitchen and bathrooms, a spacious living room, large screened-in cover patio, and much more. Located within walking distance to the Wellington Town Center and close to schools, hospitals, shopping centers, and restaurants.
-
2021-03-24$234,999 Active 437-char remark
Show marketing remark (437 chars)
Feel right at home in this two-story townhouse in the community of Brier Patch, which has twenty-eight colonial-style townhomes. This corner lot three bedrooms, two and a half bath home features a new roof, updated kitchen and bathrooms, a spacious living room, large screened-in cover patio, and much more. Located within walking distance to the Wellington Town Center and close to schools, hospitals, shopping centers, and restaurants.
-
2012-09-13soldstatus $115,000
-
2012-08-28soldstatus $115,000
-
2012-07-11historical
-
2012-07-02$123,500
-
2011-07-03historical
-
2011-04-18$119,900
-
2011-01-04soldstatus $82,000
-
2010-12-28soldstatus $82,000
-
2010-12-15historical
-
2009-09-14historical
-
2009-09-14$94,000
-
2009-04-02$124,900
-
2003-07-07soldstatus $126,000
-
2001-10-18soldstatus $100,000
-
1996-01-04soldstatus $63,900
-
1995-02-08soldstatus $63,000
-
1993-10-18soldstatus $65,000
ⓘ Source: listings_history table (triggers on properties + properties_extension) + one-shot
backfill from property_details.listing_events for pre-trigger history.
Tax reassessment forecast FL · Resets to sale price
- Current annual tax
- $6,073 · $506/mo
- Projected year-2 tax
- $6,073 · $506/mo
- Expected delta
- $0/yr ($0/mo · 0.0%)
ⓘ Screening estimate from a state-policy table — verify with the county assessor before closing.
Climate risk First Street
- Flood 2/10 Low FEMA zone X (unshaded) · 7% chance over 30 yrs
- Wildfire 1/10 Low
- Heat 10/10 Extreme 7 d/yr ≥107°F today · 26 d/yr by 30 yrs out
- Wind 10/10 Extreme 99% chance of damaging wind over 30 yrs
- Air quality 2/10 Low 0 unhealthy d/yr today · 1 by 30 yrs out
Nearby sold comps map
Loading sold comps map…
Walkable amenities ~0.75 mi
Loading nearby amenities…
Taxation est. · year 1
- Rental income
- $37,399
- − Mortgage interest
- −$18,765
- − Property taxes
- −$6,073
- − Insurance
- −$1,675
- − Repairs & maintenance
- −$2,992
- − Management
- −$2,992
- − HOA
- −$1,920
- − Depreciation
- −$9,745
- Taxable loss
- −$6,763
- Est. tax savings @ 24.0%
- +$1,623
- After-tax cash flow
- $419/yr
For passive investors: Depreciation is non-cash, so a rental often shows a tax loss while cash-flowing — sheltering income. Rental losses are passive: they offset passive income freely, and up to $25,000/yr can offset ordinary (W-2) income if you actively participate and your MAGI is under $100k (phasing out to $0 by $150k); unused losses carry forward. On sale, claimed depreciation is recaptured at up to 25%, and gains may owe capital-gains tax (a 1031 exchange can defer both). Figures are a year-1 estimate at your 24.0% rate — not tax advice; consult a CPA.
Schools (NCES district)
- District
- Palm Beach
- NCES district ID
- 1201500
- Math proficiency
- 46% ▼ -16.00%
- Reading proficiency
- 53% ▼ -4.00%
- Median HH income
- $53,943
- Composite
- 42.72/100
- National rank
- #3160
- State rank
- #34 of 73 in FL
Livability — Wellington
- Score
- 73/100
- State rank
- #294
- US rank
- #4986
Category grades
Schools grade is shown separately in the Schools card above.
Census & demographics
- Census place
- Wellington, FL
- County
- Palm Beach County · 1,438,312 people
- City population
- 60,184
- Metro
- Miami-Fort Lauderdale-Pompano Beach, FL
- Population (ZIP)
- 60,184
- Household income
- $112,241
- Rent vs Own
- Severe rent burden
- 1566.0
Population outlook (Palm Beach County) Hauer SSP2
- Today (2025)
- 1,637,487 people
- By 2030
- 1,743,255 · +6.5%
- By 2040
- 1,948,712 · +19.0%
- By 2050
- 2,132,979 · +30.3%
- By 2075
- 2,530,027 · +54.5%
- By 2100
- 2,706,979 · +65.3%
Race, ethnicity, and origin ACS 2023
- Neighborhood character
- Diverse neighborhood (Simpson 0.67)
- Race & ethnicity
- White 47% Hispanic / Latino 29% Two or more races 20% Black 13% Asian 6%
- Hispanic origin (detail)
- Mexican 4% Puerto Rican 5% Cuban 6% Dominican 1% Salvadoran 1%
- Common ancestry
- Hispanic 4% Romanian 3% Lithuanian 2%
- Foreign-born
- 26% · Canada, Jamaica, China
- Languages at home
- 67% English-only · Spanish 23% French/Haitian/Cajun 3% Other Indo-European 3%
Political lean MEDSL · Palm Beach
- 2024 margin
- Toss-up / Even · D 50.0% · R 49.2%
- 2008→2024 swing
- -22.1pp toward R · 2008: 22.9pp · 2024: 0.8pp
- All cycles
- 2024: D+0.8 2020: D+12.8 2016: D+15.3 2012: D+17.0 2008: D+22.9
Not yet ingested
- Civics
- —
Market trends
- HPI YoY
- ▼ -152.58%
- Current HPI
- 352.9366
- Rent YoY
- ▲ 2.31%
- Metro
- Miami-Fort Lauderdale-Pompano Beach, FL
- State GDP YoY
- ▲ 3.28%
- F500 in state
- 36
Industry mix (Fortune 500 HQ in FL)
| Industry | F500 HQs | Revenue |
|---|---|---|
| Industrial Technology | 2 | $29B |
|
||
| Insurance | 2 | $17B |
|
||
| Retail | 1 | $60B |
|
||
| Technology Distribution | 1 | $58B |
|
||
| Homebuilding | 1 | $35B |
|
||
| Technology Manufacturing | 1 | $35B |
|
||
Price history
+415.4% since first listed32 events — show timeline
- 2026-05-07 Pending — Beaches MLS
- 2026-04-24 Contingent — Beaches MLS
- 2026-04-19 Listed $335,000 Beaches MLS
- 2025-10-07 Listing Removed — Beaches MLS
- 2025-07-28 Listed $355,000 Beaches MLS
- 2025-07-22 Coming Soon — Beaches MLS
- 2025-07-08 Rental Removed $6,000 GFLMLS
- 2025-06-02 Price Changed $6,000 GFLMLS
- 2025-05-20 Price Changed $2,900 GFLMLS
- 2025-05-01 Listed for Rent $3,000 GFLMLS
- 2024-05-28 Rental Removed $3,500 RENT.
- 2024-04-27 Listed for Rent $3,500 RENT.
- 2021-04-22 Sold (MLS) $255,000 MARMLS
- 2021-03-26 Pending — MARMLS
- 2021-03-24 Listed $234,999 MARMLS
- 2012-09-13 Sold (Public Records) $115,000 Public Records
- 2012-08-28 Sold (MLS) $115,000 Beaches MLS
- 2012-07-11 Listing Removed — Beaches MLS
- 2012-07-02 Listed $123,500 Beaches MLS
- 2011-07-03 Listing Removed — Beaches MLS
- 2011-04-18 Listed $119,900 Beaches MLS
- 2011-01-04 Sold (Public Records) $82,000 Public Records
- 2010-12-28 Sold (MLS) $82,000 Beaches MLS
- 2010-12-15 Listing Removed — Beaches MLS
- 2009-09-14 Listed $94,000 Beaches MLS
- 2009-09-14 Listing Removed — Beaches MLS
- 2009-04-02 Listed $124,900 Beaches MLS
- 2003-07-07 Sold (Public Records) $126,000 Public Records
- 2001-10-18 Sold (Public Records) $100,000 Public Records
- 1996-01-04 Sold (Public Records) $63,900 Public Records
- 1995-02-08 Sold (Public Records) $63,000 Public Records
- 1993-10-18 Sold (Public Records) $65,000 Public Records
Property tax history
+7.3%/yrLatest (2025): $6,073 · +4.3% YoY. Source: county tax records.
Cash-flow waterfall
monthlySold comps — $/sqft
last 12 mo · ≤1 miLoading sold comps…