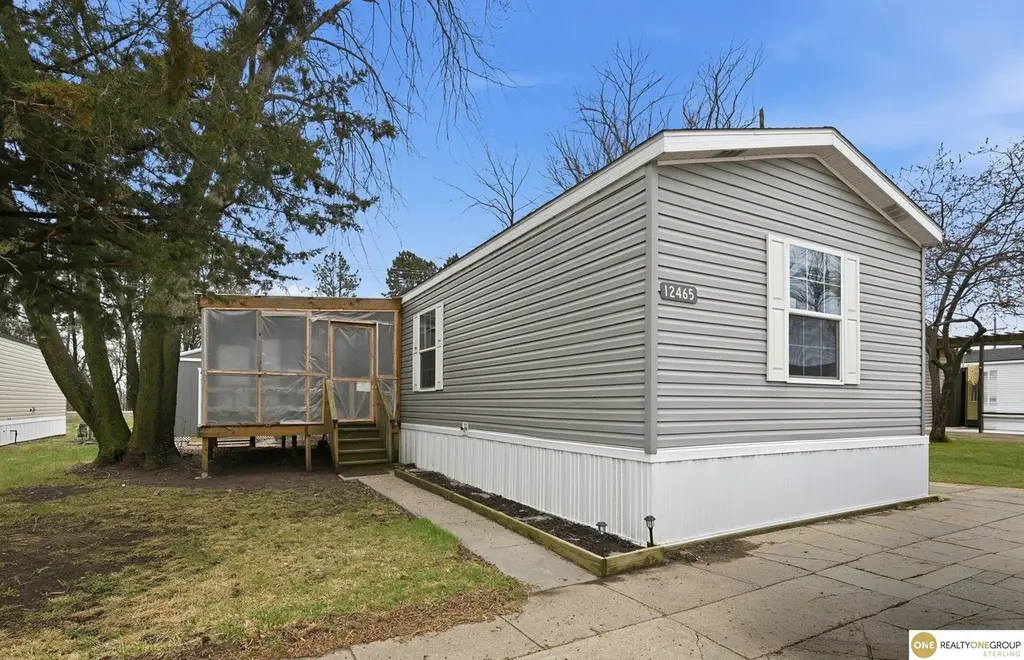
12465 Ann Dr · Blair, NE
Flood risk No data
- FEMA flood zone
- —
- Chance of flooding over 30 yrs
- —
- Est. flood insurance / yr
- —
Fire risk No data
- Est. fire insurance / yr
- —
Heat risk 3/10 · Minor
- Hot days now (above threshold)
- 7 days/yr
- Hot days in 30 yrs
- 15 days/yr
Wind risk No data
- Chance of severe wind over 30 yrs
- —
Air-quality risk 1/10 · Minimal
- Unhealthy air days now
- 0 days/yr
- Unhealthy air days in 30 yrs
- 0 days/yr
Risk factors via First Street. Map © Google.
Why this score? — see what drove the C- grade
The composite is a weighted blend of 9 inputs, each scored 0–100. Each bar is that input's sub-score; the figure is the points it added to the 100-point composite (weight × sub-score).
- Cash flow +17.2/30.0
- 1% rule +10.0/10.0
- DSCR +5.4/10.0
- ARV discount +5.1/15.0
- Schools +4.6/10.0
- Livability +4.0/5.0
- Rent growth +2.5/5.0
- Condition / age +2.5/5.0
- Appreciation +0.0/10.0
$89,000
🖨 Deal sheet 📄 Offer letter ✓ Due diligence
Listing remarks
This home checks all of your boxes! 3 bedroom, 2 bathroom, including a primary suite with it's own private bathroom and walk in closet, kitchen cabinets galore and an open floor plan. All of the appliances stay with the home, making this one move in ready! Are you ready to enjoy spring and summer evenings outside? You won't find another one with a large screened-in porch that is just waiting for you to soak up the fresh air while keeping the bugs at bay. The screened-in porch offers two entry doors for easy access to the large shed—complete with a lawn mower that stays.
Key facts
- Open floor plan
- Private bathroom
- Walk in closet
Tags
Neighborhood map
What this means for you Summary
Snapshot
- This is a 3-bed/2.0-bath manufactured listed at $89k.
Deal economics
- At list price, monthly cash flow is $64 ($772/yr) — positive.
- The deal already cash-flows at list — no discount required.
- Meets the 1% rule at list price ($1k rent vs $89k).
- Recommended offer: $88k (1.5% below list) — sets the bar for market timing.
- Cap rate 7.2% vs local median 2.2% in Blair — top-decile yield for the area; either an underpriced asset or a hidden risk that comps aren't pricing in. Stress-test before assuming the spread holds.
Location & tenants
- Location reads 80/100 on livability (#25 in NE, #1,668 nationally) — a professional / high-income tenant draw. Strengths: crime A+, cost of living A+, housing A+; Watch: amenities F, commute F.
- Blair Community Schools (town): math 55% / reading 51% proficiency, ranked #46 of 111 in NE (top 41%) — acceptable for families but not a draw, mixed tenant base, ~2y average lease; only 18% free/reduced lunch — higher-income household profile.
- Zoned schools: Blair North Elementary School (172 students, 36% FRL); Gerald Otte Blair Middle Sch (math 62% / reading 55%, grade B, #21 of 128 statewide, top 17%, 506 students, 26% FRL); Blair High School (math 47% / reading 52%, grade D, #107 of 261 statewide, top 52%, 710 students, 21% FRL).
- Market conditions: 186 active listings in the ZIP; 80 units permitted in Washington County in 2024 (0 in 5+ unit buildings).
Forward outlook
- Local home prices are declining (-3.0%/yr); year-one equity from $615 of loan paydown is wiped out by about $3k of value loss. Plan a longer hold.
- Washington County population projected to shrink 6% by 2050 — rents likely to lag national; underwrite the cash flow, not the appreciation.
Negotiation context
- It's been on market 20 days — a 2% lower offer ($88k) is reasonable based on typical stale-listing flexibility.
- 2 sale attempts; this cycle's ask has dropped $5k (5%) from the opening price — seller is motivated, your offer sets the floor, not the list.
Risks & watch-outs
- Watch-outs: HOA is 36% of rent.
Questions for the listing agent
- What does the HOA fee cover, when was the last increase, and are there any pending special assessments or reserve-fund shortfalls?
- Is there a deadline driving the sale (1031 exchange, divorce, estate, relocation)? That informs how much negotiation room exists.
- Schools are A-rated — typically a magnet for longer-tenancy family renters. What's the average tenant stay here, and is there a school-zone premium baked into asking?
- What's the average days-on-market for RENTAL listings here right now (not sales)? A rising rental-DOM trend means longer vacancies and softer asking-rent achievability than the comps imply.
- What's the recent tenant-quality profile in this submarket — average credit score on applications, eviction rate, late-payment / NSF rate, and stable-employment percentage? A property-management company in the area should have these aggregated.
- How much new for-sale + rental construction is in the pipeline within 1–3 miles? Heavy new supply typically softens prices + rents 12–24 months out; constrained supply supports both.
Investment metrics
- 1% rule
- 1.60% ✓
- Cap rate
- 7.16%
- Cash-on-cash
- 3.10%
- DSCR
- 1.14
- GRM
- 5.2
CMA / ARV
- ARV (on-the-fly)
- $84,480
- Comps found
- 4
Show comp detail 4 sales within ~0.75 mi
| Address | Dist | Beds/Ba | Sqft | Sold | Price | $/sf | Match |
|---|---|---|---|---|---|---|---|
| 12465 Ann Dr | 0.00mi | 3/2.0 | 1,160 (-9%) | 1mo | $78,000 | $67 | 84 |
| 12460 Ann Dr #39 | 0.03mi | 3/2.0 | 1,216 (-5%) | 10mo | $75,000 | $62 | 82 |
| 12351 Earl Ave | 0.17mi | 3/2.0 | 1,216 (-5%) | 14mo | $75,000 | $62 | 72 |
| 8550 Thompson Dr #68 | 0.17mi | 3/2.0 | 1,440 (+12%) | 14mo | $95,000 | $66 | 60 |
Match score weights: distance 35% · size 25% · config 20% · recency 20%. Top-matched comps best support the ARV.
Projected returns pro-forma
-3.0% appreciation · 3.0% rent growth · sell at horizon
- IRR
- -11.0%
- Equity multiple
- 0.60×
- Total profit
- $-10,032
- Equity at exit
- $13,270
- IRR
- -1.3%
- Equity multiple
- 0.91×
- Total profit
- $-2,269
- Equity at exit
- $7,695
Cash invested: $24,920 (down + closing). Projections, not guarantees.
Landlord ↔ Tenant lean methodology
- Overall (STATE)
- 83 Strongly Landlord-Friendly
- State Nebraska
- 83 Strongly Landlord-Friendly · R+13
- County
- — inherits STATE
- City
- — inherits STATE
ZIP-level market 68008
- Active inventory
- 186
- Price-to-rent
- 5.2×
Monthly cashflow live
- Estimated rent
- $1,420 medium interval (Pro) →
- Mortgage (P&I)
- −$467
- Tax from tax record
- −$48 /mo · $582/yr
- Insurance
- −$37
- HOA
- −$505
- Vacancy / Maint / Mgmt
- −$298
- Net cashflow
- $64
Break-even live
UW: 25.0% down · 7.5% · 30yr · 1.5% tax · 5.0% vac · 8.0% maint · 8.0% mgmt
Financing live
Cash to close
- Down payment
- $22,250
- Closing costs
- $2,670
- Reserves months
- —
- Total cash needed
- —
Loan-product check · same deal, 3 products live
Conventional
25% down · 7.5% · 30yr
- Down + closing
- —
- Monthly P&I
- —
- Monthly cashflow
- —
- DSCR
- —
- Eligible?
- —
Personal DTI + credit; lowest rate.
DSCR
20% down · 8.5% · 30yr
- Down + closing
- —
- Monthly P&I
- —
- Monthly cashflow
- —
- DSCR
- —
- Eligible?
- —
No personal income docs; deal must DSCR.
Hard money
10% down · 12.0% · 12mo
- Down + closing
- —
- Monthly P&I
- —
- Monthly cashflow
- —
- DSCR
- —
- Eligible?
- —
Short-term bridge; refi at stabilization.
HOA detail
- Monthly dues
- $505 · $6,060/yr
Listing history 6 events
-
2026-04-23status Pending
-
2026-04-15price $89,000
-
2026-04-02historical
-
2026-04-01$94,000 New
-
2026-03-28price $94,000
-
2026-01-01$99,000 New
ⓘ Source: listings_history table (triggers on properties + properties_extension) + one-shot
backfill from property_details.listing_events for pre-trigger history.
Tax reassessment forecast NE · Resets to sale price
- Current annual tax
- $582 · $48/mo
- Projected year-2 tax
- $1,540 · $128/mo
- Expected delta
- +$958/yr (+$80/mo · 164.6%)
ⓘ Screening estimate from a state-policy table — verify with the county assessor before closing.
Climate risk First Street
- Heat 3/10 Moderate
- Air quality 1/10 Low 0 unhealthy d/yr today · 0 by 30 yrs out
Nearby sold comps map
Loading sold comps map…
Walkable amenities ~0.75 mi
Loading nearby amenities…
Taxation est. · year 1
- Rental income
- $17,037
- − Mortgage interest
- −$4,985
- − Property taxes
- −$582
- − Insurance
- −$445
- − Repairs & maintenance
- −$1,363
- − Management
- −$1,363
- − HOA
- −$6,060
- − Depreciation
- −$2,589
- Taxable loss
- −$350
- Est. tax savings @ 24.0%
- +$84
- After-tax cash flow
- $856/yr
For passive investors: Depreciation is non-cash, so a rental often shows a tax loss while cash-flowing — sheltering income. Rental losses are passive: they offset passive income freely, and up to $25,000/yr can offset ordinary (W-2) income if you actively participate and your MAGI is under $100k (phasing out to $0 by $150k); unused losses carry forward. On sale, claimed depreciation is recaptured at up to 25%, and gains may owe capital-gains tax (a 1031 exchange can defer both). Figures are a year-1 estimate at your 24.0% rate — not tax advice; consult a CPA.
Schools (NCES district)
- District
- Blair Community Schools
- NCES district ID
- 3104100
- Math proficiency
- 55% ▼ -5.00%
- Reading proficiency
- 51% ▼ -9.00%
- Median HH income
- $62,205
- Composite
- 46.47/100
- National rank
- #2439
- State rank
- #46 of 111 in NE
Livability — Blair
- Score
- 80/100
- State rank
- #25
- US rank
- #1668
Category grades
Schools grade is shown separately in the Schools card above.
Census & demographics
- Population (ZIP)
- 12,906
Population outlook (Washington County) Hauer SSP2
- Today (2025)
- 20,361 people
- By 2030
- 20,293 · -0.3%
- By 2040
- 19,861 · -2.5%
- By 2050
- 19,080 · -6.3%
- By 2075
- 17,987 · -11.7%
- By 2100
- 16,240 · -20.2%
Race, ethnicity, and origin ACS 2023
- Neighborhood character
- Predominantly White (95%)
- Race & ethnicity
- White 95% Two or more races 3% Hispanic / Latino 2%
- Common ancestry
- Portuguese 6% Romanian 4% Lithuanian 2%
- Foreign-born
- 1%
- Languages at home
- 98% English-only · Spanish 1%
Political lean MEDSL · Washington
- 2024 margin
- Solid R (+42.4) · D 28.2% · R 70.6% · Other 1.2%
- 2008→2024 swing
- -16.1pp toward R · 2008: -26.3pp · 2024: -42.4pp
- All cycles
- 2024: R+42.4 2020: R+40.3 2016: R+45.0 2012: R+37.1 2008: R+26.3
Not yet ingested
- Civics
- —
Market trends
- HPI YoY
- ▼ -135.43%
- Current HPI
- 207.5425
- Rent YoY
- —
- Metro
- —
- State GDP YoY
- ▲ 0.68%
- F500 in state
- 2
Industry mix (Fortune 500 HQ in NE)
| Industry | F500 HQs | Revenue |
|---|---|---|
| Conglomerate | 1 | $371B |
|
||
Price history
-10.1% since first listed6 events — show timeline
- 2026-04-23 Pending — GPRMLS
- 2026-04-15 Price Changed $89,000 GPRMLS
- 2026-04-02 Listing Removed — GPRMLS
- 2026-04-01 Listed $94,000 GPRMLS
- 2026-03-28 Price Changed $94,000 GPRMLS
- 2026-01-01 Listed $99,000 GPRMLS
Property tax history
+4.7%/yrLatest (2025): $582 · +9.4% YoY. Source: county tax records.
Cash-flow waterfall
monthlySold comps — $/sqft
last 12 mo · ≤1 miLoading sold comps…