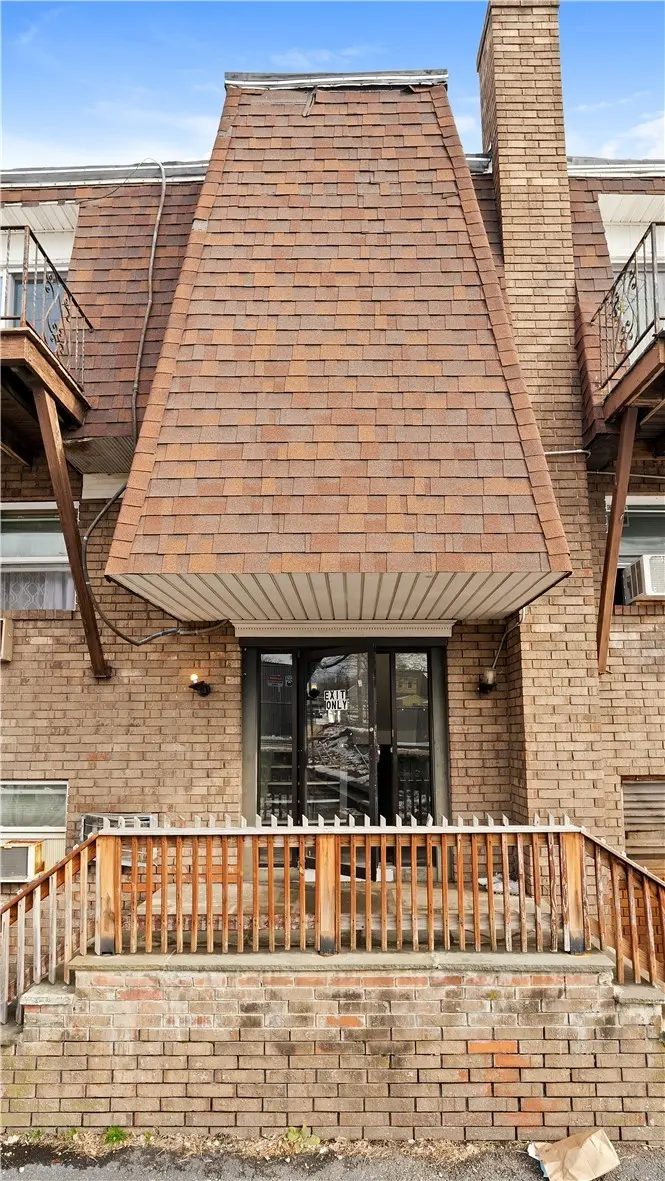
27 Gillen Ave Unit 207B · Pawtucket, RI
Flood risk 9/10 · Severe
- FEMA flood zone
- X (unshaded)
- Chance of flooding over 30 yrs
- 0.98%
- Est. flood insurance / yr
- $507 – $1,088
Fire risk 1/10 · Minimal
- Est. fire insurance / yr
- $835 – $1,551
Heat risk 5/10 · Moderate
- Hot days now (above 96°F)
- 7 days/yr
- Hot days in 30 yrs
- 15 days/yr
Wind risk 6/10 · Moderate
- Chance of severe wind over 30 yrs
- 70.0%
Air-quality risk 2/10 · Minimal
- Unhealthy air days now
- 1 days/yr
- Unhealthy air days in 30 yrs
- 2 days/yr
Risk factors via First Street. Map © Google.
Why this score? — see what drove the D grade
The composite is a weighted blend of 9 inputs, each scored 0–100. Each bar is that input's sub-score; the figure is the points it added to the 100-point composite (weight × sub-score).
- Cash flow +13.4/30.0
- ARV discount +7.5/15.0
- 1% rule +5.4/10.0
- Rent growth +4.2/5.0
- DSCR +4.0/10.0
- Livability +3.6/5.0
- Schools +2.5/10.0
- Condition / age +2.5/5.0
- Appreciation +0.0/10.0
$185,000
🖨 Deal sheet 📄 Offer letter ✓ Due diligence
Listing remarks MLS
Welcome to this spacious 2 bed 1 bath condo. This one level unit needs very little to make it perfect. Heat / Hot Water / Sewer & Water are included in the monthly condo fee. The condo has a very functional open floor plan and 2 large bedrooms. Very convenient location close to all amenities and major highways.
Key facts
- Bright open layout
- In building laundry
- Unassigned parking
Tags
Neighborhood map
What this means for you Summary
Snapshot
- This is a 2-bed/1.0-bath condo listed at $185k.
Deal economics
- At list price, monthly cash flow is $-62 ($-749/yr) — negative.
- To cash-flow at today's rent, offer at most $174k (6.0% below list).
- Meets the 1% rule at list price ($2k rent vs $185k).
- Recommended offer: $174k (6.0% below list) — sets the bar for cash-flow.
- Cap rate 6.3% vs local median 3.8% in Pawtucket — top-decile yield for the area; either an underpriced asset or a hidden risk that comps aren't pricing in. Stress-test before assuming the spread holds.
Location & tenants
- Location reads 71/100 on livability (#16 in RI) — a middle-class / working-renter tenant base. Strengths: housing A+, health & safety A+, cost of living B+; Watch: employment C-, schools D, amenities F.
- North Providence (suburban): math 20% / reading 37% proficiency, ranked #22 of 39 in RI (top 56%) — low school quality limits family demand, transient renter base, plan for 1-2y turnover.
- Market conditions: Rents rising fast (+6.9%/yr); 151 active listings in the ZIP; 5 comparable units currently listed for rent nearby; rentals leasing fast (median 3d on market — plan ~1-2 weeks tenant-placement turnaround); 40% of comp listings sitting > 30 days — soft ceiling on asking rent; 776 units permitted in Providence County in 2024 (229 in 5+ unit buildings).
- This rent runs 34% of the median local income ($67k/yr) — at the standard rent-burdened threshold; future hikes will face affordability resistance.
Forward outlook
- Local home prices are declining (-3.0%/yr); year-one equity from $1k of loan paydown is wiped out by about $6k of value loss. Plan a longer hold.
- Providence County population projected at +5% by 2050 — modest demand growth; plan on rents tracking national, not racing it.
Negotiation context
- It's been on market 18 days — a 2% lower offer ($182k) is reasonable based on typical stale-listing flexibility.
- 8 sale attempts since 29y ago with the ask held roughly flat each time — persistent listings suggest the price (not the market) is what's stuck; bring a comps-based counter.
- Current owner paid $130k; 42% above their basis — modest negotiation headroom, anchor on the comps not their cost.
Risks & watch-outs
- Watch-outs: flood insurance adds $66/mo.
- Climate carrying-cost: severe flood risk; major wind risk, 70% chance of damaging wind over 30y; extreme-heat days projected 7→15/yr by 2055 (HVAC capex compounding) — expect insurance premiums to compound above CPI over the hold.
Questions for the listing agent
- What do current leases actually rent for vs. the listed asking? Can we see a recent rent roll and the last 12 months of T-12 income?
- What's the actual annual flood-insurance premium (NFIP or private), and is the property in a SFHA with mandatory coverage?
- What does the HOA fee cover, when was the last increase, and are there any pending special assessments or reserve-fund shortfalls?
- Any open or pending special assessments — roof, HVAC, plumbing, elevator, façade? What's the per-unit balance and payoff schedule, and is the seller paying it off at close or rolling it to the buyer?
- Is there a deadline driving the sale (1031 exchange, divorce, estate, relocation)? That informs how much negotiation room exists.
- Schools are D-rated, which usually means shorter tenancies and higher turnover. Who's the typical renter profile here, and what's been the actual vacancy rate?
- The area grade is low — what's the realistic commute time and amenity access for the typical tenant pool here? Any planned neighborhood developments (good or bad) we should know about?
- What's the average days-on-market for RENTAL listings here right now (not sales)? A rising rental-DOM trend means longer vacancies and softer asking-rent achievability than the comps imply.
- What's the recent tenant-quality profile in this submarket — average credit score on applications, eviction rate, late-payment / NSF rate, and stable-employment percentage? A property-management company in the area should have these aggregated.
- How much new apartment / multifamily construction is in the pipeline within 1–3 miles? Heavy new supply (>2% of stock underway) typically softens rents 12–24 months out; light construction supports rent growth.
Investment metrics
- 1% rule
- 1.04% ✓
- Cap rate
- 6.32%
- Cash-on-cash
- 0.09%
- DSCR
- 1.00
- GRM
- 8.0
CMA / ARV
No comps found within radius.
Projected returns pro-forma
-3.0% appreciation · 6.88% rent growth · sell at horizon
- IRR
- -13.3%
- Equity multiple
- 0.50×
- Total profit
- $-25,955
- Equity at exit
- $27,584
- IRR
- 1.7%
- Equity multiple
- 1.15×
- Total profit
- $7,752
- Equity at exit
- $15,995
Cash invested: $51,800 (down + closing). Projections, not guarantees.
Landlord ↔ Tenant lean methodology
- Overall (STATE)
- 31 Tenant-Leaning
- State Rhode Island
- 31 Tenant-Leaning · D+8
- County
- — inherits STATE
- City
- — inherits STATE
ZIP-level market 02904
- Rents YoY
- 6.9%
- Active inventory
- 151
- Price-to-rent
- 8.0×
Monthly cashflow live
- Estimated rent
- $1,919 high interval (Pro) →
- Mortgage (P&I)
- −$970
- Tax from tax record
- −$111 /mo · $1,331/yr
- Insurance
- −$77
- Flood insurance flood zone
- −$66 /mo · $798/yr
- HOA
- −$354
- Vacancy / Maint / Mgmt
- −$403
- Net cashflow
- $-62
Break-even live
UW: 25.0% down · 7.5% · 30yr · 1.5% tax · 5.0% vac · 8.0% maint · 8.0% mgmt
Financing live
Cash to close
- Down payment
- $46,250
- Closing costs
- $5,550
- Reserves months
- —
- Total cash needed
- —
Loan-product check · same deal, 3 products live
Conventional
25% down · 7.5% · 30yr
- Down + closing
- —
- Monthly P&I
- —
- Monthly cashflow
- —
- DSCR
- —
- Eligible?
- —
Personal DTI + credit; lowest rate.
DSCR
20% down · 8.5% · 30yr
- Down + closing
- —
- Monthly P&I
- —
- Monthly cashflow
- —
- DSCR
- —
- Eligible?
- —
No personal income docs; deal must DSCR.
Hard money
10% down · 12.0% · 12mo
- Down + closing
- —
- Monthly P&I
- —
- Monthly cashflow
- —
- DSCR
- —
- Eligible?
- —
Short-term bridge; refi at stabilization.
Rent comps 5 comps
| Address | Beds | Baths | Sqft | Rent | $/sqft | DOM | Units | Dist |
|---|---|---|---|---|---|---|---|---|
| 866 Weeden St Pawtucket, RI | 2.0 | 1.0 | 725 | $1,800 | $2.48 | 43d | 1 | 0.70mi |
| 10 Josephine St North Providence, RI | 2.0 | 1.0 | 712 | $1,975 | $2.77 | 3d | 2 | 0.72mi |
| 10 Josephine St North Providence, RI | 2.0 | 1.0 | 712 | $1,900 | $2.67 | 43d | 2 | 0.72mi |
| 10 Josephine St #310 North Providence, RI | 2.0 | 1.0 | 712 | $2,000 | $2.81 | 2d | 1 | 0.72mi |
| 396 Weeden St Pawtucket, RI | 1.0–2.0 | 1.0 | 700 | $2,195 | $3.14 | 3d | 4 | 1.36mi |
HOA detail condo
- Monthly dues
- $354 · $4,248/yr
- Likely covers
- watersewer
- Assessments
- None detected in remarks — confirm with the listing agent.
Listing history 21 events
-
2026-04-06status Pending
-
2026-03-19$185,000 Active
-
2026-03-05historical
-
2026-01-29$190,000 Active
-
2024-06-28soldstatus $130,000 Closed 318-char remark
Show marketing remark (318 chars)
Welcome to this spacious 2 bed 1 bath condo. This one level unit needs very little to make it perfect. Heat / Hot Water / Sewer & Water are included in the monthly condo fee. The condo has a very functional open floor plan and 2 large bedrooms. Very convenient location close to all amenities and major highways.
-
2024-06-27soldstatus $410,000
-
2024-06-05status Pending 318-char remark
Show marketing remark (318 chars)
Welcome to this spacious 2 bed 1 bath condo. This one level unit needs very little to make it perfect. Heat / Hot Water / Sewer & Water are included in the monthly condo fee. The condo has a very functional open floor plan and 2 large bedrooms. Very convenient location close to all amenities and major highways.
-
2024-05-29$134,900 Active 318-char remark
Show marketing remark (318 chars)
Welcome to this spacious 2 bed 1 bath condo. This one level unit needs very little to make it perfect. Heat / Hot Water / Sewer & Water are included in the monthly condo fee. The condo has a very functional open floor plan and 2 large bedrooms. Very convenient location close to all amenities and major highways.
-
2024-05-29historical
Show marketing remark (318 chars)
Welcome to this spacious 2 bed 1 bath condo. This one level unit needs very little to make it perfect. Heat / Hot Water / Sewer & Water are included in the monthly condo fee. The condo has a very functional open floor plan and 2 large bedrooms. Very convenient location close to all amenities and major highways.
-
2024-05-20historical Active Under Contract
-
2024-05-06price $144,900
-
2024-05-06$149,900 Active
-
2024-05-06historical
-
2024-04-09$149,900 Active
-
2005-05-29historical
-
2005-05-09$89,900
-
2005-04-26historical
-
2005-03-21$84,900
-
1998-05-26soldstatus $23,000
-
1998-05-15historical
-
1997-11-04$24,900
ⓘ Source: listings_history table (triggers on properties + properties_extension) + one-shot
backfill from property_details.listing_events for pre-trigger history.
Tax reassessment forecast RI · Partial reset (capped growth)
- Current annual tax
- $1,331 · $111/mo
- Projected year-2 tax
- $2,173 · $181/mo
- Expected delta
- +$842/yr (+$70/mo · 63.3%)
ⓘ Screening estimate from a state-policy table — verify with the county assessor before closing.
Climate risk First Street
- Flood 9/10 Extreme FEMA zone X (unshaded) · 98% chance over 30 yrs
- Wildfire 1/10 Low
- Heat 5/10 Major 7 d/yr ≥96°F today · 15 d/yr by 30 yrs out
- Wind 6/10 Major 70% chance of damaging wind over 30 yrs
- Air quality 2/10 Low 1 unhealthy d/yr today · 2 by 30 yrs out
Nearby sold comps map
Loading sold comps map…
Walkable amenities ~0.75 mi
Loading nearby amenities…
Taxation est. · year 1
- Rental income
- $23,031
- − Mortgage interest
- −$10,363
- − Property taxes
- −$1,331
- − Insurance
- −$1,722
- − Repairs & maintenance
- −$1,842
- − Management
- −$1,842
- − HOA
- −$4,248
- − Depreciation
- −$5,382
- Taxable loss
- −$3,700
- Est. tax savings @ 24.0%
- +$888
- After-tax cash flow
- $139/yr
For passive investors: Depreciation is non-cash, so a rental often shows a tax loss while cash-flowing — sheltering income. Rental losses are passive: they offset passive income freely, and up to $25,000/yr can offset ordinary (W-2) income if you actively participate and your MAGI is under $100k (phasing out to $0 by $150k); unused losses carry forward. On sale, claimed depreciation is recaptured at up to 25%, and gains may owe capital-gains tax (a 1031 exchange can defer both). Figures are a year-1 estimate at your 24.0% rate — not tax advice; consult a CPA.
Schools (NCES district)
- District
- North Providence
- NCES district ID
- 4400780
- Math proficiency
- 20% ▼ -7.00%
- Reading proficiency
- 37% ▼ -6.00%
- Median HH income
- $50,962
- Composite
- 24.99/100
- National rank
- #7560
- State rank
- #22 of 39 in RI
Livability — Pawtucket
- Score
- 71/100
- State rank
- #16
- US rank
- #7037
Category grades
Schools grade is shown separately in the Schools card above.
Census & demographics
- County
- Providence County · 548,917 people
- City population
- 75,942
- Metro
- Providence-Warwick, RI-MA
- Population (ZIP)
- 32,531
- Household income
- $67,003
- Rent vs Own
- Severe rent burden
- 1176.0
Population outlook (Providence County) Hauer SSP2
- Today (2025)
- 653,469 people
- By 2030
- 660,819 · +1.1%
- By 2040
- 672,747 · +3.0%
- By 2050
- 683,741 · +4.6%
- By 2075
- 720,435 · +10.2%
- By 2100
- 741,582 · +13.5%
Race, ethnicity, and origin ACS 2023
- Neighborhood character
- Diverse neighborhood (Simpson 0.66)
- Race & ethnicity
- White 51% Hispanic / Latino 27% Two or more races 16% Black 8% Asian 5%
- Hispanic origin (detail)
- Mexican 2% Puerto Rican 6% Dominican 7%
- Common ancestry
- Lithuanian 7% Russian 6% Romanian 2%
- Foreign-born
- 18% · Canada, Jamaica, China
- Languages at home
- 64% English-only · Spanish 20% Other Indo-European 5% Other Asian/Pacific 3%
Political lean MEDSL · Providence
- 2024 margin
- D (+14.4) · D 56.1% · R 41.7% · Other 2.2%
- 2008→2024 swing
- -20.0pp toward R · 2008: 34.4pp · 2024: 14.4pp
- All cycles
- 2024: D+14.4 2020: D+22.9 2016: D+21.2 2012: D+34.9 2008: D+34.4
Not yet ingested
- Civics
- —
Market trends
- HPI YoY
- ▼ -379.06%
- Current HPI
- 363.1386
- Rent YoY
- ▲ 6.88%
- Metro
- Providence-Warwick, RI-MA
- State GDP YoY
- ▲ 2.25%
- F500 in state
- 10
Industry mix (Fortune 500 HQ in RI)
| Industry | F500 HQs | Revenue |
|---|---|---|
| Healthcare | 1 | $373B |
|
||
| Food Distribution | 1 | $31B |
|
||
| Aerospace / Defense | 1 | $14B |
|
||
| Financial Services | 1 | $8B |
|
||
| Consumer Goods | 1 | $4B |
|
||
Price history
+643.0% since first listed21 events — show timeline
- 2026-04-06 Pending — RIS
- 2026-03-19 Listed $185,000 RIS
- 2026-03-05 Listing Removed — RIS
- 2026-01-29 Listed $190,000 RIS
- 2024-06-28 Sold (MLS) $130,000 RIS
- 2024-06-27 Sold (Public Records) $410,000 Public Records
- 2024-06-05 Pending — RIS
- 2024-05-29 Listing Removed — RIS
- 2024-05-29 Listed $134,900 RIS
- 2024-05-20 Contingent — RIS
- 2024-05-06 Price Changed $144,900 RIS
- 2024-05-06 Listing Removed — RIS
- 2024-05-06 Listed $149,900 RIS
- 2024-04-09 Listed $149,900 RIS
- 2005-05-29 Listing Removed — RIS
- 2005-05-09 Listed $89,900 RIS
- 2005-04-26 Listing Removed — RIS
- 2005-03-21 Listed $84,900 RIS
- 1998-05-26 Sold (MLS) $23,000 RIS
- 1998-05-15 Listing Removed — RIS
- 1997-11-04 Listed $24,900 RIS
Property tax history
+1.1%/yrLatest (2025): $1,331 · +5.9% YoY. Source: county tax records.
Cash-flow waterfall
monthlySold comps — $/sqft
last 12 mo · ≤1 miLoading sold comps…