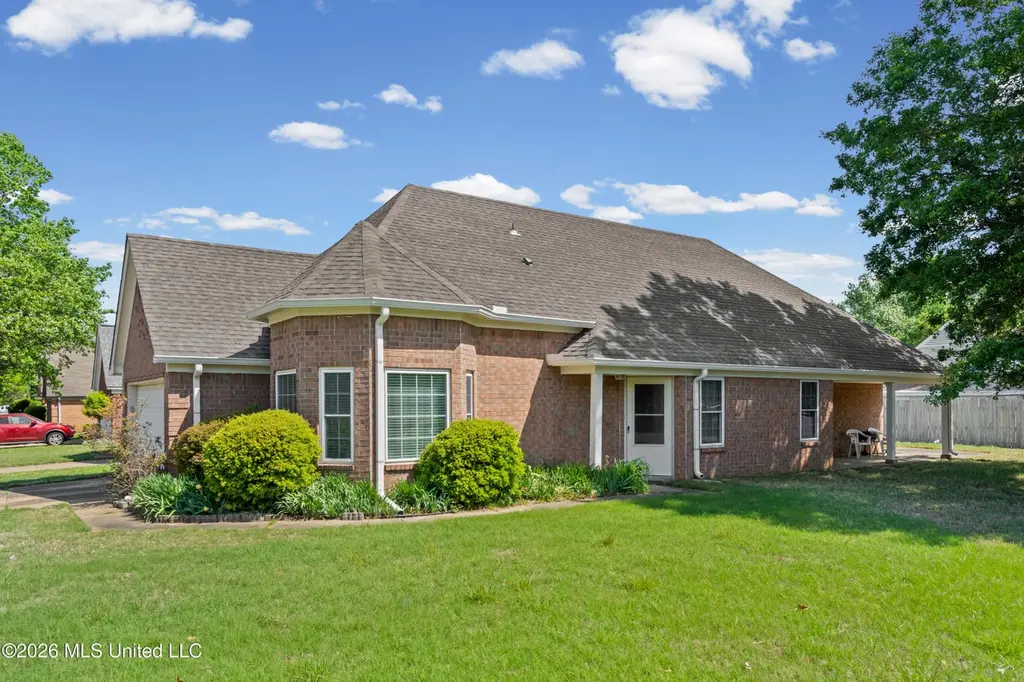
5788 Alexandria Ln · Southaven, MS
Flood risk 1/10 · Minimal
- FEMA flood zone
- X (unshaded)
- Chance of flooding over 30 yrs
- 0.0%
- Est. flood insurance / yr
- $507 – $1,088
Fire risk 4/10 · Minor
- Est. fire insurance / yr
- $1,241 – $2,305
Heat risk 7/10 · Major
- Hot days now (above 109°F)
- 7 days/yr
- Hot days in 30 yrs
- 22 days/yr
Wind risk 4/10 · Minor
- Chance of severe wind over 30 yrs
- 20.0%
Air-quality risk 2/10 · Minimal
- Unhealthy air days now
- 2 days/yr
- Unhealthy air days in 30 yrs
- 2 days/yr
Risk factors via First Street. Map © Google.
Why this score? — see what drove the D- grade
The composite is a weighted blend of 9 inputs, each scored 0–100. Each bar is that input's sub-score; the figure is the points it added to the 100-point composite (weight × sub-score).
- Cash flow +14.1/30.0
- ARV discount +5.5/15.0
- DSCR +4.3/10.0
- Schools +4.0/10.0
- Rent growth +3.3/5.0
- Livability +3.2/5.0
- 1% rule +3.0/10.0
- Condition / age +2.5/5.0
- Appreciation +0.0/10.0
$220,000
🖨 Deal sheet 📄 Offer letter ✓ Due diligence
Listing remarks
Welcome to 5788 Alexandria Lane. This 3- bedroom, 2-bath home is all about convenience and comfort, located in the heart of it all - close to malls, restaurants, and the hospital. Enjoy mornings in the bright eat-in kitchen and unwind in the beautifully updated, salon master bath. Large primary with private door leading to the covered patio. Sitting on a spacious corner lot with double garage, this home offers both functionality and charm in a location that can make life easier.
Key facts
- Covered patio
- Spacious corner lot
- Eat-in kitchen
Tags
Property features AI
Finance
- HOA & community: Community association (includes grounds maintenance and management); Curbs in community
Exterior
- Parking: 2-car garage; Concrete parking surfaces
- Security: Smoke detectors
- Utilities: Public water; Public sewer; Electricity connected; Natural gas connected; Cable connected
- Home design: Single-family house; One story; Entry level: One
- Construction: Brick construction; Asphalt shingle roof; Slab foundation; Built (year per public records)
- Exterior features: Patio; Rain gutters; Corner lot; Level lot
Interior
- Kitchen: Dishwasher; Disposal; Electric range; Range hood; Exhaust fan
- Flooring: Linoleum; Tile
- Bathrooms: 2 full bathrooms
- Heating & cooling: Central heating (natural gas); Central air (electric)
- Interior features: Ceiling fans; Eat-in kitchen; Pantry; Vinyl windows; Metal insulated doors
Neighborhood map
What this means for you Summary
Snapshot
- This is a 3-bed/2.0-bath single-family listed at $220k.
Deal economics
- At list price, monthly cash flow is $33 ($391/yr) — positive.
- The deal already cash-flows at list — no discount required.
- To meet the 1% rule (rent ≥ 1% of price), the offer needs to be $175k (20.4% below list).
- Recommended offer: $175k (20.4% below list) — sets the bar for 1% rule.
- Cap rate 6.5% vs local median 5.2% in Southaven — meaningfully above typical; check what's discounted (condition, days-on-market, listing class) to confirm the premium yield is real.
Location & tenants
- Location reads 65/100 on livability (#107 in MS) — a middle-class / working-renter tenant base. Strengths: cost of living A+, housing A+; Watch: amenities F, commute F, health & safety F.
- Desoto County School District (suburban): math 48% / reading 42% proficiency, ranked #20 of 130 in MS (top 15%) — families likely to look elsewhere, expect single-tenant / working-renter base with shorter leases.
- Zoned schools: Southaven Elementary (math 20% / reading 23%, grade F, #239 of 375 statewide, top 64%, 684 students, 100% FRL); Southaven Middle School (math 33% / reading 25%, grade F, #90 of 179 statewide, top 52%, 1,456 students, 100% FRL); Southaven High School (math 26% / reading 35%, grade F, #88 of 197 statewide, top 45%, 1,850 students, 100% FRL) — zoned schools average 100% FRL vs 43% district-wide (56 pts higher); higher-poverty schools than district average — tighter screening recommended.
- Zoned-school proficiency averages 27% at this address vs 45% district-wide (-18 pts) — the specific schools serving this property underperform the Desoto County School District average; the district grade overstates school quality for this exact location.
- Market conditions: Rents rising (+3.2%/yr); 193 active listings in the ZIP; 23 comparable units currently listed for rent nearby; rentals at typical pace (median 21d on market — plan ~3-4 weeks tenant-placement turnaround); 1,155 units permitted in DeSoto County in 2024 (0 in 5+ unit buildings).
- This rent runs 34% of the median local income ($62k/yr) — at the standard rent-burdened threshold; future hikes will face affordability resistance.
Forward outlook
- Local home prices are declining (-3.0%/yr); year-one equity from $2k of loan paydown is wiped out by about $7k of value loss. Plan a longer hold.
- DeSoto County population projected at +33% by 2050 — long-run rental-demand tailwind backs the buy-and-hold thesis.
Negotiation context
- Only 4 days on market — expect competitive offers; lowballing is unlikely to land.
- 2 sale attempts since 21y ago with the ask held roughly flat each time — persistent listings suggest the price (not the market) is what's stuck; bring a comps-based counter.
Risks & watch-outs
- Climate carrying-cost: extreme-heat days projected 7→22/yr by 2055 (HVAC capex compounding) — expect insurance premiums to compound above CPI over the hold.
Questions for the listing agent
- Is there a deadline driving the sale (1031 exchange, divorce, estate, relocation)? That informs how much negotiation room exists.
- Schools are D-rated, which usually means shorter tenancies and higher turnover. Who's the typical renter profile here, and what's been the actual vacancy rate?
- The area grade is low — what's the realistic commute time and amenity access for the typical tenant pool here? Any planned neighborhood developments (good or bad) we should know about?
- What's the average days-on-market for RENTAL listings here right now (not sales)? A rising rental-DOM trend means longer vacancies and softer asking-rent achievability than the comps imply.
- What's the recent tenant-quality profile in this submarket — average credit score on applications, eviction rate, late-payment / NSF rate, and stable-employment percentage? A property-management company in the area should have these aggregated.
- How much new for-sale + rental construction is in the pipeline within 1–3 miles? Heavy new supply typically softens prices + rents 12–24 months out; constrained supply supports both.
Investment metrics
- 1% rule
- 0.80% ✗
- Cap rate
- 6.47%
- Cash-on-cash
- 0.64%
- DSCR
- 1.03
- GRM
- 10.5
CMA / ARV
- ARV (median comp)
- $210,614
- List price
- $220,000
- Delta
- 4.46%
- Verdict
- FAIR
- Comps
- 20 within 1.0 mi
Show comp detail 12 sales within ~0.75 mi
| Address | Dist | Beds/Ba | Sqft | Sold | Price | $/sf | Match |
|---|---|---|---|---|---|---|---|
| 5788 Alexandria Ln | 0.00mi | 3/2.0 | 1,443 (+3%) | 1mo | $220,000 | $152 | 94 |
| 5714 Steffani Dr | 0.10mi | 3/2.0 | 1,341 (-4%) | 9mo | $229,500 | $171 | 81 |
| 5793 Steffani Dr | 0.02mi | 3/2.0 | 1,253 (-10%) | 10mo | $220,000 | $176 | 74 |
| 622 Amber Ln | 0.60mi | 3/2.0 | 1,421 (+2%) | 4mo | $234,999 | $165 | 66 |
| 5400 Lime Tree Dr | 0.65mi | 3/2.0 | 1,468 (+5%) | 5mo | $259,900 | $177 | 57 |
| 5566 Kayla Dr | 0.22mi | 3/2.0 | 1,253 (-10%) | 19mo | $199,900 | $160 | 57 |
| 5267 Peach Trail Cv | 0.63mi | 3/2.0 | 1,528 (+9%) | 1mo | $265,000 | $173 | 54 |
| 5455 Kayla Dr | 0.33mi | 2/2.0 (-1) | 1,206 (-14%) | 10mo | $224,000 | $186 | 48 |
| 453 Cherry Tree Ln | 0.69mi | 3/2.0 | 1,486 (+6%) | 12mo | $255,000 | $172 | 47 |
| 5623 Lexy Ln | 0.68mi | 3/2.0 | 1,300 (-7%) | 18mo | $228,000 | $175 | 42 |
| 5353 Kristy Ln | 0.75mi | 2/2.0 (-1) | 1,272 (-9%) | 6mo | $229,900 | $181 | 40 |
| 5448 Pollard Dr | 0.72mi | 2/2.0 (-1) | 1,241 (-11%) | 6mo | $204,900 | $165 | 38 |
Match score weights: distance 35% · size 25% · config 20% · recency 20%. Top-matched comps best support the ARV.
Projected returns pro-forma
-3.0% appreciation · 3.2% rent growth · sell at horizon
- IRR
- -15.1%
- Equity multiple
- 0.46×
- Total profit
- $-33,297
- Equity at exit
- $32,803
- IRR
- -6.3%
- Equity multiple
- 0.59×
- Total profit
- $-25,182
- Equity at exit
- $19,022
Cash invested: $61,600 (down + closing). Projections, not guarantees.
Landlord ↔ Tenant lean methodology
- Overall (STATE)
- 90 Strongly Landlord-Friendly
- State Mississippi
- 90 Strongly Landlord-Friendly · R+11
- County
- — inherits STATE
- City
- — inherits STATE
ZIP-level market 38671
- Home prices YoY
- -18.2%
- Rents YoY
- 3.2%
- Active inventory
- 193
- Price-to-rent
- 10.5×
Monthly cashflow live
- Estimated rent
- $1,750 high interval (Pro) →
- Mortgage (P&I)
- −$1,154
- Tax from tax record
- −$105 /mo · $1,259/yr
- Insurance
- −$92
- HOA
- −$0
- Vacancy / Maint / Mgmt
- −$368
- Net cashflow
- $33
Break-even live
UW: 25.0% down · 7.5% · 30yr · 1.5% tax · 5.0% vac · 8.0% maint · 8.0% mgmt
Financing live
Cash to close
- Down payment
- $55,000
- Closing costs
- $6,600
- Reserves months
- —
- Total cash needed
- —
Loan-product check · same deal, 3 products live
Conventional
25% down · 7.5% · 30yr
- Down + closing
- —
- Monthly P&I
- —
- Monthly cashflow
- —
- DSCR
- —
- Eligible?
- —
Personal DTI + credit; lowest rate.
DSCR
20% down · 8.5% · 30yr
- Down + closing
- —
- Monthly P&I
- —
- Monthly cashflow
- —
- DSCR
- —
- Eligible?
- —
No personal income docs; deal must DSCR.
Hard money
10% down · 12.0% · 12mo
- Down + closing
- —
- Monthly P&I
- —
- Monthly cashflow
- —
- DSCR
- —
- Eligible?
- —
Short-term bridge; refi at stabilization.
Rent comps 23 comps
| Address | Beds | Baths | Sqft | Rent | $/sqft | DOM | Units | Dist |
|---|---|---|---|---|---|---|---|---|
| 5905 Airways Blvd Southaven, MS | 1.0–3.0 | 1.0–2.0 | 1102 | $1,475 | $1.34 | 2d | 23 | 0.17mi |
| 5447 Steffani Dr Southaven, MS | 3.0 | 2.0 | 1300 | $1,695 | $1.30 | 23d | 1 | 0.37mi |
| 5910 Garden Walk E Southaven, MS | 2.0 | 2.0 | 1157 | $1,495 | $1.29 | 23d | 1 | 0.55mi |
| 5593 Casey Ln Southaven, MS | 3.0 | 2.0 | 1800 | $1,835 | $1.02 | 23d | 1 | 0.62mi |
| 390 Cherry Tree Ln Southaven, MS | 3.0 | 2.0 | 1650 | $1,870 | $1.13 | 43d | 1 | 0.65mi |
| 799 Grant Dr Southaven, MS | 3.0 | 2.0 | 1380 | $1,710 | $1.24 | 21d | 1 | 0.79mi |
| 5367 Kalian Cv Southaven, MS | 3.0 | 2.0 | 1100 | $1,600 | $1.45 | 43d | 1 | 0.81mi |
| 5654 April Dr Southaven, MS | 2.0 | 2.0 | 1492 | $1,495 | $1.00 | 2d | 1 | 0.83mi |
| 5654 April Dr Southaven, MS | 2.0 | 2.0 | 1492 | $1,495 | $1.00 | 4d | 1 | 0.83mi |
| 5604 Corvin Ln Southaven, MS | 4.0 | 2.0 | 1731 | $1,975 | $1.14 | 21d | 1 | 0.98mi |
| 1028 We Ross Pkwy W Southaven, MS | 2.0 | 2.0 | 1246 | $1,700 | $1.36 | 43d | 1 | 1.04mi |
| 5890 Carrel Cv Southaven, MS | 3.0 | 2.0 | 1866 | $1,980 | $1.06 | 4d | 1 | 1.04mi |
| 5186 Church Lake Dr Southaven, MS | 1.0–3.0 | 1.0–2.0 | 931 | $1,574 | $1.69 | 2d | 20 | 1.10mi |
| 1096 We Ross Pkwy W Southaven, MS | 3.0 | 2.0 | 1445 | $2,000 | $1.38 | 43d | 1 | 1.10mi |
| 1208 We Ross Pkwy W Southaven, MS | 3.0 | 2.0 | 1581 | $1,903 | $1.20 | 43d | 1 | 1.23mi |
| 5962 Stafford Dr Southaven, MS | 4.0 | 2.0 | 1775 | $2,010 | $1.13 | 4d | 1 | 1.28mi |
| 5935 Telford Dr Southaven, MS | 3.0 | 2.0 | 1724 | $1,800 | $1.04 | 23d | 1 | 1.32mi |
| 4744 W East Ross Pkwy Southaven, MS | 1.0–3.0 | 1.0–2.0 | 1054 | $1,801 | $1.71 | 3d | 10 | 1.34mi |
| 371 Alex Cv Southaven, MS | 3.0 | 2.0 | 1300 | $1,595 | $1.23 | 2d | 1 | 1.36mi |
| 5380 Peppermill Dr Southaven, MS | 3.0 | 2.0 | 1526 | $1,850 | $1.21 | 4d | 1 | 1.39mi |
| 5381 Peppermill Dr Southaven, MS | 3.0 | 2.0 | 1400 | $1,950 | $1.39 | 43d | 1 | 1.43mi |
| 330 Avery Jordan Cv Southaven, MS | 3.0 | 2.0 | 1221 | $1,605 | $1.31 | 4d | 1 | 1.44mi |
| 4740 US-51 Southaven, MS | 1.0–2.0 | 1.0–2.0 | 840 | $1,486 | $1.77 | 2d | 7 | 1.45mi |
Listing history 5 events
-
2026-05-02status Pending 483-char remark
-
2026-04-28$220,000 Active 483-char remark
-
2005-04-27soldstatus
-
2005-03-11$92,000
-
2005-02-14soldstatus
ⓘ Source: listings_history table (triggers on properties + properties_extension) + one-shot
backfill from property_details.listing_events for pre-trigger history.
Tax reassessment forecast MS · Resets to sale price
- Current annual tax
- $1,259 · $105/mo
- Projected year-2 tax
- $1,738 · $145/mo
- Expected delta
- +$479/yr (+$40/mo · 38.1%)
ⓘ Screening estimate from a state-policy table — verify with the county assessor before closing.
Climate risk First Street
- Flood 1/10 Low FEMA zone X (unshaded) · 0% chance over 30 yrs
- Wildfire 4/10 Moderate
- Heat 7/10 Severe 7 d/yr ≥109°F today · 22 d/yr by 30 yrs out
- Wind 4/10 Moderate 20% chance of damaging wind over 30 yrs
- Air quality 2/10 Low 2 unhealthy d/yr today · 2 by 30 yrs out
Nearby sold comps map
Loading sold comps map…
Walkable amenities ~0.75 mi
Loading nearby amenities…
Taxation est. · year 1
- Rental income
- $21,006
- − Mortgage interest
- −$12,323
- − Property taxes
- −$1,259
- − Insurance
- −$1,100
- − Repairs & maintenance
- −$1,680
- − Management
- −$1,680
- − Depreciation
- −$6,400
- Taxable loss
- −$3,437
- Est. tax savings @ 24.0%
- +$825
- After-tax cash flow
- $1,216/yr
For passive investors: Depreciation is non-cash, so a rental often shows a tax loss while cash-flowing — sheltering income. Rental losses are passive: they offset passive income freely, and up to $25,000/yr can offset ordinary (W-2) income if you actively participate and your MAGI is under $100k (phasing out to $0 by $150k); unused losses carry forward. On sale, claimed depreciation is recaptured at up to 25%, and gains may owe capital-gains tax (a 1031 exchange can defer both). Figures are a year-1 estimate at your 24.0% rate — not tax advice; consult a CPA.
Schools (NCES district)
- District
- Desoto County School District
- NCES district ID
- 2801320
- Math proficiency
- 48% ▼ -13.00%
- Reading proficiency
- 42% ▼ -6.00%
- Median HH income
- $59,272
- Composite
- 39.56/100
- National rank
- #3933
- State rank
- #20 of 130 in MS
Livability — Southaven
- Score
- 65/100
- State rank
- #107
- US rank
- #12584
Category grades
Schools grade is shown separately in the Schools card above.
Census & demographics
- Census place
- Southaven, MS
- County
- DeSoto County · 176,513 people
- City population
- 53,755
- Metro
- Memphis, TN-MS-AR
- Population (ZIP)
- 37,319
- Household income
- $61,843
- Rent vs Own
- Severe rent burden
- 1583.0
Population outlook (DeSoto County) Hauer SSP2
- Today (2025)
- 203,338 people
- By 2030
- 217,692 · +7.1%
- By 2040
- 245,320 · +20.6%
- By 2050
- 270,133 · +32.8%
- By 2075
- 323,341 · +59.0%
- By 2100
- 348,742 · +71.5%
Race, ethnicity, and origin ACS 2023
- Neighborhood character
- Diverse neighborhood (Simpson 0.58)
- Race & ethnicity
- White 49% Black 42% Hispanic / Latino 6% Two or more races 4%
- Hispanic origin (detail)
- Mexican 3%
- Common ancestry
- Italian 1% Lithuanian 1% Serbian 1%
- Foreign-born
- 3% · Canada
- Languages at home
- 95% English-only · Spanish 4%
Political lean MEDSL · DeSoto
- 2024 margin
- Strong R (+24.1) · D 36.7% · R 60.8% · Other 2.5%
- 2008→2024 swing
- +14.2pp toward D · 2008: -38.2pp · 2024: -24.1pp
- All cycles
- 2024: R+24.1 2020: R+23.9 2016: R+34.8 2012: R+33.5 2008: R+38.2
Not yet ingested
- Civics
- —
Market trends
- HPI YoY
- ▼ -49.08%
- Current HPI
- 220.7875
- Rent YoY
- ▲ 3.20%
- Metro
- Memphis, TN-MS-AR
- State GDP YoY
- —
- F500 in state
- 0
Price history
+139.1% since first listed7 events — show timeline
- 2026-06-08 Sold (Public Records) — Public Records
- 2026-05-28 Sold (MLS) — MLSU
- 2026-05-02 Pending — MLSU
- 2026-04-28 Listed $220,000 MLSU
- 2005-04-27 Sold (MLS) — MLSU
- 2005-03-11 Listed $92,000 MLSU
- 2005-02-14 Sold (Public Records) — Public Records
Property tax history
+2.0%/yrLatest (2025): $1,259 · +17.0% YoY. Source: county tax records.
Cash-flow waterfall
monthlySold comps — $/sqft
last 12 mo · ≤1 miLoading sold comps…