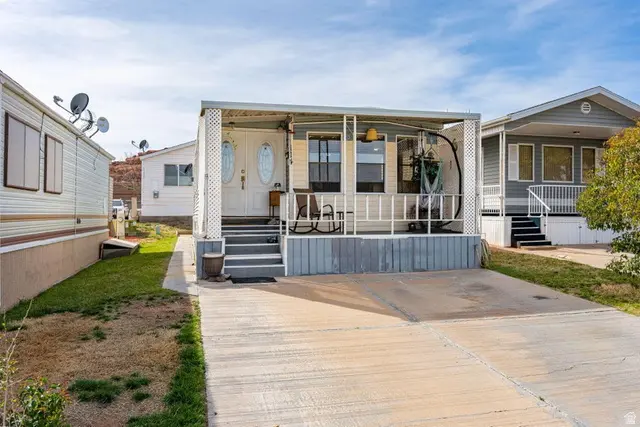
1150 W Red Pkwy #114 · Washington, UT
Flood risk 1/10 · Minimal
- FEMA flood zone
- X (unshaded)
- Chance of flooding over 30 yrs
- 0.0%
- Est. flood insurance / yr
- $507 – $1,088
Fire risk 7/10 · Major
- Est. fire insurance / yr
- $453 – $841
Heat risk 6/10 · Moderate
- Hot days now (above 103°F)
- 4 days/yr
- Hot days in 30 yrs
- 11 days/yr
Wind risk 1/10 · Minimal
- Chance of severe wind over 30 yrs
- —
Air-quality risk 2/10 · Minimal
- Unhealthy air days now
- 0 days/yr
- Unhealthy air days in 30 yrs
- 1 days/yr
Risk factors via First Street. Map © Google.
Why this score? — see what drove the D+ grade
The composite is a weighted blend of 9 inputs, each scored 0–100. Each bar is that input's sub-score; the figure is the points it added to the 100-point composite (weight × sub-score).
- Cash flow +18.6/30.0
- ARV discount +7.5/15.0
- DSCR +5.8/10.0
- 1% rule +5.3/10.0
- Livability +3.8/5.0
- Schools +3.7/10.0
- Rent growth +2.5/5.0
- Condition / age +2.5/5.0
- Appreciation +0.0/10.0
$145,000
🖨 Deal sheet 📄 Offer letter ✓ Due diligence
Listing remarks
Great opportunity for affordable living in Canyon Breeze! This well-kept property offers a comfortable layout with a bright living area, wood-style flooring, and plenty of natural light. The kitchen has good cabinet space and a functional setup, with an adjoining dining area for everyday meals. The bedroom includes built-in storage to help maximize space. Enjoy the covered front porch, perfect for relaxing outside, plus 2 uncovered parking spots and low-maintenance yard space. Located close to shopping, restaurants, and other amenities.
Key facts
- Covered front porch
- Built in storage
- Bright living area
Tags
Property features AI
Finance
- Other: Has view
- HOA & community: Homeowners association (Cam Utah); Monthly association fee of $139 covering trash; Community amenities include clubhouse, gated access, fitness center, and pool; Subdivision: CANYON BREEZE RV RESORT
Exterior
- Parking: Carport (covered) for 2 vehicles; 2 total parking spaces
- Utilities: Natural gas connected; Electricity connected; Sewer connected; Water connected (culinary and irrigation)
- Home design: Modular construction; Built/standing condition; Residential use; View facing mountain
- Construction: Metal roof
- Exterior features: Exterior lighting; Curb and gutter; Paved road; Mountain view; Flat terrain
Interior
- Kitchen: Gas oven; Freestanding range; Dishwasher disposal; Microwave; Refrigerator
- Bedrooms: 1 bedroom on the main level
- Bathrooms: 1 full bathroom
- Heating & cooling: Heat pump for heating; Heat pump for cooling
- Interior features: Disposal; Oven: Gas; Freestanding range/oven; Ceiling fan; Microwave; Refrigerator; Satellite dish; Window coverings
- Laundry & utility: Washer; Dryer
Neighborhood map
What this means for you Summary
Snapshot
- This is a 1-bed/1.0-bath manufactured listed at $145k.
Deal economics
- At list price, monthly cash flow is $140 ($2k/yr) — positive.
- The deal already cash-flows at list — no discount required.
- Meets the 1% rule at list price ($1k rent vs $145k).
- Recommended offer: $132k (9.0% below list) — sets the bar for market timing.
Location & tenants
- Location reads 75/100 on livability (#59 in UT, #3,809 nationally) — a middle-class / working-renter tenant base. Strengths: commute A+, employment A+, housing A+; Watch: cost of living D, amenities F, health & safety F.
- Washington District (urban): math 42% / reading 45% proficiency, ranked #37 of 80 in UT (top 46%) — families likely to look elsewhere, expect single-tenant / working-renter base with shorter leases.
- Zoned schools: Sandstone School (math 21% / reading 28%, grade F, #474 of 585 statewide, top 83%, 506 students, 60% FRL); Pine View High (math 29% / reading 48%, grade F, #74 of 171 statewide, top 43%, 1,143 students, 33% FRL).
- Zoned-school proficiency averages 32% at this address vs 44% district-wide (-12 pts) — the specific schools serving this property underperform the Washington District average; the district grade overstates school quality for this exact location.
- Market conditions: Rents soft (-0.1%/yr); 1024 active listings in the ZIP; 3 comparable units currently listed for rent nearby; rentals leasing fast (median 13d on market — plan ~1-2 weeks tenant-placement turnaround); solid renter incomes; 3,140 units permitted in Washington County in 2024 (650 in 5+ unit buildings).
Forward outlook
- Local home prices are declining (-3.0%/yr); year-one equity from $1k of loan paydown is wiped out by about $4k of value loss. Plan a longer hold.
- Washington County population projected at +44% by 2050 — long-run rental-demand tailwind backs the buy-and-hold thesis.
Negotiation context
- It's been on market 93 days — a 9% lower offer ($132k) is reasonable based on typical stale-listing flexibility.
- 5 sale attempts since 11y ago with the ask held roughly flat each time — persistent listings suggest the price (not the market) is what's stuck; bring a comps-based counter.
Risks & watch-outs
- Climate carrying-cost: major wildfire risk; extreme-heat days projected 4→11/yr by 2055 (HVAC capex compounding) — expect insurance premiums to compound above CPI over the hold.
Questions for the listing agent
- It's been on market 93 days. Have you received any prior offers? Is the seller open to a 9% concession, seller financing, or rate buy-down credit?
- What does the HOA fee cover, when was the last increase, and are there any pending special assessments or reserve-fund shortfalls?
- Why hasn't it sold? Are there any deal-killer items the seller is aware of (foundation, flood, title, zoning, code violations)?
- Is there a deadline driving the sale (1031 exchange, divorce, estate, relocation)? That informs how much negotiation room exists.
- The area grade is low — what's the realistic commute time and amenity access for the typical tenant pool here? Any planned neighborhood developments (good or bad) we should know about?
- What's the average days-on-market for RENTAL listings here right now (not sales)? A rising rental-DOM trend means longer vacancies and softer asking-rent achievability than the comps imply.
- What's the recent tenant-quality profile in this submarket — average credit score on applications, eviction rate, late-payment / NSF rate, and stable-employment percentage? A property-management company in the area should have these aggregated.
- How much new for-sale + rental construction is in the pipeline within 1–3 miles? Heavy new supply typically softens prices + rents 12–24 months out; constrained supply supports both.
Investment metrics
- 1% rule
- 1.03% ✓
- Cap rate
- 7.45%
- Cash-on-cash
- 4.14%
- DSCR
- 1.18
- GRM
- 8.1
CMA / ARV
No comps found within radius.
Projected returns pro-forma
-3.0% appreciation · 0.0% rent growth · sell at horizon
- IRR
- -13.4%
- Equity multiple
- 0.53×
- Total profit
- $-18,912
- Equity at exit
- $21,620
- IRR
- -10.2%
- Equity multiple
- 0.47×
- Total profit
- $-21,714
- Equity at exit
- $12,537
Cash invested: $40,600 (down + closing). Projections, not guarantees.
Landlord ↔ Tenant lean methodology
- Overall (STATE)
- 86 Strongly Landlord-Friendly
- State Utah
- 86 Strongly Landlord-Friendly · R+15
- County
- — inherits STATE
- City
- — inherits STATE
ZIP-level market 84780
- Rents YoY
- -0.1%
- Active inventory
- 1024
- Price-to-rent
- 8.1×
Monthly cashflow live
- Estimated rent
- $1,493 medium interval (Pro) →
- Mortgage (P&I)
- −$760
- Tax from tax record
- −$80 /mo · $958/yr
- Insurance
- −$60
- HOA
- −$139
- Vacancy / Maint / Mgmt
- −$314
- Net cashflow
- $140
Break-even live
UW: 25.0% down · 7.5% · 30yr · 1.5% tax · 5.0% vac · 8.0% maint · 8.0% mgmt
Financing live
Cash to close
- Down payment
- $36,250
- Closing costs
- $4,350
- Reserves months
- —
- Total cash needed
- —
Loan-product check · same deal, 3 products live
Conventional
25% down · 7.5% · 30yr
- Down + closing
- —
- Monthly P&I
- —
- Monthly cashflow
- —
- DSCR
- —
- Eligible?
- —
Personal DTI + credit; lowest rate.
DSCR
20% down · 8.5% · 30yr
- Down + closing
- —
- Monthly P&I
- —
- Monthly cashflow
- —
- DSCR
- —
- Eligible?
- —
No personal income docs; deal must DSCR.
Hard money
10% down · 12.0% · 12mo
- Down + closing
- —
- Monthly P&I
- —
- Monthly cashflow
- —
- DSCR
- —
- Eligible?
- —
Short-term bridge; refi at stabilization.
Rent comps 3 comps
| Address | Beds | Baths | Sqft | Rent | $/sqft | DOM | Units | Dist |
|---|---|---|---|---|---|---|---|---|
| 45 N Red Trail Ln Washington, UT | 2.0 | 1.0–2.0 | 699 | $1,499 | $2.14 | 13d | 1 | 0.17mi |
| 190 N Red Stone Rd Washington, UT | 1.0–3.0 | 1.0–2.0 | 943 | $1,403 | $1.49 | 13d | 10 | 0.43mi |
| 1165 E Bulloch St Washington, UT | 1.0–3.0 | 1.0–2.5 | 1210 | $1,449 | $1.20 | 13d | 8 | 0.60mi |
HOA detail
- Monthly dues
- $139 · $1,668/yr
Listing history 25 events
-
2026-06-19days on market $145,000 Active 93 DOM
-
2026-06-18days on market $145,000 Active 92 DOM
-
2026-06-17days on market $145,000 Active 91 DOM
-
2026-06-16days on market $145,000 Active 90 DOM
-
2026-06-15days on market $145,000 Active 89 DOM
-
2026-06-14days on market $145,000 Active 87 DOM
-
2026-06-13days on market $145,000 Active 86 DOM
-
2026-06-10days on market $145,000 Active 84 DOM
-
2026-06-09days on market $145,000 Active 83 DOM
-
2026-06-08days on market $145,000 Active 82 DOM
-
2026-06-07days on market $145,000 Active 81 DOM
-
2026-06-05days on market $145,000 Active 78 DOM
-
2026-06-02days on market $145,000 Active 76 DOM
-
2026-06-01days on market $145,000 Active 75 DOM
-
2026-05-31days on market $145,000 Active 74 DOM
-
2026-05-30days on market $145,000 Active 73 DOM
-
2026-04-03historical
-
2026-03-18status Active
-
2026-03-18$145,000 Active
-
2026-02-24historical
-
2024-06-11$496,500 Active
-
2023-02-03historical
-
2017-04-03soldstatus
-
2015-10-18$55,000
-
2015-10-18$55,000
ⓘ Source: listings_history table (triggers on properties + properties_extension) + one-shot
backfill from property_details.listing_events for pre-trigger history.
Tax reassessment forecast UT · Resets to sale price
- Current annual tax
- $958 · $80/mo
- Projected year-2 tax
- $958 · $80/mo
- Expected delta
- $0/yr ($0/mo · 0.0%)
ⓘ Screening estimate from a state-policy table — verify with the county assessor before closing.
Climate risk First Street
- Flood 1/10 Low FEMA zone X (unshaded) · 0% chance over 30 yrs
- Wildfire 7/10 Severe
- Heat 6/10 Major 4 d/yr ≥103°F today · 11 d/yr by 30 yrs out
- Wind 1/10 Low
- Air quality 2/10 Low 0 unhealthy d/yr today · 1 by 30 yrs out
Nearby sold comps map
Loading sold comps map…
Walkable amenities ~0.75 mi
Loading nearby amenities…
Taxation est. · year 1
- Rental income
- $17,919
- − Mortgage interest
- −$8,122
- − Property taxes
- −$958
- − Insurance
- −$725
- − Repairs & maintenance
- −$1,433
- − Management
- −$1,433
- − HOA
- −$1,668
- − Depreciation
- −$4,218
- Taxable loss
- −$640
- Est. tax savings @ 24.0%
- +$154
- After-tax cash flow
- $1,833/yr
For passive investors: Depreciation is non-cash, so a rental often shows a tax loss while cash-flowing — sheltering income. Rental losses are passive: they offset passive income freely, and up to $25,000/yr can offset ordinary (W-2) income if you actively participate and your MAGI is under $100k (phasing out to $0 by $150k); unused losses carry forward. On sale, claimed depreciation is recaptured at up to 25%, and gains may owe capital-gains tax (a 1031 exchange can defer both). Figures are a year-1 estimate at your 24.0% rate — not tax advice; consult a CPA.
Schools (NCES district)
- District
- Washington District
- NCES district ID
- 4901140
- Math proficiency
- 42% ▼ -3.00%
- Reading proficiency
- 45% ▼ -3.00%
- Median HH income
- $50,861
- Composite
- 37.47/100
- National rank
- #4408
- State rank
- #37 of 80 in UT
Livability — Washington
- Score
- 75/100
- State rank
- #59
- US rank
- #3809
Category grades
Schools grade is shown separately in the Schools card above.
Census & demographics
- Census place
- Washington, UT
- County
- Washington County · 179,216 people
- City population
- 32,366
- Metro
- St. George, UT
- Population (ZIP)
- 32,366
- Household income
- $91,963
- Rent vs Own
- Severe rent burden
- 1036.0
Population outlook (Washington County) Hauer SSP2
- Today (2025)
- 193,324 people
- By 2030
- 211,699 · +9.5%
- By 2040
- 246,449 · +27.5%
- By 2050
- 278,447 · +44.0%
- By 2075
- 342,734 · +77.3%
- By 2100
- 382,815 · +98.0%
Race, ethnicity, and origin ACS 2023
- Neighborhood character
- Predominantly White (77%)
- Race & ethnicity
- White 77% Hispanic / Latino 17% Two or more races 9%
- Hispanic origin (detail)
- Mexican 11% Puerto Rican 1%
- Common ancestry
- Italian 6% Slovak 5% Lithuanian 3%
- Foreign-born
- 5% · Canada, Jamaica, China
- Languages at home
- 89% English-only · Spanish 8% Chinese 1% German/W. Germanic 1%
Political lean MEDSL · Washington
- 2024 margin
- Solid R (+52.3) · D 23.0% · R 75.2% · Other 1.8%
- 2008→2024 swing
- +1.2pp toward D · 2008: -53.5pp · 2024: -52.3pp
- All cycles
- 2024: R+52.3 2020: R+51.7 2016: R+52.1 2012: R+67.0 2008: R+53.5
Not yet ingested
- Civics
- —
Market trends
- HPI YoY
- ▼ -144.73%
- Current HPI
- 248.9421
- Rent YoY
- ▼ -0.06%
- Metro
- St. George, UT
- State GDP YoY
- ▲ 3.54%
- F500 in state
- 2
Industry mix (Fortune 500 HQ in UT)
| Industry | F500 HQs | Revenue |
|---|---|---|
| Financial Services | 1 | $3B |
|
||
Price history
+163.6% since first listed9 events — show timeline
- 2026-04-03 Listing Removed — WFRMLS
- 2026-03-18 Relisted — WFRMLS
- 2026-03-18 Listed $145,000 WFRMLS
- 2026-02-24 Listing Removed — WFRMLS
- 2024-06-11 Listed $496,500 WFRMLS
- 2023-02-03 Listing Removed — WFRMLS
- 2017-04-03 Sold (Public Records) — Public Records
- 2015-10-18 Listed $55,000 WFRMLS
- 2015-10-18 Listed $55,000 ICBORMLS
Property tax history
+5.4%/yrLatest (2025): $958 · +5.3% YoY. Source: county tax records.
Cash-flow waterfall
monthlySold comps — $/sqft
last 12 mo · ≤1 miLoading sold comps…