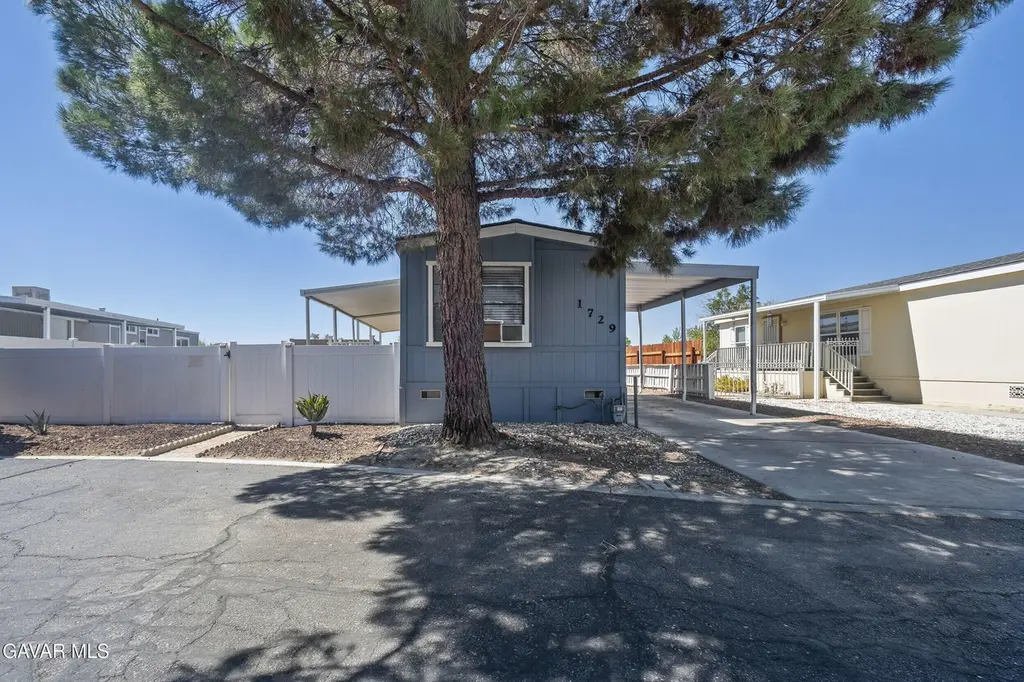
1729 Jamie Way #134 · Rosamond, CA
Flood risk 6/10 · Moderate
- FEMA flood zone
- A
- Chance of flooding over 30 yrs
- 0.76%
- Est. flood insurance / yr
- $1,009 – $1,996
Fire risk 4/10 · Minor
- Est. fire insurance / yr
- $659 – $1,223
Heat risk 7/10 · Major
- Hot days now (above 101°F)
- 5 days/yr
- Hot days in 30 yrs
- 14 days/yr
Wind risk 1/10 · Minimal
- Chance of severe wind over 30 yrs
- —
Air-quality risk 8/10 · Major
- Unhealthy air days now
- 16 days/yr
- Unhealthy air days in 30 yrs
- 21 days/yr
Risk factors via First Street. Map © Google.
Why this score? — see what drove the A- grade
The composite is a weighted blend of 9 inputs, each scored 0–100. Each bar is that input's sub-score; the figure is the points it added to the 100-point composite (weight × sub-score).
- Cash flow +30.0/30.0
- ARV discount +15.0/15.0
- 1% rule +10.0/10.0
- DSCR +10.0/10.0
- Appreciation +6.2/10.0
- Rent growth +2.5/5.0
- Livability +2.5/5.0
- Condition / age +2.5/5.0
- Schools +2.2/10.0
$74,999
🖨 Deal sheet 📄 Offer letter ✓ Due diligence
Listing remarks MLS
Beautiful 3bedroom 2bathroom mobile home in the expanding city of Rosamond for sale at an amazing price. With a huge storage unit, 3 car private parking, beautiful and private, white fence, and a designated laundry room. This one won't last long, be sure to schedule a showing!
Key facts
- Community pool
- Built 1987
- Listed 62 days
Neighborhood map
What this means for you Summary
Snapshot
- This is a 3-bed/2.0-bath manufactured listed at $75k.
Deal economics
- At list price, monthly cash flow is $875 ($10k/yr) — positive.
- The deal already cash-flows at list — no discount required.
- Meets the 1% rule at list price ($2k rent vs $75k).
- Recommended offer: $70k (6.0% below list) — sets the bar for market timing.
- Cap rate 22.3% vs local median 4.3% in Rosamond — top-decile yield for the area; either an underpriced asset or a hidden risk that comps aren't pricing in. Stress-test before assuming the spread holds.
Location & tenants
- Location reads 49/100 on livability (#1,178 in CA) — a working-class tenant base; expect higher turnover. Strengths: housing A+; Watch: schools F, crime F, amenities F.
- Southern Kern Unified (town): math 25% / reading 25% proficiency, ranked #387 of 517 in CA (top 75%) — low school quality limits family demand, transient renter base, plan for 1-2y turnover; 67% free/reduced lunch — lower-income household profile, screen leases tightly.
- Market conditions: 458 active listings in the ZIP; 4 comparable units currently listed for rent nearby; rentals leasing fast (median 1d on market — plan ~1-2 weeks tenant-placement turnaround); solid renter incomes; 3,244 units permitted in Kern County in 2024 (73 in 5+ unit buildings).
Forward outlook
- In year one you build about $2k of equity ($518 loan paydown + $2k appreciation (2.4% local appreciation)).
- Kern County population projected at +17% by 2050 — long-run rental-demand tailwind backs the buy-and-hold thesis.
- At projected returns (2.4% appreciation + 3.0% rent growth), your $21k cash investment doubles in ~2 years — after that, you're playing with house money.
Negotiation context
- It's been on market 62 days — a 6% lower offer ($70k) is reasonable based on typical stale-listing flexibility.
- 5 sale attempts since 4y ago; this cycle's ask has dropped $5k (6%) from the opening price — seller is motivated, your offer sets the floor, not the list.
- Current owner paid $65k; 15% above their basis — modest negotiation headroom, anchor on the comps not their cost.
Risks & watch-outs
- Watch-outs: flood insurance adds $125/mo.
- Climate carrying-cost: in FEMA flood zone A (mandatory federal flood insurance); extreme-heat days projected 5→14/yr by 2055 (HVAC capex compounding) — expect insurance premiums to compound above CPI over the hold.
Questions for the listing agent
- It's been on market 62 days. Have you received any prior offers? Is the seller open to a 6% concession, seller financing, or rate buy-down credit?
- What's the actual annual flood-insurance premium (NFIP or private), and is the property in a SFHA with mandatory coverage?
- Why hasn't it sold? Are there any deal-killer items the seller is aware of (foundation, flood, title, zoning, code violations)?
- Is there a deadline driving the sale (1031 exchange, divorce, estate, relocation)? That informs how much negotiation room exists.
- Schools are F-rated, which usually means shorter tenancies and higher turnover. Who's the typical renter profile here, and what's been the actual vacancy rate?
- Crime grade is F in this area — have there been break-ins, vandalism, or insurance claims at this property in the last 3 years? What carrier currently insures it and at what premium?
- What's the average days-on-market for RENTAL listings here right now (not sales)? A rising rental-DOM trend means longer vacancies and softer asking-rent achievability than the comps imply.
- What's the recent tenant-quality profile in this submarket — average credit score on applications, eviction rate, late-payment / NSF rate, and stable-employment percentage? A property-management company in the area should have these aggregated.
- How much new for-sale + rental construction is in the pipeline within 1–3 miles? Heavy new supply typically softens prices + rents 12–24 months out; constrained supply supports both.
Investment metrics
- 1% rule
- 2.52% ✓
- Cap rate
- 22.29%
- Cash-on-cash
- 57.15%
- DSCR
- 3.54
- GRM
- 3.3
CMA / ARV
- ARV (median comp)
- $107,886
- List price
- $74,999
- Delta
- -30.48%
- Verdict
- UNDERPRICED
- Comps
- 20 within 1.0 mi
Show comp detail 6 sales within ~0.75 mi
| Address | Dist | Beds/Ba | Sqft | Sold | Price | $/sf | Match |
|---|---|---|---|---|---|---|---|
| 2024 Westerly Dr #96 | 0.13mi | 2/2.0 (-1) | 924 (0%) | 23mo | $109,500 | $119 | 70 |
| 2024 Westerly Dr #96 | 0.13mi | 2/2.0 (-1) | 924 (0%) | 23mo | $109,500 | $119 | 70 |
| 2005 Markey Way #16 | 0.20mi | 2/2.0 (-1) | 840 (-9%) | 3mo | $65,000 | $77 | 68 |
| 2009 Westerly Dr #79 | 0.14mi | 2/2.0 (-1) | 1,056 (+14%) | 11mo | $95,000 | $90 | 56 |
| 1550 20th Street West #55 | 0.38mi | 3/2.0 | 1,056 (+14%) | 4mo | $98,950 | $94 | 55 |
| 2421 Sierra Hwy #38 | 0.75mi | 3/2.0 | 960 (+4%) | 11mo | $59,475 | $62 | 50 |
Match score weights: distance 35% · size 25% · config 20% · recency 20%. Top-matched comps best support the ARV.
Projected returns pro-forma
2.4% appreciation · 3.0% rent growth · sell at horizon
- IRR
- 54.4%
- Equity multiple
- 3.98×
- Total profit
- $62,508
- Equity at exit
- $31,239
- IRR
- 54.6%
- Equity multiple
- 8.03×
- Total profit
- $147,543
- Equity at exit
- $46,295
Cash invested: $21,000 (down + closing). Projections, not guarantees.
Landlord ↔ Tenant lean methodology
- Overall (STATE)
- 18 Strongly Tenant-Friendly
- State California
- 18 Strongly Tenant-Friendly · D+13
- County
- — inherits STATE
- City
- — inherits STATE
ZIP-level market 93560
- Home prices YoY
- 0.6%
- Active inventory
- 458
- Price-to-rent
- 3.3×
Monthly cashflow live
- Estimated rent
- $1,887 medium interval (Pro) →
- Mortgage (P&I)
- −$393
- Tax from tax record
- −$66 /mo · $797/yr
- Insurance
- −$31
- Flood insurance flood zone
- −$125 /mo · $1,502/yr
- HOA
- −$0
- Vacancy / Maint / Mgmt
- −$396
- Net cashflow
- $875
Break-even live
UW: 25.0% down · 7.5% · 30yr · 1.5% tax · 5.0% vac · 8.0% maint · 8.0% mgmt
Financing live
Cash to close
- Down payment
- $18,750
- Closing costs
- $2,250
- Reserves months
- —
- Total cash needed
- —
Loan-product check · same deal, 3 products live
Conventional
25% down · 7.5% · 30yr
- Down + closing
- —
- Monthly P&I
- —
- Monthly cashflow
- —
- DSCR
- —
- Eligible?
- —
Personal DTI + credit; lowest rate.
DSCR
20% down · 8.5% · 30yr
- Down + closing
- —
- Monthly P&I
- —
- Monthly cashflow
- —
- DSCR
- —
- Eligible?
- —
No personal income docs; deal must DSCR.
Hard money
10% down · 12.0% · 12mo
- Down + closing
- —
- Monthly P&I
- —
- Monthly cashflow
- —
- DSCR
- —
- Eligible?
- —
Short-term bridge; refi at stabilization.
Rent comps 4 comps
| Address | Beds | Baths | Sqft | Rent | $/sqft | DOM | Units | Dist |
|---|---|---|---|---|---|---|---|---|
| 1933 Harvell St Rosamond, CA | 2.0 | 1.0 | 600 | $1,250 | $2.08 | 1d | 1 | 0.52mi |
| 2541 Diamond St Unit 3 Rosamond, CA | 2.0 | 1.0 | 700 | $1,200 | $1.71 | 1d | 1 | 0.84mi |
| 2821 Desert St Unit C Rosamond, CA | 2.0 | 1.0 | 975 | $1,795 | $1.84 | 1d | 1 | 1.03mi |
| 2776 Sycamore Ave Rosamond, CA | 2.0 | 1.0 | 800 | $1,175 | $1.47 | 2d | 1 | 1.20mi |
Listing history 23 events
-
2026-06-09status $74,999 Pending 62 DOM
-
2026-06-08days on market $74,999 Active 62 DOM
-
2026-06-07days on market $74,999 Active 61 DOM
-
2026-06-04days on market $74,999 Active 58 DOM
-
2026-06-03days on market $74,999 Active 57 DOM
-
2026-06-02days on market $74,999 Active 56 DOM
-
2026-06-01days on market $74,999 Active 55 DOM
-
2026-05-31days on market $74,999 Active 54 DOM
-
2026-04-25price $74,999 277-char remark
Show marketing remark (277 chars)
Beautiful 3bedroom 2bathroom mobile home in the expanding city of Rosamond for sale at an amazing price. With a huge storage unit, 3 car private parking, beautiful and private, white fence, and a designated laundry room. This one won't last long, be sure to schedule a showing!
-
2026-04-07$79,999 Active 277-char remark
Show marketing remark (277 chars)
Beautiful 3bedroom 2bathroom mobile home in the expanding city of Rosamond for sale at an amazing price. With a huge storage unit, 3 car private parking, beautiful and private, white fence, and a designated laundry room. This one won't last long, be sure to schedule a showing!
-
2024-11-14historical
-
2024-10-21price $79,900
-
2024-10-17price $84,900
-
2024-08-30price $99,000
-
2024-07-29$105,000 Active
-
2023-07-24soldstatus $65,000 Closed
-
2023-06-20status Pending
-
2023-06-08$65,000 Active
-
2023-01-09soldstatus $45,000 Closed
-
2022-12-09status Pending
-
2022-11-30status Active
-
2022-11-20status Pending
-
2022-11-11$47,000 Active
ⓘ Source: listings_history table (triggers on properties + properties_extension) + one-shot
backfill from property_details.listing_events for pre-trigger history.
Tax reassessment forecast CA · Resets to sale price
- Current annual tax
- $797 · $66/mo
- Projected year-2 tax
- $797 · $66/mo
- Expected delta
- $0/yr ($0/mo · 0.0%)
ⓘ Screening estimate from a state-policy table — verify with the county assessor before closing.
Climate risk First Street
- Flood 6/10 Major FEMA zone A · 76% chance over 30 yrs
- Wildfire 4/10 Moderate
- Heat 7/10 Severe 5 d/yr ≥101°F today · 14 d/yr by 30 yrs out
- Wind 1/10 Low
- Air quality 8/10 Severe 16 unhealthy d/yr today · 21 by 30 yrs out
Nearby sold comps map
Loading sold comps map…
Walkable amenities ~0.75 mi
Loading nearby amenities…
Taxation est. · year 1
- Rental income
- $22,648
- − Mortgage interest
- −$4,201
- − Property taxes
- −$797
- − Insurance
- −$1,877
- − Repairs & maintenance
- −$1,812
- − Management
- −$1,812
- − Depreciation
- −$2,182
- Taxable income
- $9,967
- Est. tax owed @ 24.0%
- −$2,392
- After-tax cash flow
- $8,106/yr
For passive investors: Depreciation is non-cash, so a rental often shows a tax loss while cash-flowing — sheltering income. Rental losses are passive: they offset passive income freely, and up to $25,000/yr can offset ordinary (W-2) income if you actively participate and your MAGI is under $100k (phasing out to $0 by $150k); unused losses carry forward. On sale, claimed depreciation is recaptured at up to 25%, and gains may owe capital-gains tax (a 1031 exchange can defer both). Figures are a year-1 estimate at your 24.0% rate — not tax advice; consult a CPA.
Schools (NCES district)
- District
- Southern Kern Unified
- NCES district ID
- 0637620
- Math proficiency
- 25% ▲ 7.00%
- Reading proficiency
- 25% ▼ -8.00%
- Median HH income
- $54,523
- Composite
- 22.5/100
- National rank
- #8093
- State rank
- #387 of 517 in CA
Livability — Rosamond
- Score
- 49/100
- State rank
- #1178
- US rank
- #25952
Category grades
Schools grade is shown separately in the Schools card above.
Census & demographics
- Census place
- Rosamond, CA
- County
- Kern County · 710,371 people
- City population
- 22,119
- Metro
- Bakersfield, CA
- Population (ZIP)
- 22,119
- Household income
- $77,431
- Rent vs Own
- Severe rent burden
- 425.0
Population outlook (Kern County) Hauer SSP2
- Today (2025)
- 947,286 people
- By 2030
- 978,984 · +3.3%
- By 2040
- 1,045,018 · +10.3%
- By 2050
- 1,105,232 · +16.7%
- By 2075
- 1,229,538 · +29.8%
- By 2100
- 1,238,059 · +30.7%
Race, ethnicity, and origin ACS 2023
- Neighborhood character
- Diverse neighborhood (Simpson 0.68)
- Race & ethnicity
- Hispanic / Latino 45% White 32% Two or more races 17% Black 13% Asian 3% Native American 1%
- Hispanic origin (detail)
- Mexican 35%
- Common ancestry
- Portuguese 2% Italian 2% Lithuanian 1%
- Foreign-born
- 13% · Canada
- Languages at home
- 68% English-only · Spanish 28% Other Indo-European 2% Other Asian/Pacific 1%
Political lean MEDSL · Kern
- 2024 margin
- Strong R (+21.1) · D 38.2% · R 59.3% · Other 2.5%
- 2008→2024 swing
- -3.3pp toward R · 2008: -17.8pp · 2024: -21.1pp
- All cycles
- 2024: R+21.1 2020: R+10.2 2016: R+15.0 2012: R+20.9 2008: R+17.8
Not yet ingested
- Civics
- —
Market trends
- HPI YoY
- ▲ 2.40%
- Current HPI
- 403.7206
- Rent YoY
- —
- Metro
- Bakersfield, CA
- State GDP YoY
- ▲ 3.21%
- F500 in state
- 116
Industry mix (Fortune 500 HQ in CA)
| Industry | F500 HQs | Revenue |
|---|---|---|
| Technology | 27 | $1,492B |
|
||
| Financial Services | 3 | $174B |
|
||
| Retail | 3 | $44B |
|
||
| Insurance | 3 | $26B |
|
||
| Media / Entertainment | 2 | $115B |
|
||
| Pharmaceuticals / Biotech | 2 | $62B |
|
||
Price history
+59.6% since first listed15 events — show timeline
- 2026-04-25 Price Changed $74,999 AVMLS
- 2026-04-07 Listed $79,999 AVMLS
- 2024-11-14 Listing Removed — CRMLS
- 2024-10-21 Price Changed $79,900 CRMLS
- 2024-10-17 Price Changed $84,900 CRMLS
- 2024-08-30 Price Changed $99,000 CRMLS
- 2024-07-29 Listed $105,000 CRMLS
- 2023-07-24 Sold (MLS) $65,000 AVMLS
- 2023-06-20 Pending — AVMLS
- 2023-06-08 Listed $65,000 AVMLS
- 2023-01-09 Sold (MLS) $45,000 AVMLS
- 2022-12-09 Pending — AVMLS
- 2022-11-30 Relisted — AVMLS
- 2022-11-20 Pending — AVMLS
- 2022-11-11 Listed $47,000 AVMLS
Property tax history
+15.5%/yrLatest (2025): $797 · +1175.0% YoY. Source: county tax records.
Cash-flow waterfall
monthlySold comps — $/sqft
last 12 mo · ≤1 miLoading sold comps…