 🏷️ Likely Rental
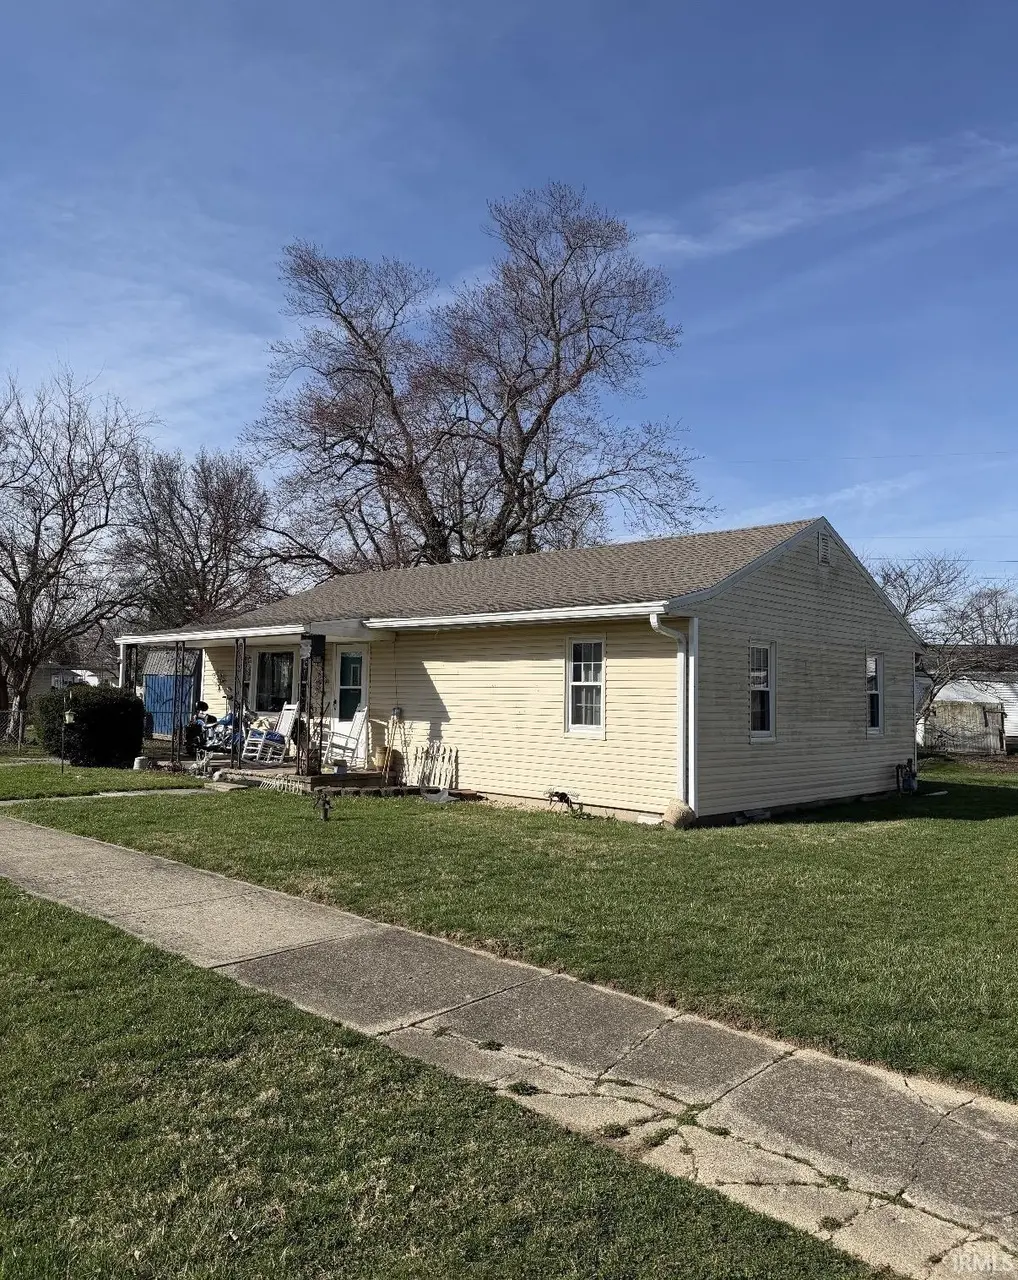
2803 S 23rd St · New Castle, IN
Flood risk 1/10 · Minimal
- FEMA flood zone
- X (unshaded)
- Chance of flooding over 30 yrs
- 0.0%
- Est. flood insurance / yr
- $507 – $1,088
Fire risk 1/10 · Minimal
- Est. fire insurance / yr
- $717 – $1,331
Heat risk 3/10 · Minor
- Hot days now (above 99°F)
- 7 days/yr
- Hot days in 30 yrs
- 18 days/yr
Wind risk 2/10 · Minimal
- Chance of severe wind over 30 yrs
- 1.0%
Air-quality risk 2/10 · Minimal
- Unhealthy air days now
- 1 days/yr
- Unhealthy air days in 30 yrs
- 2 days/yr
Risk factors via First Street. Map © Google.
Why this score? — see what drove the B- grade
The composite is a weighted blend of 9 inputs, each scored 0–100. Each bar is that input's sub-score; the figure is the points it added to the 100-point composite (weight × sub-score).
- Cash flow +25.2/30.0
- ARV discount +15.0/15.0
- DSCR +8.2/10.0
- 1% rule +6.1/10.0
- Livability +3.8/5.0
- Rent growth +3.6/5.0
- Schools +2.7/10.0
- Condition / age +2.5/5.0
- Appreciation +0.0/10.0
$84,500
🖨 Deal sheet 📄 Offer letter ✓ Due diligence
Listing remarks
Tenant occupied investment opportunity. Featuring 2 bedrooms, 1 bathroom, and approximately 960 sqft. Currently rented with an in-place tenant, offering immediate income for an investor looking for a straightforward addition to their portfolio. Located in an established area with consistent rental demand. Do not disturb tenant.
Key facts
- 4,879 sq ft lot
- Built 1954
- Listed 15 days
Property features AI
Exterior
- Utilities: Public water; Public sewer
- Home design: Single-family, site-built home; Single-story
- Construction: Vinyl siding construction
- Exterior features: Vinyl siding; Lot in a Sunny Side / Sunnyside subdivision
Interior
- Bathrooms: One full bathroom (main level)
- Heating & cooling: Central air conditioning; Natural gas heating
- Interior features: Crawl space basement; Total of 5 rooms
- Laundry & utility: Laundry on the main level
Neighborhood map
What this means for you Summary
Snapshot
- This is a 2-bed/1.0-bath single-family listed at $84k.
Deal economics
- At list price, monthly cash flow is $188 ($2k/yr) — positive.
- The deal already cash-flows at list — no discount required.
- Meets the 1% rule at list price ($935 rent vs $84k).
- Recommended offer: $83k (1.5% below list) — sets the bar for market timing.
- Cap rate 9.0% vs local median 4.8% in New Castle — top-decile yield for the area; either an underpriced asset or a hidden risk that comps aren't pricing in. Stress-test before assuming the spread holds.
Location & tenants
- Location reads 75/100 on livability (#64 in IN, #4,219 nationally) — a middle-class / working-renter tenant base. Strengths: crime A+, cost of living A+, housing A+; Watch: amenities F, commute F, employment D-.
- New Castle Community School Corporation (town): math 30% / reading 35% proficiency, ranked #229 of 301 in IN (top 76%) — families likely to look elsewhere, expect single-tenant / working-renter base with shorter leases.
- Zoned schools: Eastwood Elementary School (math 32% / reading 27%, grade F, #697 of 994 statewide, top 73%, 274 students, 82% FRL); New Castle Middle School (math 20% / reading 31%, grade F, #243 of 330 statewide, top 74%, 666 students, 61% FRL); New Castle High School (math 27% / reading 52%, grade F, #221 of 369 statewide, top 63%, 836 students, 56% FRL).
- Market conditions: Rents rising fast (+4.6%/yr); 214 active listings in the ZIP; 4 comparable units currently listed for rent nearby; rentals leasing fast (median 12d on market — plan ~1-2 weeks tenant-placement turnaround); 47 units permitted in Henry County in 2024 (0 in 5+ unit buildings).
Forward outlook
- Local home prices are declining (-3.0%/yr); year-one equity from $584 of loan paydown is wiped out by about $3k of value loss. Plan a longer hold.
- Henry County population projected at -12% by 2050 — secular population decline; favor cash flow + early exit over multi-decade hold.
- At projected returns (-3.0% appreciation + 4.6% rent growth), your $24k cash investment doubles in ~10 years — after that, you're playing with house money.
Negotiation context
- It's been on market 15 days — a 2% lower offer ($83k) is reasonable based on typical stale-listing flexibility.
- 3 sale attempts since 5y ago with the ask held roughly flat each time — persistent listings suggest the price (not the market) is what's stuck; bring a comps-based counter.
Risks & watch-outs
- Watch-outs: built in 1954 — expect roof / HVAC / electrical / plumbing capex.
Questions for the listing agent
- Built in 1954 — when were the roof, HVAC, electrical panel, plumbing, and water heater last replaced?
- Is there a deadline driving the sale (1031 exchange, divorce, estate, relocation)? That informs how much negotiation room exists.
- Schools are D-rated, which usually means shorter tenancies and higher turnover. Who's the typical renter profile here, and what's been the actual vacancy rate?
- What's the average days-on-market for RENTAL listings here right now (not sales)? A rising rental-DOM trend means longer vacancies and softer asking-rent achievability than the comps imply.
- What's the recent tenant-quality profile in this submarket — average credit score on applications, eviction rate, late-payment / NSF rate, and stable-employment percentage? A property-management company in the area should have these aggregated.
- How much new for-sale + rental construction is in the pipeline within 1–3 miles? Heavy new supply typically softens prices + rents 12–24 months out; constrained supply supports both.
Investment metrics
- 1% rule
- 1.11% ✓
- Cap rate
- 8.97%
- Cash-on-cash
- 9.55%
- DSCR
- 1.42
- GRM
- 7.5
CMA / ARV
- ARV (median comp)
- $136,382
- List price
- $84,500
- Delta
- -38.04%
- Verdict
- UNDERPRICED
- Comps
- 20 within 1.0 mi
Show comp detail 12 sales within ~0.75 mi
| Address | Dist | Beds/Ba | Sqft | Sold | Price | $/sf | Match |
|---|---|---|---|---|---|---|---|
| 2803 S 23rd St | 0.00mi | 2/1.0 | 960 (0%) | 1mo | $75,000 | $78 | 99 |
| 2922 Sunnyside Ave | 0.16mi | 2/1.0 | 980 (+2%) | 7mo | $70,000 | $71 | 83 |
| 2906 S 14th St | 0.21mi | 3/1.0 (+1) | 968 (+1%) | 8mo | $150,000 | $155 | 77 |
| 1614 P Ave | 0.50mi | 2/1.0 | 960 (0%) | 2mo | $119,000 | $124 | 75 |
| 2114 S 18th St | 0.47mi | 2/1.0 | 912 (-5%) | 3mo | $50,000 | $55 | 67 |
| 1929 N Ave | 0.41mi | 3/1.5 (+1) | 936 (-2%) | 4mo | $89,900 | $96 | 66 |
| 1631 P Ave | 0.44mi | 2/1.0 | 904 (-6%) | 4mo | $106,000 | $117 | 66 |
| 2102 S 18th St | 0.48mi | 2/1.0 | 988 (+3%) | 9mo | $99,900 | $101 | 66 |
| 1909 Cherrywood Ave | 0.68mi | 2/1.0 | 922 (-4%) | 6mo | $147,500 | $160 | 56 |
| 1725 Hunter Ave | 0.67mi | 3/1.0 (+1) | 1,007 (+5%) | 1mo | $110,000 | $109 | 55 |
| 2117 Cherrywood Ave | 0.60mi | 2/1.0 | 1,088 (+13%) | 6mo | $112,000 | $103 | 45 |
| 2105 Cherrywood Ave | 0.61mi | 2/1.0 | 1,080 (+12%) | 8mo | $145,000 | $134 | 44 |
Match score weights: distance 35% · size 25% · config 20% · recency 20%. Top-matched comps best support the ARV.
Projected returns pro-forma
-3.0% appreciation · 4.59% rent growth · sell at horizon
- IRR
- -0.2%
- Equity multiple
- 0.99×
- Total profit
- $-187
- Equity at exit
- $12,599
- IRR
- 11.0%
- Equity multiple
- 1.92×
- Total profit
- $21,693
- Equity at exit
- $7,306
Cash invested: $23,660 (down + closing). Projections, not guarantees.
Landlord ↔ Tenant lean methodology
- Overall (STATE)
- 90 Strongly Landlord-Friendly
- State Indiana
- 90 Strongly Landlord-Friendly · R+11
- County
- — inherits STATE
- City
- — inherits STATE
ZIP-level market 47362
- Home prices YoY
- -16.0%
- Rents YoY
- 4.6%
- Active inventory
- 214
- Price-to-rent
- 7.5×
Monthly cashflow live
- Estimated rent
- $935 medium interval (Pro) →
- Mortgage (P&I)
- −$443
- Tax from tax record
- −$72 /mo · $864/yr
- Insurance
- −$35
- HOA
- −$0
- Vacancy / Maint / Mgmt
- −$196
- Net cashflow
- $188
Break-even live
UW: 25.0% down · 7.5% · 30yr · 1.5% tax · 5.0% vac · 8.0% maint · 8.0% mgmt
Financing live
Cash to close
- Down payment
- $21,125
- Closing costs
- $2,535
- Reserves months
- —
- Total cash needed
- —
Loan-product check · same deal, 3 products live
Conventional
25% down · 7.5% · 30yr
- Down + closing
- —
- Monthly P&I
- —
- Monthly cashflow
- —
- DSCR
- —
- Eligible?
- —
Personal DTI + credit; lowest rate.
DSCR
20% down · 8.5% · 30yr
- Down + closing
- —
- Monthly P&I
- —
- Monthly cashflow
- —
- DSCR
- —
- Eligible?
- —
No personal income docs; deal must DSCR.
Hard money
10% down · 12.0% · 12mo
- Down + closing
- —
- Monthly P&I
- —
- Monthly cashflow
- —
- DSCR
- —
- Eligible?
- —
Short-term bridge; refi at stabilization.
Rent comps 4 comps
| Address | Beds | Baths | Sqft | Rent | $/sqft | DOM | Units | Dist |
|---|---|---|---|---|---|---|---|---|
| 1618 P Ave New Castle, IN | 3.0 | 1.5 | 1064 | $950 | $0.89 | 1d | 1 | 0.50mi |
| 1216 S 19th St New Castle, IN | 2.0 | 1.0 | 824 | $1,000 | $1.21 | 23d | 1 | 0.93mi |
| 940 S 15th St New Castle, IN | 1.0–2.0 | 1.0–1.5 | 816 | $1,075 | $1.32 | 1d | 2 | 1.17mi |
| 701 S 14th St Unit 4A New Castle, IN | 1.0 | 1.0 | 600 | $615 | $1.02 | 12d | 1 | 1.41mi |
Listing history 5 events
-
2026-05-18status Pending 329-char remark
-
2026-05-04$84,500 Active 329-char remark
-
2021-08-24historical
-
2021-07-29$84,500
-
2021-07-29$84,500
ⓘ Source: listings_history table (triggers on properties + properties_extension) + one-shot
backfill from property_details.listing_events for pre-trigger history.
Tax reassessment forecast IN · Partial reset (capped growth)
- Current annual tax
- $864 · $72/mo
- Projected year-2 tax
- $864 · $72/mo
- Expected delta
- $0/yr ($0/mo · 0.0%)
ⓘ Screening estimate from a state-policy table — verify with the county assessor before closing.
Climate risk First Street
- Flood 1/10 Low FEMA zone X (unshaded) · 0% chance over 30 yrs
- Wildfire 1/10 Low
- Heat 3/10 Moderate 7 d/yr ≥99°F today · 18 d/yr by 30 yrs out
- Wind 2/10 Low 100% chance of damaging wind over 30 yrs
- Air quality 2/10 Low 1 unhealthy d/yr today · 2 by 30 yrs out
Nearby sold comps map
Loading sold comps map…
Walkable amenities ~0.75 mi
Loading nearby amenities…
Taxation est. · year 1
- Rental income
- $11,220
- − Mortgage interest
- −$4,733
- − Property taxes
- −$864
- − Insurance
- −$422
- − Repairs & maintenance
- −$898
- − Management
- −$898
- − Depreciation
- −$2,458
- Taxable income
- $947
- Est. tax owed @ 24.0%
- −$227
- After-tax cash flow
- $2,032/yr
For passive investors: Depreciation is non-cash, so a rental often shows a tax loss while cash-flowing — sheltering income. Rental losses are passive: they offset passive income freely, and up to $25,000/yr can offset ordinary (W-2) income if you actively participate and your MAGI is under $100k (phasing out to $0 by $150k); unused losses carry forward. On sale, claimed depreciation is recaptured at up to 25%, and gains may owe capital-gains tax (a 1031 exchange can defer both). Figures are a year-1 estimate at your 24.0% rate — not tax advice; consult a CPA.
Schools (NCES district)
- District
- New Castle Community School Corporation
- NCES district ID
- 1807440
- Math proficiency
- 30% ▼ -13.00%
- Reading proficiency
- 35% ▼ -9.00%
- Median HH income
- $36,717
- Composite
- 26.99/100
- National rank
- #7067
- State rank
- #229 of 301 in IN
Livability — New Castle
- Score
- 75/100
- State rank
- #64
- US rank
- #4219
Category grades
Schools grade is shown separately in the Schools card above.
Census & demographics
- Census place
- New Castle, IN
- County
- Henry County · 29,337 people
- City population
- 29,337
- Metro
- New Castle, IN
- Population (ZIP)
- 29,337
- Household income
- $60,258
- Rent vs Own
- Severe rent burden
- 545.0
Population outlook (Henry County) Hauer SSP2
- Today (2025)
- 48,028 people
- By 2030
- 47,125 · -1.9%
- By 2040
- 44,820 · -6.7%
- By 2050
- 42,207 · -12.1%
- By 2075
- 35,814 · -25.4%
- By 2100
- 26,779 · -44.2%
Race, ethnicity, and origin ACS 2023
- Neighborhood character
- Predominantly White (90%)
- Race & ethnicity
- White 90% Two or more races 3% Black 3% Hispanic / Latino 3%
- Common ancestry
- Italian 2% Slovak 1% Lithuanian 1%
- Foreign-born
- 2% · Canada
- Languages at home
- 97% English-only · Spanish 2%
Political lean MEDSL · Henry
- 2024 margin
- Solid R (+47.7) · D 25.3% · R 73.0% · Other 1.7%
- 2008→2024 swing
- -43.8pp toward R · 2008: -3.9pp · 2024: -47.7pp
- All cycles
- 2024: R+47.7 2020: R+45.2 2016: R+43.7 2012: R+17.0 2008: R+3.9
Not yet ingested
- Civics
- —
Market trends
- HPI YoY
- ▼ -43.70%
- Current HPI
- 228.8885
- Rent YoY
- ▲ 4.59%
- Metro
- New Castle, IN
- State GDP YoY
- ▲ 2.90%
- F500 in state
- 18
Industry mix (Fortune 500 HQ in IN)
| Industry | F500 HQs | Revenue |
|---|---|---|
| Industrial Machinery | 2 | $37B |
|
||
| Healthcare | 1 | $177B |
|
||
| Pharmaceuticals | 1 | $45B |
|
||
| Metals / Steel | 1 | $18B |
|
||
| Agriculture | 1 | $17B |
|
||
| Packaging | 1 | $12B |
|
||
Price history
-11.2% since first listed6 events — show timeline
- 2026-05-22 Sold (MLS) $75,000 IRMLS
- 2026-05-18 Pending — IRMLS
- 2026-05-04 Listed $84,500 IRMLS
- 2021-08-24 Listing Removed — MIBOR as Distributed by MLS Grid
- 2021-07-29 Listed $84,500 MIBOR as Distributed by MLS Grid
- 2021-07-29 Listed $84,500 IRMLS
Property tax history
-3.0%/yrLatest (2024): $864 · +4.3% YoY. Source: county tax records.
Cash-flow waterfall
monthlySold comps — $/sqft
last 12 mo · ≤1 miLoading sold comps…