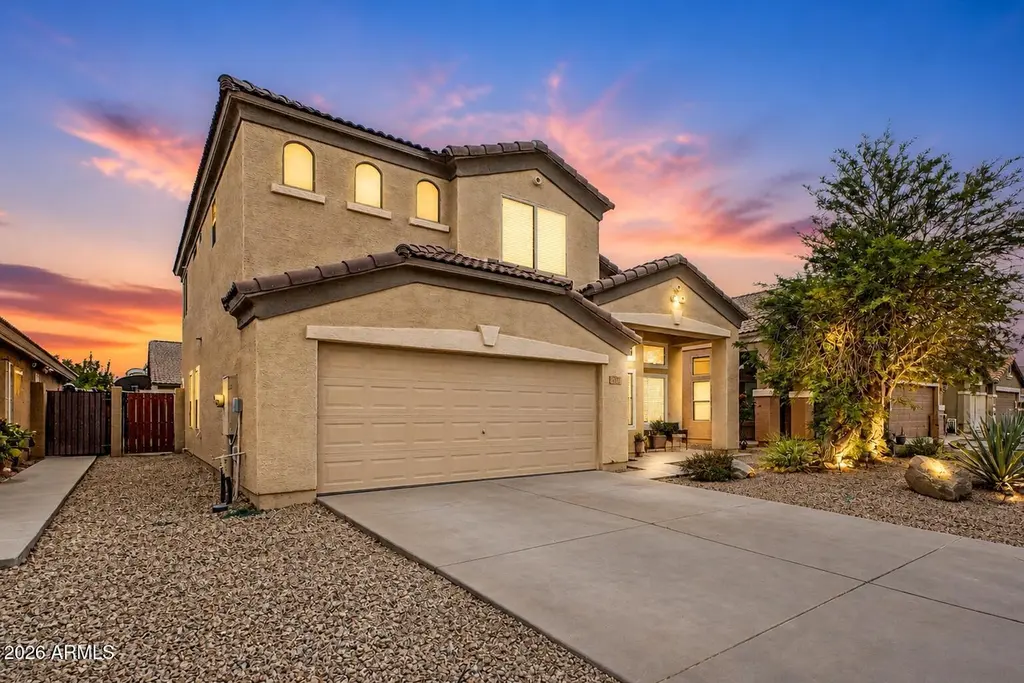
1921 W Vineyard Plains Dr · San Tan Valley, AZ
Flood risk 1/10 · Minimal
- FEMA flood zone
- X (unshaded)
- Chance of flooding over 30 yrs
- 0.0%
- Est. flood insurance / yr
- $507 – $1,088
Fire risk 6/10 · Moderate
- Est. fire insurance / yr
- $610 – $1,132
Heat risk 9/10 · Severe
- Hot days now (above 111°F)
- 7 days/yr
- Hot days in 30 yrs
- 18 days/yr
Wind risk 1/10 · Minimal
- Chance of severe wind over 30 yrs
- —
Air-quality risk 2/10 · Minimal
- Unhealthy air days now
- 1 days/yr
- Unhealthy air days in 30 yrs
- 1 days/yr
Risk factors via First Street. Map © Google.
Why this score? — see what drove the D grade
The composite is a weighted blend of 9 inputs, each scored 0–100. Each bar is that input's sub-score; the figure is the points it added to the 100-point composite (weight × sub-score).
- ARV discount +13.5/15.0
- Appreciation +10.0/10.0
- Cash flow +6.2/30.0
- Livability +2.7/5.0
- Rent growth +2.5/5.0
- Condition / age +2.5/5.0
- Schools +1.8/10.0
- 1% rule +0.6/10.0
- DSCR +0.5/10.0
$369,799
🖨 Deal sheet 📄 Offer letter ✓ Due diligence
Listing remarks MLS
3 BDRM + LOFT, 2.5 BATH, 2,199 SQ. FT. HOME. VAULTED CEILINGS, APPLIANCES, OAK CABINETS, PANTRY & ISLAND IN KITCHEN, NEUTRAL COLORS THROUGHOUT, TILE IN ALL THE RIGHT PLACES. FRONT LANDSCAPING IS INCLUDED. PLENTY OF ROOM IN BACK FOR POOL & SPA. MASTER BEDROOM SPLIT WITH ALL BEDROOMS UPSTAIRS + LOFT. VIRGO MODEL #3, MONTALBANO HOMES. NEAR NICELY LANDSCAPED GREENBELT IN SUBDIVISION. LOCATED IN A FAST GROWING AREA OF QUEEN CREEK. DON'T MISS OUT ON THIS ONE. BUY NOW & MOVE IN! NO NEED TO BE WAITING FOR THE BUILDERS.
Key facts
- Wood look flooring
- Mosaic backsplash
- Covered patio
Tags
Property features AI
Finance
- HOA & community: Homeowners association with a $76 monthly fee; HOA fee includes grounds maintenance
Exterior
- Parking: 2 covered parking spaces; 2-car garage
- Utilities: Public sewer; Private water company
- Home design: Single-family residence; Fee simple ownership
- Construction: Stucco and wood-frame construction; Tile roof
- Exterior features: Block fencing; Sprinklers in front yard; Natural desert landscaping in back yard; City-maintained road; Mountain views
Interior
- Kitchen: Kitchen island; Laminate countertops; Pantry
- Bedrooms: Up to 4 possible bedrooms
- Flooring: Carpet; Tile
- Bathrooms: 2 full bathrooms; 1 half bathroom
- Heating & cooling: Electric heating; Central air conditioning
- Interior features: High-speed internet; Double vanities; Upstairs living area; Eat-in kitchen; Vaulted ceilings; Kitchen island; Pantry; Full bathroom in primary bedroom; Laminate counters; Dual-pane windows; Bath lever faucets
- Laundry & utility: Inside laundry; Washer/dryer hookup only
Neighborhood map
What this means for you Summary
Snapshot
- This is a 3-bed/2.5-bath single-family listed at $370k.
Deal economics
- At list price, monthly cash flow is $-677 ($-8k/yr) — negative.
- To cash-flow at today's rent, offer at most $250k (32.3% below list).
- To meet the 1% rule (rent ≥ 1% of price), the offer needs to be $205k (44.5% below list).
- Recommended offer: $205k (44.5% below list) — sets the bar for 1% rule.
- Cap rate 4.1% vs local median 3.2% in San Tan Valley — meaningfully above typical; check what's discounted (condition, days-on-market, listing class) to confirm the premium yield is real.
Location & tenants
- Location reads 54/100 on livability (#282 in AZ) — a working-class tenant base; expect higher turnover. Strengths: housing A+, employment B+; Watch: crime D+, amenities F, commute F.
- Florence Unified School District (4437) (rural): math 16% / reading 24% proficiency, ranked #178 of 249 in AZ (top 72%) — low school quality limits family demand, transient renter base, plan for 1-2y turnover.
- Zoned schools: San Tan Heights Elementary (math 15% / reading 20%, grade F, #803 of 1,109 statewide, top 73%, 668 students, 55% FRL); San Tan Foothills High School (math 12% / reading 17%, grade F, #267 of 381 statewide, top 72%, 824 students, 41% FRL) — zoned schools at 48% FRL track the district average.
- Market conditions: 475 active listings in the ZIP; 40 comparable units currently listed for rent nearby; rentals at typical pace (median 18d on market — plan ~3-4 weeks tenant-placement turnaround); 9,504 units permitted in Pinal County in 2024 (776 in 5+ unit buildings).
Forward outlook
- In year one you build about $40k of equity ($3k loan paydown + $37k appreciation (10.0% local appreciation)).
- By year 2, paydown + projected appreciation supports a ~$64k cash-out refi (75% LTV) — recoverable capital for the next deal without selling this one.
Negotiation context
- It's been on market 44 days — a 3% lower offer ($359k) is reasonable based on typical stale-listing flexibility.
- 6 sale attempts since 21y ago with the ask held roughly flat each time — persistent listings suggest the price (not the market) is what's stuck; bring a comps-based counter.
- Current owner paid $84k; list at $370k implies a 340% gain — meaningful room to come down on a strong offer.
Risks & watch-outs
- Climate carrying-cost: major wildfire risk; extreme-heat days projected 7→18/yr by 2055 (HVAC capex compounding) — expect insurance premiums to compound above CPI over the hold.
Questions for the listing agent
- What do current leases actually rent for vs. the listed asking? Can we see a recent rent roll and the last 12 months of T-12 income?
- It's been on market 44 days. Have you received any prior offers? Is the seller open to a 44% concession, seller financing, or rate buy-down credit?
- What does the HOA fee cover, when was the last increase, and are there any pending special assessments or reserve-fund shortfalls?
- Is there a deadline driving the sale (1031 exchange, divorce, estate, relocation)? That informs how much negotiation room exists.
- Schools are D-rated, which usually means shorter tenancies and higher turnover. Who's the typical renter profile here, and what's been the actual vacancy rate?
- Crime grade is D in this area — have there been break-ins, vandalism, or insurance claims at this property in the last 3 years? What carrier currently insures it and at what premium?
- The area grade is low — what's the realistic commute time and amenity access for the typical tenant pool here? Any planned neighborhood developments (good or bad) we should know about?
- What's the average days-on-market for RENTAL listings here right now (not sales)? A rising rental-DOM trend means longer vacancies and softer asking-rent achievability than the comps imply.
- What's the recent tenant-quality profile in this submarket — average credit score on applications, eviction rate, late-payment / NSF rate, and stable-employment percentage? A property-management company in the area should have these aggregated.
- How much new for-sale + rental construction is in the pipeline within 1–3 miles? Heavy new supply typically softens prices + rents 12–24 months out; constrained supply supports both.
Investment metrics
- 1% rule
- 0.56% ✗
- Cap rate
- 4.10%
- Cash-on-cash
- -7.84%
- DSCR
- 0.65
- GRM
- 15.0
CMA / ARV
- ARV (median comp)
- $426,799
- List price
- $369,799
- Delta
- -13.36%
- Verdict
- UNDERPRICED
- Comps
- 20 within 1.0 mi
Show comp detail 12 sales within ~0.75 mi
| Address | Dist | Beds/Ba | Sqft | Sold | Price | $/sf | Match |
|---|---|---|---|---|---|---|---|
| 33656 N Windmill Run | 0.28mi | 3/2.5 | 2,280 (+5%) | 0mo | $440,000 | $193 | 78 |
| 1831 W Desert Seasons Dr | 0.35mi | 4/2.5 (+1) | 2,321 (+7%) | 0mo | $337,500 | $145 | 67 |
| 2015 W Olivia Dr | 0.25mi | 3/2.0 | 1,887 (-13%) | 2mo | $422,500 | $224 | 63 |
| 2330 W Hayden Peak Dr | 0.45mi | 4/2.5 (+1) | 2,011 (-7%) | 0mo | $338,000 | $168 | 62 |
| 2828 W Patagonia Ct | 0.68mi | 3/3.0 | 2,230 (+3%) | 3mo | $406,601 | $182 | 59 |
| 2408 W Allens Peak Dr | 0.51mi | 4/2.5 (+1) | 2,011 (-7%) | 2mo | $380,000 | $189 | 57 |
| 2391 W Allens Peak Dr | 0.53mi | 4/2.5 (+1) | 2,010 (-7%) | 2mo | $355,000 | $177 | 56 |
| 2057 W Gila Butte Dr | 0.62mi | 4/3.0 (+1) | 2,318 (+7%) | 0mo | $570,000 | $246 | 52 |
| 2665 W Silver Creek Ln | 0.53mi | 4/2.0 (+1) | 1,929 (-11%) | 2mo | $350,000 | $181 | 48 |
| 688 W Green Tree Dr | 0.73mi | 4/2.0 (+1) | 2,020 (-7%) | 1mo | $364,900 | $181 | 47 |
| 867 W Desert Glen Dr | 0.63mi | 4/2.5 (+1) | 2,409 (+11%) | 1mo | $457,000 | $190 | 46 |
| 951 W Fruit Tree Ln | 0.65mi | 4/2.5 (+1) | 2,443 (+13%) | 4mo | $390,000 | $160 | 41 |
Match score weights: distance 35% · size 25% · config 20% · recency 20%. Top-matched comps best support the ARV.
Projected returns pro-forma
10.0% appreciation · 3.0% rent growth · sell at horizon
- IRR
- 18.7%
- Equity multiple
- 2.53×
- Total profit
- $158,182
- Equity at exit
- $333,144
- IRR
- 17.4%
- Equity multiple
- 5.82×
- Total profit
- $499,456
- Equity at exit
- $718,438
Cash invested: $103,544 (down + closing). Projections, not guarantees.
Landlord ↔ Tenant lean methodology
- Overall (STATE)
- 87 Strongly Landlord-Friendly
- State Arizona
- 87 Strongly Landlord-Friendly · R+3
- County
- — inherits STATE
- City
- — inherits STATE
ZIP-level market 85144
- Home prices YoY
- 7.2%
- Active inventory
- 475
- Price-to-rent
- 15.0×
Monthly cashflow live
- Estimated rent
- $2,054 high interval (Pro) →
- Mortgage (P&I)
- −$1,939
- Tax from tax record
- −$130 /mo · $1,557/yr
- Insurance
- −$154
- HOA
- −$76
- Vacancy / Maint / Mgmt
- −$431
- Net cashflow
- $-677
Break-even live
UW: 25.0% down · 7.5% · 30yr · 1.5% tax · 5.0% vac · 8.0% maint · 8.0% mgmt
Financing live
Cash to close
- Down payment
- $92,450
- Closing costs
- $11,094
- Reserves months
- —
- Total cash needed
- —
Loan-product check · same deal, 3 products live
Conventional
25% down · 7.5% · 30yr
- Down + closing
- —
- Monthly P&I
- —
- Monthly cashflow
- —
- DSCR
- —
- Eligible?
- —
Personal DTI + credit; lowest rate.
DSCR
20% down · 8.5% · 30yr
- Down + closing
- —
- Monthly P&I
- —
- Monthly cashflow
- —
- DSCR
- —
- Eligible?
- —
No personal income docs; deal must DSCR.
Hard money
10% down · 12.0% · 12mo
- Down + closing
- —
- Monthly P&I
- —
- Monthly cashflow
- —
- DSCR
- —
- Eligible?
- —
Short-term bridge; refi at stabilization.
Rent comps 40 comps
| Address | Beds | Baths | Sqft | Rent | $/sqft | DOM | Units | Dist |
|---|---|---|---|---|---|---|---|---|
| 1868 W Desert Seasons Dr San Tan Valley, AZ | 4.0 | 2.0 | 1678 | $1,950 | $1.16 | 20d | 1 | 0.33mi |
| 1814 W Desert Hills Dr San Tan Valley, AZ | 4.0 | 2.0 | 1541 | $1,895 | $1.23 | 43d | 1 | 0.34mi |
| 1847 W Desert Seasons Dr San Tan Valley, AZ | 4.0 | 2.0 | 1679 | $1,695 | $1.01 | 22d | 1 | 0.37mi |
| 1818 W Desert Seasons Dr San Tan Valley, AZ | 4.0 | 2.5 | 2321 | $2,090 | $0.90 | 15d | 1 | 0.37mi |
| 1817 W Desert Seasons Dr San Tan Valley, AZ | 4.0 | 2.5 | 2470 | $1,207 | $0.49 | 20d | 1 | 0.39mi |
| 1168 W Desert Basin Dr San Tan Valley, AZ | 4.0 | 3.0 | 2049 | $1,971 | $0.96 | 43d | 1 | 0.44mi |
| 34437 N Picket Post Dr San Tan Valley, AZ | 4.0 | 3.0 | 1507 | $1,650 | $1.09 | 43d | 1 | 0.45mi |
| 1177 W Desert Glen Dr San Tan Valley, AZ | 4.0 | 2.0 | 1988 | $2,100 | $1.06 | 43d | 1 | 0.45mi |
| 2049 W Gold Mine Way San Tan Valley, AZ | 4.0 | 2.0 | 1585 | $2,085 | $1.32 | 5d | 1 | 0.46mi |
| 33412 N Windmill Run San Tan Valley, AZ | 3.0 | 2.5 | 2764 | $2,595 | $0.94 | 5d | 1 | 0.47mi |
| 2053 W Hayden Peak Dr San Tan Valley, AZ | 4.0 | 3.0 | 1914 | $2,045 | $1.07 | 2d | 1 | 0.49mi |
| 1154 W Oak Tree Ln San Tan Valley, AZ | 4.0 | 2.0 | 1650 | $1,895 | $1.15 | 43d | 1 | 0.51mi |
| 1042 W Desert Basin Dr San Tan Valley, AZ | 4.0 | 2.5 | 2343 | $1,900 | $0.81 | 12d | 1 | 0.51mi |
| 2699 W Camp River Rd San Tan Valley, AZ | 3.0 | 2.0 | 1766 | $1,975 | $1.12 | 43d | 1 | 0.51mi |
| 33082 N Cat Hills Ave San Tan Valley, AZ | 3.0 | 2.0 | 1704 | $1,795 | $1.05 | 18d | 1 | 0.53mi |
| 33082 N Cat Hills Ave San Tan Valley, AZ | 3.0 | 2.0 | 1703 | $1,695 | $1.00 | 5d | 1 | 0.53mi |
| 2029 W Allens Peak Dr San Tan Valley, AZ | 4.0 | 2.0 | 1685 | $1,980 | $1.18 | 2d | 1 | 0.54mi |
| 1238 W Dana Dr San Tan Valley, AZ | 4.0 | 2.0 | 1910 | $2,150 | $1.13 | 24d | 1 | 0.55mi |
| 33053 N North Butte Dr San Tan Valley, AZ | 4.0 | 2.0 | 1520 | $1,985 | $1.31 | 3d | 1 | 0.56mi |
| 2460 W Tanner Ranch Rd San Tan Valley, AZ | 4.0 | 2.0 | 1520 | $1,980 | $1.30 | 2d | 1 | 0.58mi |
| 33856 N Cherry Creek Rd San Tan Valley, AZ | 3.0 | 2.0 | 1928 | $1,850 | $0.96 | 43d | 1 | 0.58mi |
| 1277 W Busa Dr San Tan Valley, AZ | 4.0 | 2.0 | 2136 | $4,000 | $1.87 | 5d | 1 | 0.58mi |
| 1151 W Dana Dr San Tan Valley, AZ | 4.0 | 2.0 | 1909 | $2,399 | $1.26 | 24d | 1 | 0.59mi |
| 33897 N Wash View Rd San Tan Valley, AZ | 3.0 | 2.0 | 1721 | $1,980 | $1.15 | 2d | 1 | 0.61mi |
| 2828 Patagonia Ct Queen Creek, AZ | 3.0 | 2.5 | 2230 | $2,500 | $1.12 | 43d | 1 | 0.65mi |
| 2924 W Allens Peak Dr San Tan Valley, AZ | 3.0 | 2.0 | 1765 | $1,880 | $1.07 | 2d | 1 | 0.69mi |
| 2924 W Allens Peak Dr San Tan Valley, AZ | 3.0 | 2.0 | 1765 | $1,955 | $1.11 | 11d | 1 | 0.69mi |
| 3047 W Dancer Ln San Tan Valley, AZ | 3.0 | 2.0 | 1454 | $1,915 | $1.32 | 43d | 1 | 0.69mi |
| 797 W Agrarian Hills Dr San Tan Valley, AZ | 4.0 | 2.0 | 2020 | $2,025 | $1.00 | 24d | 1 | 0.71mi |
| 3102 W Belle Ave San Tan Valley, AZ | 4.0 | 2.0 | 1909 | $1,900 | $1.00 | 15d | 1 | 0.72mi |
| 3102 W Belle Ave San Tan Valley, AZ | 4.0 | 2.0 | 1909 | $1,900 | $1.00 | 12d | 1 | 0.72mi |
| 819 W Dana Dr San Tan Valley, AZ | 4.0 | 3.0 | 2066 | $1,909 | $0.92 | 43d | 1 | 0.78mi |
| 3194 W Yellow Peak Dr San Tan Valley, AZ | 4.0 | 2.0 | 1925 | $1,908 | $0.99 | 43d | 1 | 0.78mi |
| 880 W Busa Dr San Tan Valley, AZ | 3.0 | 2.5 | 1905 | $1,869 | $0.98 | 15d | 1 | 0.80mi |
| 880 W Busa Dr San Tan Valley, AZ | 3.0 | 2.5 | 1905 | $1,869 | $0.98 | 16d | 1 | 0.80mi |
| 2060 W Goldmine Mountain Dr San Tan Valley, AZ | 4.0 | 2.0 | 1869 | $2,181 | $1.17 | 24d | 1 | 0.81mi |
| 900 W Desert Canyon Dr San Tan Valley, AZ | 4.0 | 2.0 | 1614 | $1,955 | $1.21 | 24d | 1 | 0.84mi |
| 2005 W Aston Dr San Tan Valley, AZ | 4.0 | 1.5 | 2554 | $2,350 | $0.92 | 5d | 1 | 0.84mi |
| 2125 W Goldmine Mountain Dr Unit 1546392P San Tan Valley, AZ | 3.0 | 2.0 | 1593 | $3,899 | $2.45 | 12d | 1 | 0.85mi |
| 2899 W White Canyon Rd San Tan Valley, AZ | 3.0 | 2.0 | 1981 | $1,950 | $0.98 | 2d | 1 | 0.85mi |
HOA detail
- Monthly dues
- $76 · $912/yr
- Likely covers
- landscapingpool
Listing history 32 events
-
2026-06-18days on market $369,799 Active 44 DOM
-
2026-06-17days on market $369,799 Active 43 DOM
-
2026-06-16days on market $369,799 Active 42 DOM
-
2026-06-15days on market $369,799 Active 41 DOM
-
2026-06-13days on market $369,799 Active 39 DOM
-
2026-06-13days on market $369,799 Active 38 DOM
-
2026-06-09days on market $369,799 Active 35 DOM
-
2026-06-08days on market $369,799 Active 34 DOM
-
2026-06-07days on market $369,799 Active 33 DOM
-
2026-06-04days on market $369,799 Active 30 DOM
-
2026-06-03days on market $369,799 Active 29 DOM
-
2026-06-02days on market $369,799 Active 28 DOM
-
2026-06-01days on market $369,799 Active 27 DOM
-
2026-05-31days on market $369,799 Active 26 DOM
-
2026-05-15price $369,799 825-char remark
-
2026-05-05$369,999 Active 825-char remark
-
2011-06-14soldstatus $84,000 Closed 528-char remark
Show marketing remark (528 chars)
3 BDRM + LOFT, 2.5 BATH, 2,199 SQ. FT. HOME. VAULTED CEILINGS, APPLIANCES, OAK CABINETS, PANTRY & ISLAND IN KITCHEN, NEUTRAL COLORS THROUGHOUT, TILE IN ALL THE RIGHT PLACES. FRONT LANDSCAPING IS INCLUDED. PLENTY OF ROOM IN BACK FOR POOL & SPA. MASTER BEDROOM SPLIT WITH ALL BEDROOMS UPSTAIRS + LOFT. VIRGO MODEL #3, MONTALBANO HOMES. NEAR NICELY LANDSCAPED GREENBELT IN SUBDIVISION. LOCATED IN A FAST GROWING AREA OF QUEEN CREEK. DON'T MISS OUT ON THIS ONE. BUY NOW & MOVE IN! NO NEED TO BE WAITING FOR THE BUILDERS.
-
2011-04-22status Pending 528-char remark
Show marketing remark (528 chars)
3 BDRM + LOFT, 2.5 BATH, 2,199 SQ. FT. HOME. VAULTED CEILINGS, APPLIANCES, OAK CABINETS, PANTRY & ISLAND IN KITCHEN, NEUTRAL COLORS THROUGHOUT, TILE IN ALL THE RIGHT PLACES. FRONT LANDSCAPING IS INCLUDED. PLENTY OF ROOM IN BACK FOR POOL & SPA. MASTER BEDROOM SPLIT WITH ALL BEDROOMS UPSTAIRS + LOFT. VIRGO MODEL #3, MONTALBANO HOMES. NEAR NICELY LANDSCAPED GREENBELT IN SUBDIVISION. LOCATED IN A FAST GROWING AREA OF QUEEN CREEK. DON'T MISS OUT ON THIS ONE. BUY NOW & MOVE IN! NO NEED TO BE WAITING FOR THE BUILDERS.
-
2011-04-01$82,000 Active 528-char remark
Show marketing remark (528 chars)
3 BDRM + LOFT, 2.5 BATH, 2,199 SQ. FT. HOME. VAULTED CEILINGS, APPLIANCES, OAK CABINETS, PANTRY & ISLAND IN KITCHEN, NEUTRAL COLORS THROUGHOUT, TILE IN ALL THE RIGHT PLACES. FRONT LANDSCAPING IS INCLUDED. PLENTY OF ROOM IN BACK FOR POOL & SPA. MASTER BEDROOM SPLIT WITH ALL BEDROOMS UPSTAIRS + LOFT. VIRGO MODEL #3, MONTALBANO HOMES. NEAR NICELY LANDSCAPED GREENBELT IN SUBDIVISION. LOCATED IN A FAST GROWING AREA OF QUEEN CREEK. DON'T MISS OUT ON THIS ONE. BUY NOW & MOVE IN! NO NEED TO BE WAITING FOR THE BUILDERS.
-
2006-05-10soldstatus $305,646
-
2006-04-28soldstatus $305,646
Show marketing remark (543 chars)
NEVER LIVED IN!!! Living room has vaulted ceiling to 2nd floor. Kitchen has stainless steel appliances, oak cabinets, pantry & island. Very large laundry room. Master bedroom split with all bedrooms upstairs - double doors and roman tub and shower. Extra room for kids play area or office. Neutral colors throughout, tile in all the right places. Front yard has finished landscaping. Plenty of room in back for pool/spa or kids play area. Near beautifully landscaped greenbelt in subdivision. Located in a fast growing area of Queen Creek.
-
2006-04-14historical
Show marketing remark (543 chars)
NEVER LIVED IN!!! Living room has vaulted ceiling to 2nd floor. Kitchen has stainless steel appliances, oak cabinets, pantry & island. Very large laundry room. Master bedroom split with all bedrooms upstairs - double doors and roman tub and shower. Extra room for kids play area or office. Neutral colors throughout, tile in all the right places. Front yard has finished landscaping. Plenty of room in back for pool/spa or kids play area. Near beautifully landscaped greenbelt in subdivision. Located in a fast growing area of Queen Creek.
-
2006-03-16$298,900
Show marketing remark (543 chars)
NEVER LIVED IN!!! Living room has vaulted ceiling to 2nd floor. Kitchen has stainless steel appliances, oak cabinets, pantry & island. Very large laundry room. Master bedroom split with all bedrooms upstairs - double doors and roman tub and shower. Extra room for kids play area or office. Neutral colors throughout, tile in all the right places. Front yard has finished landscaping. Plenty of room in back for pool/spa or kids play area. Near beautifully landscaped greenbelt in subdivision. Located in a fast growing area of Queen Creek.
-
2006-02-16historical
-
2006-01-21$306,500
-
2006-01-20historical
-
2005-10-31$309,900
-
2005-10-18soldstatus $265,000
-
2005-10-12soldstatus $265,000
-
2005-09-12historical
-
2005-09-08$269,000
-
2004-03-05soldstatus $7,321,275
ⓘ Source: listings_history table (triggers on properties + properties_extension) + one-shot
backfill from property_details.listing_events for pre-trigger history.
Tax reassessment forecast AZ · Resets to sale price
- Current annual tax
- $1,557 · $130/mo
- Projected year-2 tax
- $2,441 · $203/mo
- Expected delta
- +$883/yr (+$74/mo · 56.7%)
ⓘ Screening estimate from a state-policy table — verify with the county assessor before closing.
Climate risk First Street
- Flood 1/10 Low FEMA zone X (unshaded) · 0% chance over 30 yrs
- Wildfire 6/10 Major
- Heat 9/10 Extreme 7 d/yr ≥111°F today · 18 d/yr by 30 yrs out
- Wind 1/10 Low
- Air quality 2/10 Low 1 unhealthy d/yr today · 1 by 30 yrs out
Nearby sold comps map
Loading sold comps map…
Walkable amenities ~0.75 mi
Loading nearby amenities…
Taxation est. · year 1
- Rental income
- $24,646
- − Mortgage interest
- −$20,714
- − Property taxes
- −$1,557
- − Insurance
- −$1,849
- − Repairs & maintenance
- −$1,972
- − Management
- −$1,972
- − HOA
- −$912
- − Depreciation
- −$10,758
- Taxable loss
- −$15,088
- Est. tax savings @ 24.0%
- +$3,621
- After-tax cash flow
- $-4,498/yr
For passive investors: Depreciation is non-cash, so a rental often shows a tax loss while cash-flowing — sheltering income. Rental losses are passive: they offset passive income freely, and up to $25,000/yr can offset ordinary (W-2) income if you actively participate and your MAGI is under $100k (phasing out to $0 by $150k); unused losses carry forward. On sale, claimed depreciation is recaptured at up to 25%, and gains may owe capital-gains tax (a 1031 exchange can defer both). Figures are a year-1 estimate at your 24.0% rate — not tax advice; consult a CPA.
Schools (NCES district)
- District
- Florence Unified School District (4437)
- NCES district ID
- 0402920
- Math proficiency
- 16% ▼ -11.00%
- Reading proficiency
- 24% ▼ -7.00%
- Median HH income
- $54,426
- Composite
- 18.31/100
- National rank
- #8950
- State rank
- #178 of 249 in AZ
Livability — San Tan Valley
- Score
- 54/100
- State rank
- #282
- US rank
- #24192
Category grades
Schools grade is shown separately in the Schools card above.
Census & demographics
- Census place
- San Tan Valley, AZ
Population outlook (Pinal County) Hauer SSP2
- Today (2025)
- 437,574 people
- By 2030
- 446,903 · +2.1%
- By 2040
- 452,589 · +3.4%
- By 2050
- 444,126 · +1.5%
- By 2075
- 430,300 · -1.7%
- By 2100
- 393,536 · -10.1%
Not yet ingested
- Political lean
- —
- Race & ethnicity
- —
- Common origin
- —
- Civics
- —
Market trends
- HPI YoY
- ▲ 24.94%
- Current HPI
- 372.52
- Rent YoY
- —
- Metro
- —
- State GDP YoY
- ▲ 4.54%
- F500 in state
- 20
Industry mix (Fortune 500 HQ in AZ)
| Industry | F500 HQs | Revenue |
|---|---|---|
| Technology | 2 | $13B |
|
||
| Mining / Metals | 1 | $23B |
|
||
| Environmental Services | 1 | $16B |
|
||
| Metals / Steel | 1 | $14B |
|
||
| Technology Distribution | 1 | $9B |
|
||
| Homebuilding | 1 | $8B |
|
||
Price history
-94.9% since first listed18 events — show timeline
- 2026-05-15 Price Changed $369,799 ARMLS
- 2026-05-05 Listed $369,999 ARMLS
- 2011-06-14 Sold (MLS) $84,000 ARMLS
- 2011-04-22 Pending — ARMLS
- 2011-04-01 Listed $82,000 ARMLS
- 2006-05-10 Sold (Public Records) $305,646 Public Records
- 2006-04-28 Sold (MLS) $305,646 ARMLS
- 2006-04-14 Listing Removed — ARMLS
- 2006-03-16 Listed $298,900 ARMLS
- 2006-02-16 Listing Removed — ARMLS
- 2006-01-21 Listed $306,500 ARMLS
- 2006-01-20 Listing Removed — ARMLS
- 2005-10-31 Listed $309,900 ARMLS
- 2005-10-18 Sold (Public Records) $265,000 Public Records
- 2005-10-12 Sold (MLS) $265,000 ARMLS
- 2005-09-12 Listing Removed — ARMLS
- 2005-09-08 Listed $269,000 ARMLS
- 2004-03-05 Sold (Public Records) $7,321,275 Public Records
Property tax history
-0.3%/yrLatest (2025): $1,557 · +2.1% YoY. Source: county tax records.
Cash-flow waterfall
monthlySold comps — $/sqft
last 12 mo · ≤1 miLoading sold comps…