 Triplex
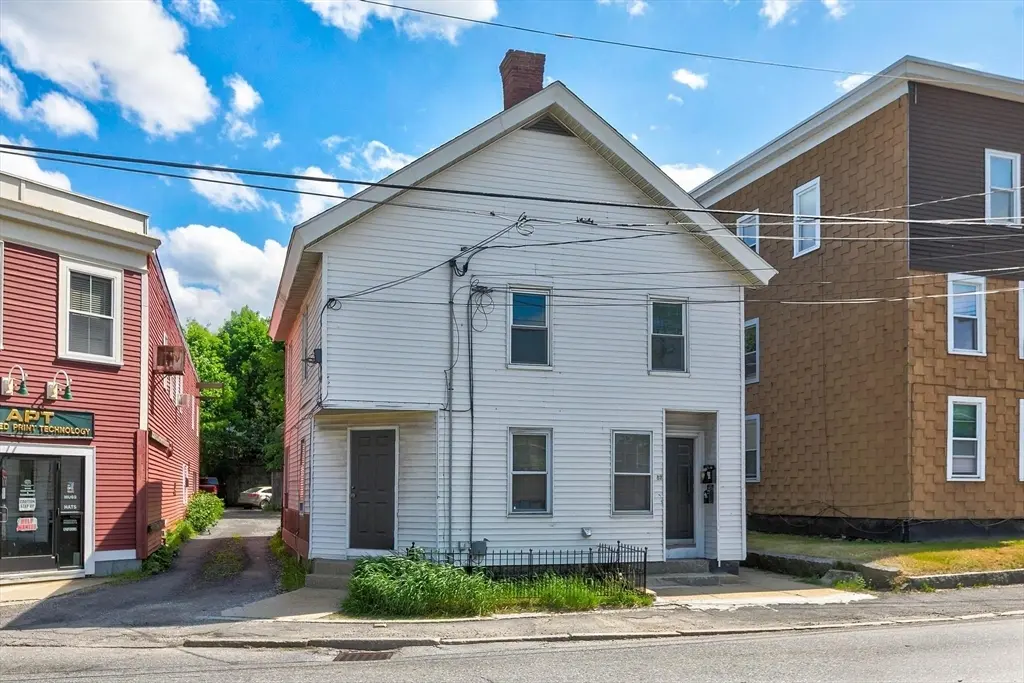
80-82 Laurel St · Fitchburg, MA
Flood risk No data
- FEMA flood zone
- —
- Chance of flooding over 30 yrs
- —
- Est. flood insurance / yr
- —
Fire risk No data
- Est. fire insurance / yr
- —
Heat risk 4/10 · Minor
- Hot days now (above threshold)
- 8 days/yr
- Hot days in 30 yrs
- 18 days/yr
Wind risk No data
- Chance of severe wind over 30 yrs
- —
Air-quality risk 2/10 · Minimal
- Unhealthy air days now
- 1 days/yr
- Unhealthy air days in 30 yrs
- 1 days/yr
Risk factors via First Street. Map © Google.
Why this score? — see what drove the B- grade
The composite is a weighted blend of 9 inputs, each scored 0–100. Each bar is that input's sub-score; the figure is the points it added to the 100-point composite (weight × sub-score).
- Cash flow +30.0/30.0
- DSCR +10.0/10.0
- 1% rule +8.6/10.0
- ARV discount +7.1/15.0
- Livability +3.5/5.0
- Rent growth +3.3/5.0
- Condition / age +2.5/5.0
- Schools +2.0/10.0
- Appreciation +0.0/10.0
$549,000
🖨 Deal sheet (PDF) 📄 Offer letter ✓ Due diligence
Multi-family units
County records classify this as Multi-Family (2-4 Unit). Listing-text estimate: 3 units. confirmed
Listing remarks MLS
Three Family ideally located to commuter rail and bus routes. Short walk to downtown and Rivefront Park. Tenants in place. Plenty of parking. Excellent return for investor or owner occupied. Motivated Seller.
Key facts
- Strong rental demand
- Recent upgrades
- Easy maintenance
Tags
Property features AI
Finance
- HOA & community: Not a senior community
Exterior
- Parking: Open parking for 6 vehicles; Paved driveway; Shared driveway; Off-street parking
- Utilities: Public water; Public sewer; 110-volt electric; Gas available for range
- Home design: 3-family property; 3 stories
- Construction: White exterior; Year built (public records)
- Exterior features: Shingle roof; Paved road access; 0.19-acre lot
Interior
- Kitchen: Range; Microwave; Refrigerator
- Flooring: Vinyl; Tile; Wood
- Bathrooms: 3 full bathrooms; 1 half bathroom
- Heating & cooling: Natural gas heating; Pellet stove; Window air conditioning units
- Interior features: Lead paint certified treated; Living room; Kitchen; Total of 11 rooms
Neighborhood map
What this means for you Summary
Snapshot
- This is a 3 × 5-bed/4.0-bath units multifamily listed at $549k.
Deal economics
- At list price, monthly cash flow is $2k ($29k/yr) — positive. Per door: $811/mo.
- The deal already cash-flows at list — no discount required.
- Meets the 1% rule at list price ($7k rent vs $549k).
- Recommended offer: $533k (3.0% below list) — sets the bar for market timing.
- Cap rate 11.6% vs local median 4.0% in Fitchburg — top-decile yield for the area; either an underpriced asset or a hidden risk that comps aren't pricing in. Stress-test before assuming the spread holds.
Location & tenants
- Location reads 69/100 on livability (#137 in MA) — a middle-class / working-renter tenant base. Strengths: housing A+, commute A-, health & safety B+; Watch: employment D+, crime D, amenities F.
- Fitchburg (suburban): math 15% / reading 30% proficiency, ranked #282 of 302 in MA (top 93%) — low school quality limits family demand, transient renter base, plan for 1-2y turnover; 64% free/reduced lunch — lower-income household profile, screen leases tightly.
- Zoned schools: Mckay Elementary School (math 13% / reading 24%, grade F, #805 of 938 statewide, top 86%, 727 students, 0% FRL); Arthur M Longsjo Middle School (math 11% / reading 22%, grade F, #271 of 305 statewide, top 89%, 588 students, 0% FRL); Fitchburg High (math 25% / reading 42%, grade F, #251 of 343 statewide, top 73%, 1,246 students, 0% FRL) — zoned schools average 0% FRL vs 64% district-wide (64 pts lower); this property's tenant base skews higher-income than the district average.
- Market conditions: Rents rising (+3.1%/yr); 89 active listings in the ZIP; 3 comparable units currently listed for rent nearby; rentals at typical pace (median 16d on market — plan ~3-4 weeks tenant-placement turnaround); 2,293 units permitted in Worcester County in 2024 (1,205 in 5+ unit buildings).
- At $7,459/mo this rent would consume 123% of the median local household income ($73k/yr) (locally 1763% of renters already pay >50% of income on rent) — very limited rent-growth headroom before tenants either downsize or default.
Forward outlook
- Local home prices are declining (-3.0%/yr); year-one equity from $4k of loan paydown is wiped out by about $16k of value loss. Plan a longer hold.
- At projected returns (-3.0% appreciation + 3.1% rent growth), your $154k cash investment doubles in ~7 years — after that, you're playing with house money.
Negotiation context
- It's been on market 31 days — a 3% lower offer ($533k) is reasonable based on typical stale-listing flexibility.
- 3 sale attempts since 33y ago with the ask held roughly flat each time — persistent listings suggest the price (not the market) is what's stuck; bring a comps-based counter.
- Current owner paid $55k; list at $549k implies a 898% gain — meaningful room to come down on a strong offer.
Risks & watch-outs
- Watch-outs: built in 1926 — expect roof / HVAC / electrical / plumbing capex.
Questions for the listing agent
- It's been on market 31 days. Have you received any prior offers? Is the seller open to a 3% concession, seller financing, or rate buy-down credit?
- Can we see the unit-by-unit rent roll, current vacancy, and any below-market leases? What's the average tenancy length?
- What capital expenditures (roof, boiler, parking lot, exteriors) have been made in the last 5 years, and what's planned in the next 2?
- Built in 1926 — when were the roof, HVAC, electrical panel, plumbing, and water heater last replaced?
- Is there a deadline driving the sale (1031 exchange, divorce, estate, relocation)? That informs how much negotiation room exists.
- Schools are D-rated, which usually means shorter tenancies and higher turnover. Who's the typical renter profile here, and what's been the actual vacancy rate?
- Crime grade is D in this area — have there been break-ins, vandalism, or insurance claims at this property in the last 3 years? What carrier currently insures it and at what premium?
- What's the average days-on-market for RENTAL listings here right now (not sales)? A rising rental-DOM trend means longer vacancies and softer asking-rent achievability than the comps imply.
- What's the recent tenant-quality profile in this submarket — average credit score on applications, eviction rate, late-payment / NSF rate, and stable-employment percentage? A property-management company in the area should have these aggregated.
- How much new apartment / multifamily construction is in the pipeline within 1–3 miles? Heavy new supply (>2% of stock underway) typically softens rents 12–24 months out; light construction supports rent growth.
Investment metrics
- 1% rule
- 1.36% ✓
- Cap rate
- 11.61%
- Cash-on-cash
- 18.99%
- DSCR
- 1.84
- GRM
- 6.1
CMA / ARV
- ARV (on-the-fly)
- $543,915
- Comps found
- 12
Show comp detail 12 sales within ~0.75 mi
| Address | Dist | Beds/Ba | Sqft | Sold | Price | $/sf | Match |
|---|---|---|---|---|---|---|---|
| 44-46 Oliver St | 0.27mi | 5/4.0 | 2,430 (+6%) | 1mo | $580,000 | $239 | 77 |
| 82 Charles St | 0.23mi | 5/2.0 | 2,383 (+4%) | 0mo | $310,000 | $130 | 75 |
| 10 Payson St | 0.09mi | 6/3.0 (+1) | 2,160 (-6%) | 8mo | $525,000 | $243 | 70 |
| 318 Charles St | 0.46mi | 5/3.0 | 2,348 (+2%) | 2mo | $594,000 | $253 | 69 |
| 133-137 Laurel St | 0.11mi | 6/2.0 (+1) | 2,091 (-9%) | 6mo | $505,000 | $242 | 62 |
| 40 Orange St | 0.64mi | 5/2.0 | 2,312 (+1%) | 1mo | $415,000 | $179 | 60 |
| 26 Pratt Rd | 0.64mi | 6/3.0 (+1) | 2,256 (-2%) | 1mo | $665,000 | $295 | 58 |
| 39-41 Cliff St | 0.41mi | 6/2.0 (+1) | 2,472 (+8%) | 2mo | $550,000 | $222 | 53 |
| 173 Myrtle Ave | 0.68mi | 5/3.0 | 2,547 (+11%) | 3mo | $571,000 | $224 | 43 |
| 76 Heywood St | 0.63mi | 6/2.0 (+1) | 2,532 (+10%) | 1mo | $600,000 | $237 | 40 |
| 22 Hawes St | 0.59mi | 6/2.0 (+1) | 2,577 (+12%) | 3mo | $480,000 | $186 | 36 |
| 26 Lawrence St | 0.69mi | 4/2.0 (-1) | 1,980 (-14%) | 6mo | $365,000 | $184 | 27 |
Match score weights: distance 35% · size 25% · config 20% · recency 20%. Top-matched comps best support the ARV.
Projected returns pro-forma
-3.0% appreciation · 3.06% rent growth · sell at horizon
- IRR
- 10.9%
- Equity multiple
- 1.43×
- Total profit
- $66,335
- Equity at exit
- $81,858
- IRR
- 20.0%
- Equity multiple
- 2.68×
- Total profit
- $258,746
- Equity at exit
- $47,467
Cash invested: $153,720 (down + closing). Projections, not guarantees.
Landlord ↔ Tenant lean methodology
- Overall (STATE)
- 20 Strongly Tenant-Friendly
- State Massachusetts
- 20 Strongly Tenant-Friendly · D+15
- County
- — inherits STATE
- City
- — inherits STATE
ZIP-level market 01420
- Home prices YoY
- -25.2%
- Rents YoY
- 3.1%
- Active inventory
- 89
- Price-to-rent
- 18.4×
Monthly cashflow live
- Estimated rent
- $7,459 medium interval (Pro) →
- Mortgage (P&I)
- −$2,879
- Tax from tax record
- −$352 /mo · $4,226/yr
- Insurance
- −$229
- HOA
- −$0
- Vacancy / Maint / Mgmt
- −$1,566
- Net cashflow
- $2,433
Break-even live
Sensitivity live
| Price | -10% $2,743 | -5% $2,588 | +0% $2,433 | +5% $2,277 | +10% $2,122 |
|---|---|---|---|---|---|
| Rent | -10% $1,843 | -5% $2,138 | +0% $2,433 | +5% $2,727 | +10% $3,022 |
| Rate | -1.0pp $2,709 | -0.5pp $2,572 | base $2,433 | +0.5pp $2,290 | +1.0pp $2,146 |
3-unit breakdown (identical units grouped — click to expand)
| Units | Beds | Baths | Est. rent |
|---|---|---|---|
| 3× units | 5 | 4 | $7,458 |
| #1 | 5 | 4 | $2,486 |
| #2 | 5 | 4 | $2,486 |
| #3 | 5 | 4 | $2,486 |
| Total (3 units) | $7,459 | ||
UW: 25.0% down · 7.5% · 30yr · 1.5% tax · 5.0% vac · 8.0% maint · 8.0% mgmt
Financing live
Cash to close
- Down payment
- $137,250
- Closing costs
- $16,470
- Reserves months
- —
- Total cash needed
- —
Loan-product check · same deal, 3 products live
Conventional
25% down · 7.5% · 30yr
- Down + closing
- —
- Monthly P&I
- —
- Monthly cashflow
- —
- DSCR
- —
- Eligible?
- —
Personal DTI + credit; lowest rate.
DSCR
20% down · 8.5% · 30yr
- Down + closing
- —
- Monthly P&I
- —
- Monthly cashflow
- —
- DSCR
- —
- Eligible?
- —
No personal income docs; deal must DSCR.
Hard money
10% down · 12.0% · 12mo
- Down + closing
- —
- Monthly P&I
- —
- Monthly cashflow
- —
- DSCR
- —
- Eligible?
- —
Short-term bridge; refi at stabilization.
Rent comps 3 comps
| Address | Beds | Baths | Sqft | Rent | $/sqft | DOM | Units | Dist |
|---|---|---|---|---|---|---|---|---|
| 60 Congress St Unit 2 Fitchburg, MA | 5.0 | 2.0 | 1670 | $3,250 | $1.95 | 15d | 1 | 0.59mi |
| 62 Lincoln St Unit 2 Fitchburg, MA | 5.0 | 2.0 | 1776 | $3,600 | $2.03 | 15d | 1 | 0.76mi |
| 75 Beech St Unit 1 Fitchburg, MA | 4.0 | 3.0 | 1800 | $3,000 | $1.67 | 15d | 1 | 0.85mi |
Listing history 26 events
-
2026-06-21days on market $549,000 Active 31 DOM
-
2026-06-18days on market $549,000 Active 28 DOM
-
2026-06-17days on market $549,000 Active 27 DOM
-
2026-06-16days on market $549,000 Active 26 DOM
-
2026-06-15days on market $549,000 Active 25 DOM
-
2026-06-14days on market $549,000 Active 23 DOM
-
2026-06-10days on market $549,000 Active 20 DOM
-
2026-06-09days on market $549,000 Active 19 DOM
-
2026-06-08days on market $549,000 Active 18 DOM
-
2026-06-07days on market $549,000 Active 17 DOM
-
2026-06-03days on market $549,000 Active 13 DOM
-
2026-06-02days on market $549,000 Active 12 DOM
-
2026-06-01days on market $549,000 Active 11 DOM
-
2026-05-31days on market $549,000 Active 10 DOM
-
2026-05-31days on market $549,000 Active 9 DOM
-
2026-05-21$549,000 New
-
2011-12-30soldstatus $55,000 Sold 208-char remark
Show marketing remark (208 chars)
Three Family ideally located to commuter rail and bus routes. Short walk to downtown and Rivefront Park. Tenants in place. Plenty of parking. Excellent return for investor or owner occupied. Motivated Seller.
-
2011-12-20historical Under Agreement 208-char remark
Show marketing remark (208 chars)
Three Family ideally located to commuter rail and bus routes. Short walk to downtown and Rivefront Park. Tenants in place. Plenty of parking. Excellent return for investor or owner occupied. Motivated Seller.
-
2011-09-28price $89,900 Price Changed 208-char remark
Show marketing remark (208 chars)
Three Family ideally located to commuter rail and bus routes. Short walk to downtown and Rivefront Park. Tenants in place. Plenty of parking. Excellent return for investor or owner occupied. Motivated Seller.
-
2011-08-30$99,900 New 208-char remark
Show marketing remark (208 chars)
Three Family ideally located to commuter rail and bus routes. Short walk to downtown and Rivefront Park. Tenants in place. Plenty of parking. Excellent return for investor or owner occupied. Motivated Seller.
-
1997-01-03soldstatus $40,000
-
1993-06-24soldstatus $25,000
-
1993-06-23soldstatus $25,000 171-char remark
Show marketing remark (171 chars)
FANNIE MAE OWNED & FINANCED. IN NEED OF MUCH WORK AND RENOVATION. SOLD AS IS WHERE IS. RIGHT OF WAY/PARKING WITH NEIGHBOR. 1000 SELLING OFFICE BONUS. SUBJECT TO TITLE.
-
1993-05-14historical 171-char remark
Show marketing remark (171 chars)
FANNIE MAE OWNED & FINANCED. IN NEED OF MUCH WORK AND RENOVATION. SOLD AS IS WHERE IS. RIGHT OF WAY/PARKING WITH NEIGHBOR. 1000 SELLING OFFICE BONUS. SUBJECT TO TITLE.
-
1993-04-12$26,600 171-char remark
Show marketing remark (171 chars)
FANNIE MAE OWNED & FINANCED. IN NEED OF MUCH WORK AND RENOVATION. SOLD AS IS WHERE IS. RIGHT OF WAY/PARKING WITH NEIGHBOR. 1000 SELLING OFFICE BONUS. SUBJECT TO TITLE.
-
1988-02-01soldstatus $140,000
ⓘ Source: listings_history table (triggers on properties + properties_extension) + one-shot
backfill from property_details.listing_events for pre-trigger history.
Tax reassessment forecast MA · Partial reset (capped growth)
- Current annual tax
- $4,226 · $352/mo
- Projected year-2 tax
- $5,489 · $457/mo
- Expected delta
- +$1,263/yr (+$105/mo · 29.9%)
ⓘ Screening estimate from a state-policy table — verify with the county assessor before closing.
Climate risk First Street
- Heat 4/10 Moderate
- Air quality 2/10 Low 1 unhealthy d/yr today · 1 by 30 yrs out
Nearby sold comps map
Loading sold comps map…
Walkable amenities ~0.75 mi
Loading nearby amenities…
Taxation est. · year 1
- Rental income
- $89,508
- − Mortgage interest
- −$30,753
- − Property taxes
- −$4,226
- − Insurance
- −$2,745
- − Repairs & maintenance
- −$7,161
- − Management
- −$7,161
- − Depreciation
- −$15,971
- Taxable income
- $21,492
- Est. tax owed @ 24.0%
- −$5,158
- After-tax cash flow
- $24,034/yr
For passive investors: Depreciation is non-cash, so a rental often shows a tax loss while cash-flowing — sheltering income. Rental losses are passive: they offset passive income freely, and up to $25,000/yr can offset ordinary (W-2) income if you actively participate and your MAGI is under $100k (phasing out to $0 by $150k); unused losses carry forward. On sale, claimed depreciation is recaptured at up to 25%, and gains may owe capital-gains tax (a 1031 exchange can defer both). Figures are a year-1 estimate at your 24.0% rate — not tax advice; consult a CPA.
Schools (NCES district)
- District
- Fitchburg
- NCES district ID
- 2504890
- Math proficiency
- 15% ▼ -14.00%
- Reading proficiency
- 30% ▼ -7.00%
- Median HH income
- $48,430
- Composite
- 19.78/100
- National rank
- #8705
- State rank
- #282 of 302 in MA
Livability — Fitchburg
- Score
- 69/100
- State rank
- #137
- US rank
- #8435
Category grades
Schools grade is shown separately in the Schools card above.
Census & demographics
- Census place
- Fitchburg, MA
- County
- Worcester County · 487,911 people
- City population
- 41,839
- Metro
- Worcester, MA-CT
- Population (ZIP)
- 41,839
- Household income
- $72,780
- Rent vs Own
- Severe rent burden
- 1763.0
Population outlook (Worcester County) Hauer SSP2
- Today (2025)
- 850,858 people
- By 2030
- 860,403 · +1.1%
- By 2040
- 869,902 · +2.2%
- By 2050
- 869,110 · +2.1%
- By 2075
- 870,120 · +2.3%
- By 2100
- 829,703 · -2.5%
Race, ethnicity, and origin ACS 2023
- Neighborhood character
- Diverse neighborhood (Simpson 0.58)
- Race & ethnicity
- White 57% Hispanic / Latino 30% Two or more races 19% Black 6% Asian 2%
- Hispanic origin (detail)
- Mexican 2% Puerto Rican 20% Dominican 2%
- Common ancestry
- Lithuanian 8% Romanian 3% Slovak 1%
- Foreign-born
- 10% · Canada, Jamaica
- Languages at home
- 71% English-only · Spanish 22% French/Haitian/Cajun 3% Other Indo-European 2%
Political lean MEDSL · Worcester
- 2024 margin
- D (+10.0) · D 53.9% · R 43.9% · Other 2.2%
- 2008→2024 swing
- -3.8pp toward R · 2008: 13.8pp · 2024: 10.0pp
- All cycles
- 2024: D+10.0 2020: D+17.8 2016: D+10.5 2012: D+9.2 2008: D+13.8
Not yet ingested
- Civics
- —
Market trends
- HPI YoY
- ▼ -102.11%
- Current HPI
- 303.1067
- Rent YoY
- ▲ 3.06%
- Metro
- Worcester, MA-CT
- State GDP YoY
- ▲ 2.28%
- F500 in state
- 38
Industry mix (Fortune 500 HQ in MA)
| Industry | F500 HQs | Revenue |
|---|---|---|
| Technology | 3 | $17B |
|
||
| Insurance | 2 | $84B |
|
||
| Retail | 2 | $76B |
|
||
| Life Sciences | 1 | $43B |
|
||
| Energy Technology | 1 | $31B |
|
||
| Aerospace / Defense | 1 | $18B |
|
||
Price history
+292.1% since first listed11 events — show timeline
- 2026-05-21 Listed $549,000 MLS PIN
- 2011-12-30 Sold (MLS) $55,000 MLS PIN
- 2011-12-20 Contingent — MLS PIN
- 2011-09-28 Price Changed $89,900 MLS PIN
- 2011-08-30 Listed $99,900 MLS PIN
- 1997-01-03 Sold (Public Records) $40,000 Public Records
- 1993-06-24 Sold (Public Records) $25,000 Public Records
- 1993-06-23 Sold (MLS) $25,000 MLS PIN
- 1993-05-14 Listing Removed — MLS PIN
- 1993-04-12 Listed $26,600 MLS PIN
- 1988-02-01 Sold (Public Records) $140,000 Public Records
Property tax history
+5.2%/yrLatest (2022): $4,226 · -3.4% YoY. Source: county tax records.
Cash-flow waterfall
monthlySold comps — $/sqft
last 12 mo · ≤1 miLoading sold comps…