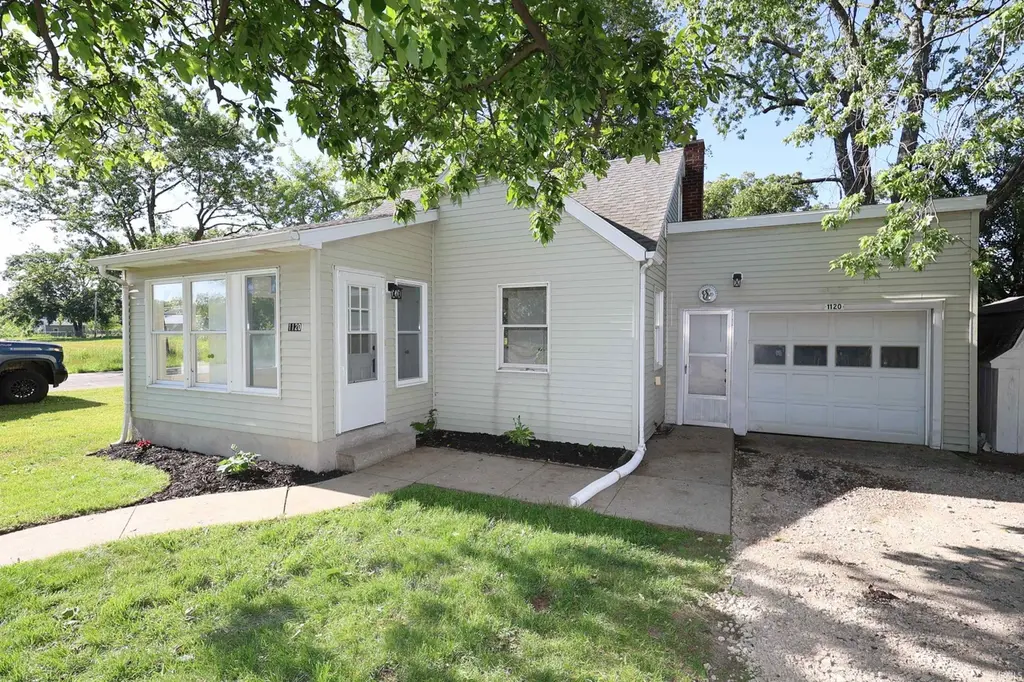
1120 Sanders Ave · Goshen, IN
Flood risk 1/10 · Minimal
- FEMA flood zone
- X (unshaded)
- Chance of flooding over 30 yrs
- 0.0%
- Est. flood insurance / yr
- $473 – $860
Fire risk 1/10 · Minimal
- Est. fire insurance / yr
- $717 – $1,331
Heat risk 3/10 · Minor
- Hot days now (above 100°F)
- 7 days/yr
- Hot days in 30 yrs
- 16 days/yr
Wind risk 2/10 · Minimal
- Chance of severe wind over 30 yrs
- —
Air-quality risk 2/10 · Minimal
- Unhealthy air days now
- 1 days/yr
- Unhealthy air days in 30 yrs
- 2 days/yr
Risk factors via First Street. Map © Google.
Why this score? — see what drove the F grade
The composite is a weighted blend of 9 inputs, each scored 0–100. Each bar is that input's sub-score; the figure is the points it added to the 100-point composite (weight × sub-score).
- ARV discount +7.5/15.0
- Livability +4.2/5.0
- Cash flow +3.0/30.0
- Schools +3.0/10.0
- Rent growth +2.5/5.0
- Condition / age +2.5/5.0
- 1% rule +0.0/10.0
- DSCR +0.0/10.0
- Appreciation +0.0/10.0
$219,900
🖨 Deal sheet 📄 Offer letter ✓ Due diligence
Listing remarks MLS
Adorable and affordable! Well maintained home on Goshen south side. Efficient floor plan. All kitchen appliances stay. Partially finished lower level. Taxes would be much less with homestead exemption. Payments less then rent!
Key facts
- 4,792 sq ft lot
- Garage
- Built 1947
Property features AI
Finance
- Other: Zoned R-1 Single-Family; Subdivision: None
Exterior
- Parking: Attached garage with 1 garage space
- Utilities: Public water; Public sewer
- Home design: Single-family, site-built home; One-story
- Construction: Vinyl siding; Shingle roof; Below-grade finished area included
- Exterior features: Corner lot; Lot dimensions approximately 75 x 90
Interior
- Kitchen: Includes Dishwasher, Microwave, Gas Range
- Bedrooms: Total of 12 rooms (bedroom count not specified)
- Flooring: Carpet; Vinyl
- Bathrooms: 1 full bathroom (main level)
- Heating & cooling: Natural gas heating with forced air; Central air conditioning
- Interior features: Dishwasher, Microwave, Gas Range; Full and partial basement
- Laundry & utility: Laundry located on the lower level
Neighborhood map
What this means for you Summary
Snapshot
- This is a 2-bed/1.0-bath single-family listed at $220k.
Deal economics
- At list price, monthly cash flow is $-717 ($-9k/yr) — negative.
- To cash-flow at today's rent, offer at most $93k (57.6% below list).
- To meet the 1% rule (rent ≥ 1% of price), the offer needs to be $84k (61.7% below list).
- Recommended offer: $84k (61.7% below list) — sets the bar for 1% rule.
- Cap rate 2.4% vs local median 3.2% in Goshen — below-typical yield; the buyer is paying a premium for something (appreciation thesis, condition, location) that the cap rate doesn't capture.
Location & tenants
- Location reads 85/100 on livability (#4 in IN, #622 nationally) — a professional / high-income tenant draw. Strengths: commute A+, cost of living A+, housing A+; Watch: employment D+.
- Goshen Community Schools (urban): math 31% / reading 40% proficiency, ranked #190 of 301 in IN (top 63%) — families likely to look elsewhere, expect single-tenant / working-renter base with shorter leases.
- Zoned schools: Parkside Elementary School (math 57% / reading 42%, grade D, #279 of 994 statewide, top 30%, 252 students, 62% FRL); Goshen Junior High School (math 25% / reading 38%, grade F, #197 of 330 statewide, top 60%, 1,001 students, 70% FRL); Goshen High School (math 32% / reading 65%, grade D, #139 of 369 statewide, top 38%, 2,004 students, 64% FRL).
- Market conditions: 74 active listings in the ZIP; 2 comparable units currently listed for rent nearby; 484 units permitted in Elkhart County in 2024 (136 in 5+ unit buildings).
Forward outlook
- Local home prices are declining (-3.0%/yr); year-one equity from $2k of loan paydown is wiped out by about $7k of value loss. Plan a longer hold.
- Elkhart County population projected at +7% by 2050 — modest demand growth; plan on rents tracking national, not racing it.
Negotiation context
- Only 6 days on market — expect competitive offers; lowballing is unlikely to land.
- 2 sale attempts since 10y ago with the ask held roughly flat each time — persistent listings suggest the price (not the market) is what's stuck; bring a comps-based counter.
- Current owner paid $66k; list at $220k implies a 233% gain — meaningful room to come down on a strong offer.
Risks & watch-outs
- Watch-outs: built in 1947 — expect roof / HVAC / electrical / plumbing capex.
Questions for the listing agent
- What do current leases actually rent for vs. the listed asking? Can we see a recent rent roll and the last 12 months of T-12 income?
- Built in 1947 — when were the roof, HVAC, electrical panel, plumbing, and water heater last replaced?
- Is there a deadline driving the sale (1031 exchange, divorce, estate, relocation)? That informs how much negotiation room exists.
- Schools are D-rated, which usually means shorter tenancies and higher turnover. Who's the typical renter profile here, and what's been the actual vacancy rate?
- The area grade is low — what's the realistic commute time and amenity access for the typical tenant pool here? Any planned neighborhood developments (good or bad) we should know about?
- What's the average days-on-market for RENTAL listings here right now (not sales)? A rising rental-DOM trend means longer vacancies and softer asking-rent achievability than the comps imply.
- What's the recent tenant-quality profile in this submarket — average credit score on applications, eviction rate, late-payment / NSF rate, and stable-employment percentage? A property-management company in the area should have these aggregated.
- How much new for-sale + rental construction is in the pipeline within 1–3 miles? Heavy new supply typically softens prices + rents 12–24 months out; constrained supply supports both.
Investment metrics
- 1% rule
- 0.38% ✗
- Cap rate
- 2.38%
- Cash-on-cash
- -13.98%
- DSCR
- 0.38
- GRM
- 21.7
CMA / ARV
- ARV (on-the-fly)
- $128,570
- Comps found
- 9
Show comp detail 9 sales within ~0.75 mi
| Address | Dist | Beds/Ba | Sqft | Sold | Price | $/sf | Match |
|---|---|---|---|---|---|---|---|
| 817 S 12th St | 0.33mi | 2/1.0 | 598 (0%) | 10mo | $140,000 | $234 | 76 |
| 1113 Sanders Ave | 0.04mi | 2/1.0 | 648 (+8%) | 16mo | $158,000 | $244 | 71 |
| 1205 E Plymouth Ave | 0.27mi | 2/1.0 | 572 (-4%) | 15mo | $142,300 | $249 | 67 |
| 1008 E Monroe St | 0.12mi | 1/1.0 (-1) | 560 (-6%) | 20mo | $100,000 | $179 | 62 |
| 1114 Sanders Ave | 0.02mi | 1/1.0 (-1) | 660 (+10%) | 17mo | $90,000 | $136 | 62 |
| 905 S 14 th St | 0.32mi | 1/1.0 (-1) | 526 (-12%) | 2mo | $65,100 | $124 | 58 |
| 1111 E Plymouth Ave | 0.27mi | 2/1.0 | 549 (-8%) | 19mo | $140,000 | $255 | 57 |
| 821 S 12th St | 0.34mi | 2/1.0 | 672 (+12%) | 13mo | $144,500 | $215 | 53 |
| 905 S 16th St | 0.32mi | 1/1.0 (-1) | 512 (-14%) | 7mo | $107,000 | $209 | 50 |
Match score weights: distance 35% · size 25% · config 20% · recency 20%. Top-matched comps best support the ARV.
Projected returns pro-forma
-3.0% appreciation · 3.0% rent growth · sell at horizon
- IRR
- -42.8%
- Equity multiple
- -0.32×
- Total profit
- $-81,396
- Equity at exit
- $32,788
- IRR
- -74.7%
- Equity multiple
- -1.11×
- Total profit
- $-130,002
- Equity at exit
- $19,013
Cash invested: $61,572 (down + closing). Projections, not guarantees.
Landlord ↔ Tenant lean methodology
- Overall (STATE)
- 90 Strongly Landlord-Friendly
- State Indiana
- 90 Strongly Landlord-Friendly · R+11
- County
- — inherits STATE
- City
- — inherits STATE
ZIP-level market 46528
- Home prices YoY
- -26.9%
- Active inventory
- 74
- Price-to-rent
- 21.7×
Monthly cashflow live
- Estimated rent
- $843 medium interval (Pro) →
- Mortgage (P&I)
- −$1,153
- Tax from tax record
- −$138 /mo · $1,659/yr
- Insurance
- −$92
- HOA
- −$0
- Vacancy / Maint / Mgmt
- −$177
- Net cashflow
- $-717
Break-even live
UW: 25.0% down · 7.5% · 30yr · 1.5% tax · 5.0% vac · 8.0% maint · 8.0% mgmt
Financing live
Cash to close
- Down payment
- $54,975
- Closing costs
- $6,597
- Reserves months
- —
- Total cash needed
- —
Loan-product check · same deal, 3 products live
Conventional
25% down · 7.5% · 30yr
- Down + closing
- —
- Monthly P&I
- —
- Monthly cashflow
- —
- DSCR
- —
- Eligible?
- —
Personal DTI + credit; lowest rate.
DSCR
20% down · 8.5% · 30yr
- Down + closing
- —
- Monthly P&I
- —
- Monthly cashflow
- —
- DSCR
- —
- Eligible?
- —
No personal income docs; deal must DSCR.
Hard money
10% down · 12.0% · 12mo
- Down + closing
- —
- Monthly P&I
- —
- Monthly cashflow
- —
- DSCR
- —
- Eligible?
- —
Short-term bridge; refi at stabilization.
Rent comps 2 comps
| Address | Beds | Baths | Sqft | Rent | $/sqft | DOM | Units | Dist |
|---|---|---|---|---|---|---|---|---|
| 1103 S 9th St Apt B Goshen, IN | 1.0 | 1.0 | 500 | $800 | $1.60 | 43d | 1 | 0.71mi |
| 200 W Lincoln Ave Apt 4 Goshen, IN | 1.0 | 1.0 | 600 | $895 | $1.49 | 21d | 1 | 1.04mi |
Listing history 7 events
-
2026-06-13status $219,900 Pending 6 DOM
-
2026-06-10days on market $219,900 Active 6 DOM
-
2026-06-09days on market $219,900 Active 5 DOM
-
2026-06-08days on market $219,900 Active 4 DOM
-
2026-06-07days on market $219,900 Active 3 DOM
-
2026-06-05remarks 693-char remark
-
2026-06-05$219,900 Active 1 DOM
ⓘ Source: listings_history table (triggers on properties + properties_extension) + one-shot
backfill from property_details.listing_events for pre-trigger history.
Tax reassessment forecast IN · Partial reset (capped growth)
- Current annual tax
- $1,659 · $138/mo
- Projected year-2 tax
- $1,764 · $147/mo
- Expected delta
- +$105/yr (+$9/mo · 6.3%)
ⓘ Screening estimate from a state-policy table — verify with the county assessor before closing.
Climate risk First Street
- Flood 1/10 Low FEMA zone X (unshaded) · 0% chance over 30 yrs
- Wildfire 1/10 Low
- Heat 3/10 Moderate 7 d/yr ≥100°F today · 16 d/yr by 30 yrs out
- Wind 2/10 Low
- Air quality 2/10 Low 1 unhealthy d/yr today · 2 by 30 yrs out
Nearby sold comps map
Loading sold comps map…
Walkable amenities ~0.75 mi
Loading nearby amenities…
Taxation est. · year 1
- Rental income
- $10,111
- − Mortgage interest
- −$12,318
- − Property taxes
- −$1,659
- − Insurance
- −$1,100
- − Repairs & maintenance
- −$809
- − Management
- −$809
- − Depreciation
- −$6,397
- Taxable loss
- −$12,980
- Est. tax savings @ 24.0%
- +$3,115
- After-tax cash flow
- $-5,494/yr
For passive investors: Depreciation is non-cash, so a rental often shows a tax loss while cash-flowing — sheltering income. Rental losses are passive: they offset passive income freely, and up to $25,000/yr can offset ordinary (W-2) income if you actively participate and your MAGI is under $100k (phasing out to $0 by $150k); unused losses carry forward. On sale, claimed depreciation is recaptured at up to 25%, and gains may owe capital-gains tax (a 1031 exchange can defer both). Figures are a year-1 estimate at your 24.0% rate — not tax advice; consult a CPA.
Schools (NCES district)
- District
- Goshen Community Schools
- NCES district ID
- 1803930
- Math proficiency
- 31% ▼ -11.00%
- Reading proficiency
- 40% ▼ -4.00%
- Median HH income
- $44,892
- Composite
- 30.24/100
- National rank
- #6292
- State rank
- #190 of 301 in IN
Livability — Goshen
- Score
- 85/100
- State rank
- #4
- US rank
- #622
Category grades
Schools grade is shown separately in the Schools card above.
Census & demographics
- Census place
- Goshen, IN
- City population
- 33,668
- Population (ZIP)
- 26,356
Population outlook (Elkhart County) Hauer SSP2
- Today (2025)
- 213,761 people
- By 2030
- 218,103 · +2.0%
- By 2040
- 225,381 · +5.4%
- By 2050
- 229,447 · +7.3%
- By 2075
- 232,856 · +8.9%
- By 2100
- 214,088 · +0.2%
Race, ethnicity, and origin ACS 2023
- Neighborhood character
- Predominantly White (76%)
- Race & ethnicity
- White 76% Hispanic / Latino 19% Two or more races 7% Black 2% Asian 1%
- Hispanic origin (detail)
- Mexican 16%
- Common ancestry
- Italian 3% Iranian 2% Polish 2%
- Foreign-born
- 9% · Canada, South Korea, Jamaica
- Languages at home
- 73% English-only · Spanish 14% German/W. Germanic 11% Russian/Polish/Slavic 1%
Political lean MEDSL · Elkhart
- 2024 margin
- Solid R (+32.4) · D 33.1% · R 65.5% · Other 1.4%
- 2008→2024 swing
- -21.2pp toward R · 2008: -11.2pp · 2024: -32.4pp
- All cycles
- 2024: R+32.4 2020: R+28.1 2016: R+32.4 2012: R+26.5 2008: R+11.2
Not yet ingested
- Civics
- —
Market trends
- HPI YoY
- ▼ -85.40%
- Current HPI
- 231.4441
- Rent YoY
- —
- Metro
- —
- State GDP YoY
- ▲ 2.90%
- F500 in state
- 18
Industry mix (Fortune 500 HQ in IN)
| Industry | F500 HQs | Revenue |
|---|---|---|
| Industrial Machinery | 2 | $37B |
|
||
| Healthcare | 1 | $177B |
|
||
| Pharmaceuticals | 1 | $45B |
|
||
| Metals / Steel | 1 | $18B |
|
||
| Agriculture | 1 | $17B |
|
||
| Packaging | 1 | $12B |
|
||
Price history
+214.6% since first listed3 events — show timeline
- 2026-06-04 Listed $219,900 IRMLS
- 2016-05-26 Sold (MLS) $66,000 IRMLS
- 2016-04-04 Listed $69,900 IRMLS
Property tax history
-1.1%/yrLatest (2025): $1,659 · -18.9% YoY. Source: county tax records.
Cash-flow waterfall
monthlySold comps — $/sqft
last 12 mo · ≤1 miLoading sold comps…