 Multi-family
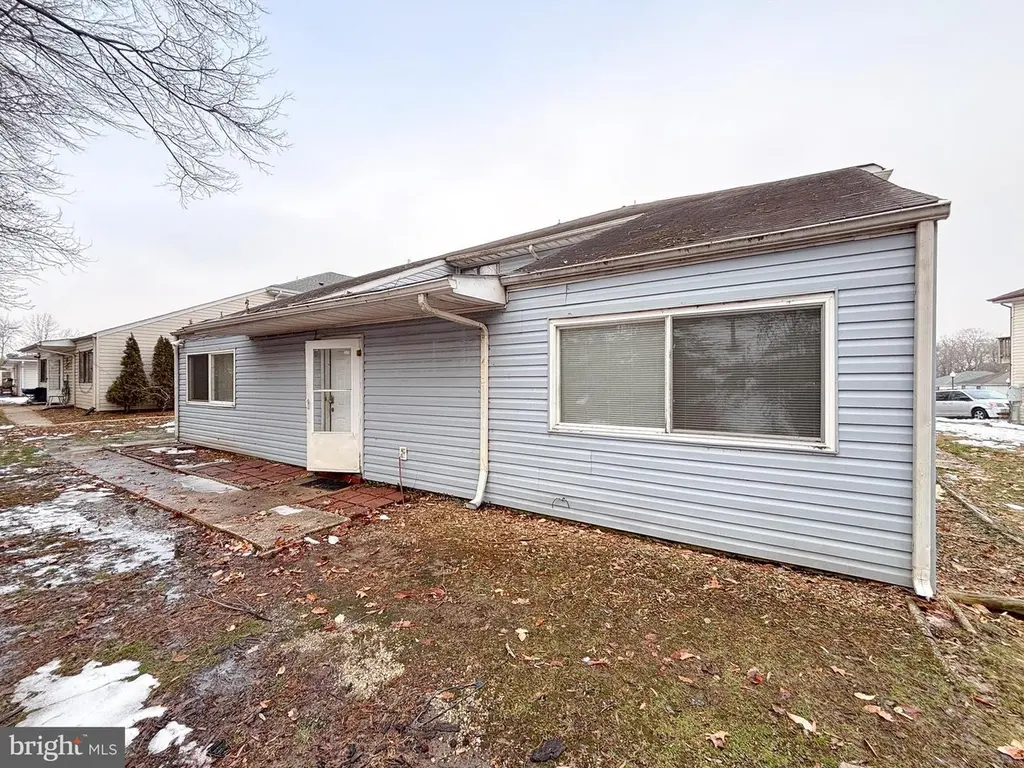
814-A Windstream Way Unit 814-A · Edgewood, MD
Flood risk 1/10 · Minimal
- FEMA flood zone
- X (unshaded)
- Chance of flooding over 30 yrs
- 0.0%
- Est. flood insurance / yr
- $473 – $860
Fire risk 1/10 · Minimal
- Est. fire insurance / yr
- $755 – $1,403
Heat risk 8/10 · Major
- Hot days now (above 104°F)
- 7 days/yr
- Hot days in 30 yrs
- 15 days/yr
Wind risk 6/10 · Moderate
- Chance of severe wind over 30 yrs
- 27.0%
Air-quality risk 4/10 · Minor
- Unhealthy air days now
- 4 days/yr
- Unhealthy air days in 30 yrs
- 6 days/yr
Risk factors via First Street. Map © Google.
Why this score? — see what drove the C grade
The composite is a weighted blend of 9 inputs, each scored 0–100. Each bar is that input's sub-score; the figure is the points it added to the 100-point composite (weight × sub-score).
- Cash flow +22.1/30.0
- 1% rule +10.0/10.0
- ARV discount +7.5/15.0
- DSCR +7.1/10.0
- Rent growth +3.7/5.0
- Livability +3.7/5.0
- Schools +2.9/10.0
- Condition / age +2.8/5.0
- Appreciation +0.0/10.0
$96,000
🖨 Deal sheet 📄 Offer letter ✓ Due diligence
Multi-family units
County records classify this as Multi-Family (5+ Unit). Listing-text estimate: 1 unit. estimate disagrees with records
5+ unit building — per-unit beds/baths from public records are typically unavailable; the breakdown below (if shown) is an estimate from the listing text.
Listing remarks
2BR 1Bath condo w garage access. Modern amenities including tile floors, New central AC, Newer kitchen appliances and new washer/dryer.
Key facts
- $350 HOA
- Garage
- Built 1978
Neighborhood map
What this means for you Summary
Snapshot
- This is a 2-bed/1.0-bath multifamily listed at $96k. Condition is rated average.
Deal economics
- At list price, monthly cash flow is $154 ($2k/yr) — positive.
- The deal already cash-flows at list — no discount required.
- Meets the 1% rule at list price ($1k rent vs $96k).
- Recommended offer: $84k (12.0% below list) — sets the bar for market timing.
- Cap rate 8.2% vs local median 5.5% in Edgewood — top-decile yield for the area; either an underpriced asset or a hidden risk that comps aren't pricing in. Stress-test before assuming the spread holds.
Location & tenants
- Location reads 73/100 on livability (#118 in MD, #4,991 nationally) — a middle-class / working-renter tenant base. Strengths: commute A+, housing A+, health & safety A+; Watch: schools D, amenities D, crime F.
- Harford County Public Schools (suburban): math 22% / reading 39% proficiency, ranked #9 of 24 in MD (top 38%) — families likely to look elsewhere, expect single-tenant / working-renter base with shorter leases.
- Market conditions: Rents rising fast (+4.9%/yr); 94 active listings in the ZIP; 7 comparable units currently listed for rent nearby; rentals lingering (median 44d on market — plan ~5-8 weeks vacancy on turnover, expect pricing pressure); 57% of comp listings sitting > 30 days — soft ceiling on asking rent; solid renter incomes; 803 units permitted in Harford County in 2024 (26 in 5+ unit buildings).
Forward outlook
- Local home prices are declining (-3.0%/yr); year-one equity from $664 of loan paydown is wiped out by about $3k of value loss. Plan a longer hold.
- At projected returns (-3.0% appreciation + 4.9% rent growth), your $27k cash investment doubles in ~10 years — after that, you're playing with house money.
Negotiation context
- It's been on market 179 days — a 12% lower offer ($84k) is reasonable based on typical stale-listing flexibility.
- 3 sale attempts; this cycle's ask has dropped $7k (7%) from the opening price — seller is motivated, your offer sets the floor, not the list.
Risks & watch-outs
- Watch-outs: HOA is 24% of rent.
- Climate carrying-cost: major wind risk, 27% chance of damaging wind over 30y; extreme-heat days projected 7→15/yr by 2055 (HVAC capex compounding) — expect insurance premiums to compound above CPI over the hold.
Questions for the listing agent
- It's been on market 179 days. Have you received any prior offers? Is the seller open to a 12% concession, seller financing, or rate buy-down credit?
- Built in 1978 — when were the roof, HVAC, electrical panel, plumbing, and water heater last replaced?
- What does the HOA fee cover, when was the last increase, and are there any pending special assessments or reserve-fund shortfalls?
- Why hasn't it sold? Are there any deal-killer items the seller is aware of (foundation, flood, title, zoning, code violations)?
- Is there a deadline driving the sale (1031 exchange, divorce, estate, relocation)? That informs how much negotiation room exists.
- Schools are D-rated, which usually means shorter tenancies and higher turnover. Who's the typical renter profile here, and what's been the actual vacancy rate?
- Crime grade is F in this area — have there been break-ins, vandalism, or insurance claims at this property in the last 3 years? What carrier currently insures it and at what premium?
- What's the average days-on-market for RENTAL listings here right now (not sales)? A rising rental-DOM trend means longer vacancies and softer asking-rent achievability than the comps imply.
- What's the recent tenant-quality profile in this submarket — average credit score on applications, eviction rate, late-payment / NSF rate, and stable-employment percentage? A property-management company in the area should have these aggregated.
- How much new apartment / multifamily construction is in the pipeline within 1–3 miles? Heavy new supply (>2% of stock underway) typically softens rents 12–24 months out; light construction supports rent growth.
Investment metrics
- 1% rule
- 1.54% ✓
- Cap rate
- 8.22%
- Cash-on-cash
- 6.89%
- DSCR
- 1.31
- GRM
- 5.4
CMA / ARV
No comps found within radius.
Projected returns pro-forma
-3.0% appreciation · 4.92% rent growth · sell at horizon
- IRR
- -2.5%
- Equity multiple
- 0.90×
- Total profit
- $-2,581
- Equity at exit
- $14,314
- IRR
- 10.1%
- Equity multiple
- 1.89×
- Total profit
- $23,790
- Equity at exit
- $8,300
Cash invested: $26,880 (down + closing). Projections, not guarantees.
Landlord ↔ Tenant lean methodology
- Overall (STATE)
- 27 Tenant-Leaning
- State Maryland
- 27 Tenant-Leaning · D+14
- County
- — inherits STATE
- City
- — inherits STATE
ZIP-level market 21040
- Home prices YoY
- -29.4%
- Rents YoY
- 4.9%
- Active inventory
- 94
- Price-to-rent
- 5.4×
Monthly cashflow live
- Estimated rent
- $1,478 high interval (Pro) →
- Mortgage (P&I)
- −$503
- Tax est. 1.5%
- −$120 /mo · $1,440/yr
- Insurance
- −$40
- HOA
- −$350
- Vacancy / Maint / Mgmt
- −$310
- Net cashflow
- $154
Break-even live
UW: 25.0% down · 7.5% · 30yr · 1.5% tax · 5.0% vac · 8.0% maint · 8.0% mgmt
Financing live
Cash to close
- Down payment
- $24,000
- Closing costs
- $2,880
- Reserves months
- —
- Total cash needed
- —
Loan-product check · same deal, 3 products live
Conventional
25% down · 7.5% · 30yr
- Down + closing
- —
- Monthly P&I
- —
- Monthly cashflow
- —
- DSCR
- —
- Eligible?
- —
Personal DTI + credit; lowest rate.
DSCR
20% down · 8.5% · 30yr
- Down + closing
- —
- Monthly P&I
- —
- Monthly cashflow
- —
- DSCR
- —
- Eligible?
- —
No personal income docs; deal must DSCR.
Hard money
10% down · 12.0% · 12mo
- Down + closing
- —
- Monthly P&I
- —
- Monthly cashflow
- —
- DSCR
- —
- Eligible?
- —
Short-term bridge; refi at stabilization.
Rent comps 7 comps
| Address | Beds | Baths | Sqft | Rent | $/sqft | DOM | Units | Dist |
|---|---|---|---|---|---|---|---|---|
| 814 Windstream Way Unit 814-A Edgewood, MD | 1.0 | 1.0 | 882 | $1,200 | $1.36 | 43d | 1 | 0.02mi |
| 1703 Fountain Rock Way Unit 1703-B Edgewood, MD | 2.0 | 1.0 | 882 | $1,250 | $1.42 | 23d | 1 | 0.21mi |
| 802 Kingston Ct Edgewood, MD | 1.0–3.0 | 1.0–1.5 | 1007 | $1,660 | $1.65 | 1d | 15 | 0.27mi |
| 905 Swallow Crest Ct Unit E Edgewood, MD | 2.0 | 1.0 | 990 | $1,495 | $1.51 | 43d | 1 | 0.32mi |
| 1772 Judy Way Edgewood, MD | 3.0 | 1.5 | 1040 | $2,195 | $2.11 | 43d | 1 | 0.50mi |
| 2120 Cedar Dr Apt F Edgewood, MD | 3.0 | 1.5 | 1000 | $1,295 | $1.29 | 43d | 1 | 1.36mi |
| 2033 Armstrong St Edgewood, MD | 1.0–4.0 | 1.0–2.0 | 1000 | $1,557 | $1.56 | 1d | 6 | 1.41mi |
HOA detail
- Monthly dues
- $350 · $4,200/yr
Listing history 12 events
-
2026-06-07pricedays on market $96,000 Active 179 DOM
-
2026-06-04days on market $97,000 Active 176 DOM
-
2026-06-03days on market $97,000 Active 175 DOM
-
2026-06-02days on market $97,000 Active 174 DOM
-
2026-06-01days on market $97,000 Active 173 DOM
-
2026-05-31days on market $97,000 Active 172 DOM
-
2026-05-08status Active
-
2026-05-03historical
-
2026-01-06price $99,000
-
2026-01-06status Active
-
2025-12-28historical
-
2025-11-27$103,000 Active
ⓘ Source: listings_history table (triggers on properties + properties_extension) + one-shot
backfill from property_details.listing_events for pre-trigger history.
Climate risk First Street
- Flood 1/10 Low FEMA zone X (unshaded) · 0% chance over 30 yrs
- Wildfire 1/10 Low
- Heat 8/10 Severe 7 d/yr ≥104°F today · 15 d/yr by 30 yrs out
- Wind 6/10 Major 27% chance of damaging wind over 30 yrs
- Air quality 4/10 Moderate 4 unhealthy d/yr today · 6 by 30 yrs out
Nearby sold comps map
Loading sold comps map…
Walkable amenities ~0.75 mi
Loading nearby amenities…
Taxation est. · year 1
- Rental income
- $17,738
- − Mortgage interest
- −$5,377
- − Property taxes
- −$1,440
- − Insurance
- −$480
- − Repairs & maintenance
- −$1,419
- − Management
- −$1,419
- − HOA
- −$4,200
- − Depreciation
- −$2,793
- Taxable income
- $609
- Est. tax owed @ 24.0%
- −$146
- After-tax cash flow
- $1,705/yr
For passive investors: Depreciation is non-cash, so a rental often shows a tax loss while cash-flowing — sheltering income. Rental losses are passive: they offset passive income freely, and up to $25,000/yr can offset ordinary (W-2) income if you actively participate and your MAGI is under $100k (phasing out to $0 by $150k); unused losses carry forward. On sale, claimed depreciation is recaptured at up to 25%, and gains may owe capital-gains tax (a 1031 exchange can defer both). Figures are a year-1 estimate at your 24.0% rate — not tax advice; consult a CPA.
Condition & rehab AI · 12 photos
A moderate rehab project is needed to address major roof and exterior issues, while updating the kitchen and enhancing curb appeal will significantly boost its value.
Repairs flagged
- Major roof — visible wear
- Major exterior siding — gray siding with discoloration
- Minor kitchen cabinets — existing but dated design
Value-add opportunities
- Both new roof — major safety and aesthetic improvement
- Both new exterior siding — enhances curb appeal and durability
- Both new kitchen cabinets — modernizes space and increases functionality
Renovation cost estimate screening
| Repair item | Severity | Est. cost |
|---|---|---|
| roof · visible wear | Major | $15,000–50,000 |
| exterior siding · gray siding with discoloration | Major | $15,000–50,000 |
| kitchen cabinets · existing but dated design | Minor | $500–3,000 |
| Total estimated repair cost · 3 items | $30,500–103,000 |
Value-add ROI direction
- Both new roof — major safety and aesthetic improvement ↑
- Both new exterior siding — enhances curb appeal and durability ↑
- Both new kitchen cabinets — modernizes space and increases functionality ↑
ⓘ Cost ranges are severity-bucket heuristics (US national rule-of-thumb). Get contractor quotes + a written scope before underwriting a rehab budget.
Schools (NCES district)
- District
- Harford County Public Schools
- NCES district ID
- 2400390
- Math proficiency
- 22% ▼ -23.00%
- Reading proficiency
- 39% ▼ -12.00%
- Median HH income
- $79,569
- Composite
- 29.38/100
- National rank
- #6527
- State rank
- #9 of 24 in MD
Livability — Edgewood
- Score
- 73/100
- State rank
- #118
- US rank
- #4991
Category grades
Schools grade is shown separately in the Schools card above.
Census & demographics
- Census place
- Edgewood, MD
- County
- Harford County · 198,512 people
- City population
- 24,960
- Metro
- Baltimore-Columbia-Towson, MD
- Population (ZIP)
- 24,960
- Household income
- $81,704
- Rent vs Own
- Severe rent burden
- 859.0
Population outlook (Harford County) Hauer SSP2
- Today (2025)
- 262,292 people
- By 2030
- 266,437 · +1.6%
- By 2040
- 269,954 · +2.9%
- By 2050
- 265,659 · +1.3%
- By 2075
- 252,886 · -3.6%
- By 2100
- 224,014 · -14.6%
Race, ethnicity, and origin ACS 2023
- Neighborhood character
- Diverse neighborhood (Simpson 0.66)
- Race & ethnicity
- Black 45% White 36% Two or more races 11% Hispanic / Latino 10% Asian 2%
- Hispanic origin (detail)
- Mexican 1% Puerto Rican 2%
- Common ancestry
- Romanian 4% Slovak 1% Italian 1%
- Foreign-born
- 8% · Canada, South Korea
- Languages at home
- 89% English-only · Spanish 5% Russian/Polish/Slavic 2% German/W. Germanic 1%
Political lean MEDSL · Harford
- 2024 margin
- R (+13.8) · D 41.9% · R 55.7% · Other 2.4%
- 2008→2024 swing
- +5.0pp toward D · 2008: -18.8pp · 2024: -13.8pp
- All cycles
- 2024: R+13.8 2020: R+12.0 2016: R+24.5 2012: R+19.5 2008: R+18.8
Not yet ingested
- Civics
- —
Market trends
- HPI YoY
- ▼ -106.14%
- Current HPI
- 254.2305
- Rent YoY
- ▲ 4.92%
- Metro
- Baltimore-Columbia-Towson, MD
- State GDP YoY
- ▲ 2.97%
- F500 in state
- 12
Industry mix (Fortune 500 HQ in MD)
| Industry | F500 HQs | Revenue |
|---|---|---|
| Aerospace / Defense | 1 | $71B |
|
||
| Utilities | 1 | $25B |
|
||
| Hotels | 1 | $24B |
|
||
| Consumer Goods | 1 | $7B |
|
||
| Real Estate | 1 | $6B |
|
||
| Chemicals | 1 | $2B |
|
||
Price history
-3.9% since first listed6 events — show timeline
- 2026-05-08 Relisted — BRIGHT MLS
- 2026-05-03 Listing Removed — BRIGHT MLS
- 2026-01-06 Price Changed $99,000 BRIGHT MLS
- 2026-01-06 Relisted — BRIGHT MLS
- 2025-12-28 Listing Removed — BRIGHT MLS
- 2025-11-27 Listed $103,000 BRIGHT MLS
Cash-flow waterfall
monthlySold comps — $/sqft
last 12 mo · ≤1 miLoading sold comps…