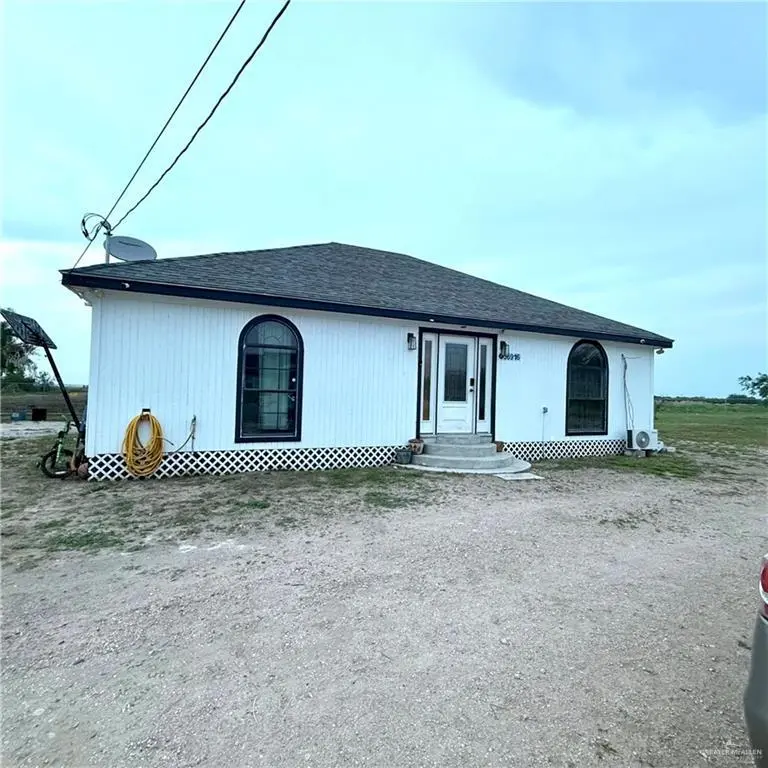
36916 Cohiba St · Citrus City, TX
Flood risk 1/10 · Minimal
- FEMA flood zone
- X
- Chance of flooding over 30 yrs
- 0.0%
- Est. flood insurance / yr
- $507 – $1,088
Fire risk 8/10 · Major
- Est. fire insurance / yr
- $1,222 – $2,270
Heat risk 9/10 · Severe
- Hot days now (above 112°F)
- 7 days/yr
- Hot days in 30 yrs
- 22 days/yr
Wind risk 8/10 · Major
- Chance of severe wind over 30 yrs
- 98.0%
Air-quality risk 1/10 · Minimal
- Unhealthy air days now
- 0 days/yr
- Unhealthy air days in 30 yrs
- 0 days/yr
Risk factors via First Street. Map © Google.
Why this score? — see what drove the D+ grade
The composite is a weighted blend of 9 inputs, each scored 0–100. Each bar is that input's sub-score; the figure is the points it added to the 100-point composite (weight × sub-score).
- ARV discount +15.0/15.0
- Cash flow +14.9/30.0
- DSCR +4.6/10.0
- 1% rule +4.4/10.0
- Livability +2.8/5.0
- Rent growth +2.5/5.0
- Condition / age +2.5/5.0
- Schools +1.9/10.0
- Appreciation +0.0/10.0
$159,000
🖨 Deal sheet (PDF) 📄 Offer letter ✓ Due diligence
Listing remarks
Escape to the tranquility of country living with this inviting 3-bedroom, 2-bath home set on a spacious rural property. Designed for comfort and functionality, the home features an open living and kitchen area ideal for everyday living and entertaining. A covered metal patio/carport creates the perfect outdoor gathering space, while mature trees enhance the property’s natural beauty and provide plenty of shade. With ample outdoor space for parking, recreation, or future possibilities, this property offers the peaceful lifestyle you’ve been looking for while remaining conveniently located near town amenities.
Key facts
- Covered metal patio
- Outdoor space
- Mature trees
Tags
Property features AI
Finance
- HOA & community: No association
Exterior
- Parking: No garage / no covered parking
- Utilities: City sewer
- Home design: Single-story (1,280 total building area); Frame/wood construction; Pillar/post/pier foundation
- Construction: Frame/wood construction; Shingle roof; Pillar/post/pier foundation
- Exterior features: Chain link fencing; Covered patio; Corner lot; Mature trees; Paved road access; Shingle roof
Interior
- Kitchen: Electric water heater; No conveying appliances
- Bedrooms: Master bedroom with walk-in closet(s)
- Flooring: Tile
- Bathrooms: 2 full bathrooms
- Heating & cooling: Central heating; Central air conditioning
- Interior features: Entrance foyer; Granite countertops; Ceiling fans; Walk-in closet(s); No window coverings
- Laundry & utility: Laundry area with washer/dryer connection
Neighborhood map
What this means for you Summary
Snapshot
- This is a 2-bed/1.0-bath single-family listed at $159k.
Deal economics
- At list price, monthly cash flow is $46 ($553/yr) — positive.
- The deal already cash-flows at list — no discount required.
- To meet the 1% rule (rent ≥ 1% of price), the offer needs to be $149k (6.0% below list).
- Recommended offer: $149k (6.0% below list) — sets the bar for 1% rule.
Location & tenants
- Location reads 55/100 on livability (#1,366 in TX) — a working-class tenant base; expect higher turnover. Strengths: cost of living A+, housing A, crime B; Watch: amenities F, commute F, employment F.
- La Joya ISD (suburban): math 18% / reading 29% proficiency, ranked #759 of 826 in TX (top 92%) — low school quality limits family demand, transient renter base, plan for 1-2y turnover.
- Zoned schools: Dr Maria Palmira Mendiola El (math 14% / reading 30%, grade F, #3,333 of 4,322 statewide, top 80%, 594 students, 98% FRL); Dr Javier Saenz Middle (math 10% / reading 19%, grade F, #1,583 of 1,662 statewide, top 96%, 655 students, 99% FRL); La Joya H S (math 16% / reading 32%, grade F, #1,333 of 1,632 statewide, top 82%, 2,775 students, 92% FRL) — zoned schools average 96% FRL vs 54% district-wide (43 pts higher); higher-poverty schools than district average — tighter screening recommended.
- Market conditions: 477 active listings in the ZIP; 7,378 units permitted in Hidalgo County in 2024 (641 in 5+ unit buildings).
- This rent runs 34% of the median local income ($52k/yr) — at the standard rent-burdened threshold; future hikes will face affordability resistance.
Forward outlook
- Local home prices are declining (-3.0%/yr); year-one equity from $1k of loan paydown is wiped out by about $5k of value loss. Plan a longer hold.
- Hidalgo County population projected at +28% by 2050 — long-run rental-demand tailwind backs the buy-and-hold thesis.
Negotiation context
- It's been on market 38 days — a 3% lower offer ($154k) is reasonable based on typical stale-listing flexibility.
Risks & watch-outs
- Climate carrying-cost: severe wind risk, 98% chance of damaging wind over 30y; severe wildfire risk; extreme-heat days projected 7→22/yr by 2055 (HVAC capex compounding) — expect insurance premiums to compound above CPI over the hold.
Questions for the listing agent
- It's been on market 38 days. Have you received any prior offers? Is the seller open to a 6% concession, seller financing, or rate buy-down credit?
- Is there a deadline driving the sale (1031 exchange, divorce, estate, relocation)? That informs how much negotiation room exists.
- Schools are F-rated, which usually means shorter tenancies and higher turnover. Who's the typical renter profile here, and what's been the actual vacancy rate?
- The area grade is low — what's the realistic commute time and amenity access for the typical tenant pool here? Any planned neighborhood developments (good or bad) we should know about?
- What's the average days-on-market for RENTAL listings here right now (not sales)? A rising rental-DOM trend means longer vacancies and softer asking-rent achievability than the comps imply.
- What's the recent tenant-quality profile in this submarket — average credit score on applications, eviction rate, late-payment / NSF rate, and stable-employment percentage? A property-management company in the area should have these aggregated.
- How much new for-sale + rental construction is in the pipeline within 1–3 miles? Heavy new supply typically softens prices + rents 12–24 months out; constrained supply supports both.
Investment metrics
- 1% rule
- 0.94% ✗
- Cap rate
- 6.64%
- Cash-on-cash
- 1.24%
- DSCR
- 1.06
- GRM
- 8.9
CMA / ARV
- ARV (median comp)
- $232,378
- List price
- $159,000
- Delta
- -31.58%
- Verdict
- UNDERPRICED
- Comps
- 9 within 2.0 mi
Projected returns pro-forma
-3.0% appreciation · 3.0% rent growth · sell at horizon
- IRR
- -14.3%
- Equity multiple
- 0.49×
- Total profit
- $-22,787
- Equity at exit
- $23,707
- IRR
- -5.5%
- Equity multiple
- 0.64×
- Total profit
- $-15,885
- Equity at exit
- $13,747
Cash invested: $44,520 (down + closing). Projections, not guarantees.
Landlord ↔ Tenant lean methodology
- Overall (STATE)
- 87 Strongly Landlord-Friendly
- State Texas
- 87 Strongly Landlord-Friendly · R+5
- County
- — inherits STATE
- City
- — inherits STATE
ZIP-level market 78574
- Home prices YoY
- -16.1%
- Active inventory
- 477
- Price-to-rent
- 8.9×
Monthly cashflow live
- Estimated rent
- $1,495 medium interval (Pro) →
- Mortgage (P&I)
- −$834
- Tax from tax record
- −$235 /mo · $2,815/yr
- Insurance
- −$66
- HOA
- −$0
- Vacancy / Maint / Mgmt
- −$314
- Net cashflow
- $46
Break-even live
Sensitivity live
| Price | -10% $136 | -5% $91 | +0% $46 | +5% $1 | +10% $-44 |
|---|---|---|---|---|---|
| Rent | -10% $-72 | -5% $-13 | +0% $46 | +5% $105 | +10% $164 |
| Rate | -1.0pp $126 | -0.5pp $86 | base $46 | +0.5pp $5 | +1.0pp $-37 |
UW: 25.0% down · 7.5% · 30yr · 1.5% tax · 5.0% vac · 8.0% maint · 8.0% mgmt
Financing live
Cash to close
- Down payment
- $39,750
- Closing costs
- $4,770
- Reserves months
- —
- Total cash needed
- —
Loan-product check · same deal, 3 products live
Conventional
25% down · 7.5% · 30yr
- Down + closing
- —
- Monthly P&I
- —
- Monthly cashflow
- —
- DSCR
- —
- Eligible?
- —
Personal DTI + credit; lowest rate.
DSCR
20% down · 8.5% · 30yr
- Down + closing
- —
- Monthly P&I
- —
- Monthly cashflow
- —
- DSCR
- —
- Eligible?
- —
No personal income docs; deal must DSCR.
Hard money
10% down · 12.0% · 12mo
- Down + closing
- —
- Monthly P&I
- —
- Monthly cashflow
- —
- DSCR
- —
- Eligible?
- —
Short-term bridge; refi at stabilization.
Listing history 19 events
-
2026-06-22days on market $159,000 Active 38 DOM
-
2026-06-18days on market $159,000 Active 35 DOM
-
2026-06-17days on market $159,000 Active 34 DOM
-
2026-06-16days on market $159,000 Active 33 DOM
-
2026-06-15days on market $159,000 Active 32 DOM
-
2026-06-14days on market $159,000 Active 30 DOM
-
2026-06-13days on market $159,000 Active 29 DOM
-
2026-06-10days on market $159,000 Active 27 DOM
-
2026-06-09days on market $159,000 Active 26 DOM
-
2026-06-08days on market $159,000 Active 25 DOM
-
2026-06-07days on market $159,000 Active 24 DOM
-
2026-06-05days on market $159,000 Active 21 DOM
-
2026-06-03days on market $159,000 Active 20 DOM
-
2026-06-02days on market $159,000 Active 19 DOM
-
2026-06-01days on market $159,000 Active 18 DOM
-
2026-05-31days on market $159,000 Active 17 DOM
-
2026-05-31days on market $159,000 Active 16 DOM
-
2026-05-14$159,000 Active 627-char remark
-
2018-05-01soldstatus
ⓘ Source: listings_history table (triggers on properties + properties_extension) + one-shot
backfill from property_details.listing_events for pre-trigger history.
Tax reassessment forecast TX · Resets to sale price
- Current annual tax
- $2,815 · $235/mo
- Projected year-2 tax
- $2,910 · $242/mo
- Expected delta
- +$95/yr (+$8/mo · 3.4%)
ⓘ Screening estimate from a state-policy table — verify with the county assessor before closing.
Climate risk First Street
- Flood 1/10 Low FEMA zone X · 0% chance over 30 yrs
- Wildfire 8/10 Severe
- Heat 9/10 Extreme 7 d/yr ≥112°F today · 22 d/yr by 30 yrs out
- Wind 8/10 Severe 98% chance of damaging wind over 30 yrs
- Air quality 1/10 Low 0 unhealthy d/yr today · 0 by 30 yrs out
Nearby sold comps map
Loading sold comps map…
Walkable amenities ~0.75 mi
Loading nearby amenities…
Taxation est. · year 1
- Rental income
- $17,934
- − Mortgage interest
- −$8,906
- − Property taxes
- −$2,815
- − Insurance
- −$795
- − Repairs & maintenance
- −$1,435
- − Management
- −$1,435
- − Depreciation
- −$4,625
- Taxable loss
- −$2,077
- Est. tax savings @ 24.0%
- +$498
- After-tax cash flow
- $1,051/yr
For passive investors: Depreciation is non-cash, so a rental often shows a tax loss while cash-flowing — sheltering income. Rental losses are passive: they offset passive income freely, and up to $25,000/yr can offset ordinary (W-2) income if you actively participate and your MAGI is under $100k (phasing out to $0 by $150k); unused losses carry forward. On sale, claimed depreciation is recaptured at up to 25%, and gains may owe capital-gains tax (a 1031 exchange can defer both). Figures are a year-1 estimate at your 24.0% rate — not tax advice; consult a CPA.
Schools (NCES district)
- District
- La Joya ISD
- NCES district ID
- 4826130
- Math proficiency
- 18% ▼ -35.00%
- Reading proficiency
- 29% ▼ -10.00%
- Median HH income
- $27,845
- Composite
- 18.65/100
- National rank
- #8891
- State rank
- #759 of 826 in TX
Livability — Citrus City
- Score
- 55/100
- State rank
- #1366
- US rank
- #23499
Category grades
Schools grade is shown separately in the Schools card above.
Census & demographics
- County
- Hidalgo County · 623,128 people
- Metro
- McAllen-Edinburg-Mission, TX
- Population (ZIP)
- 62,456
- Household income
- $52,393
- Rent vs Own
- Severe rent burden
- 803.0
Population outlook (Hidalgo County) Hauer SSP2
- Today (2025)
- 955,232 people
- By 2030
- 1,009,774 · +5.7%
- By 2040
- 1,120,332 · +17.3%
- By 2050
- 1,225,036 · +28.2%
- By 2075
- 1,439,189 · +50.7%
- By 2100
- 1,533,429 · +60.5%
Race, ethnicity, and origin ACS 2023
- Neighborhood character
- Predominantly Hispanic (97%)
- Race & ethnicity
- Hispanic / Latino 97% Two or more races 62% White 2%
- Hispanic origin (detail)
- Mexican 93%
- Foreign-born
- 33% · Canada
- Languages at home
- 12% English-only · Spanish 87%
Political lean MEDSL · Hidalgo
- 2024 margin
- Toss-up / Even · D 48.1% · R 51.0%
- 2008→2024 swing
- -41.6pp toward R · 2008: 38.7pp · 2024: -2.9pp
- All cycles
- 2024: R+2.9 2020: D+17.1 2016: D+40.5 2012: D+41.8 2008: D+38.7
Not yet ingested
- Civics
- —
Market trends
- HPI YoY
- ▼ -44.13%
- Current HPI
- 230.3323
- Rent YoY
- —
- Metro
- McAllen-Edinburg-Mission, TX
- State GDP YoY
- ▲ 3.95%
- F500 in state
- 110
Industry mix (Fortune 500 HQ in TX)
| Industry | F500 HQs | Revenue |
|---|---|---|
| Energy | 16 | $1,198B |
|
||
| Technology | 5 | $198B |
|
||
| Engineering / Construction | 4 | $72B |
|
||
| Energy Services | 3 | $60B |
|
||
| Utilities | 3 | $41B |
|
||
| Healthcare | 2 | $330B |
|
||
Price history
2 events — show timeline
- 2026-05-14 Listed $159,000 MCALLENMLS
- 2018-05-01 Sold (Public Records) — Public Records
Property tax history
+17.4%/yrLatest (2025): $2,815 · +34.8% YoY. Source: county tax records.
Cash-flow waterfall
monthlySold comps — $/sqft
last 12 mo · ≤1 miLoading sold comps…