 8-Plex
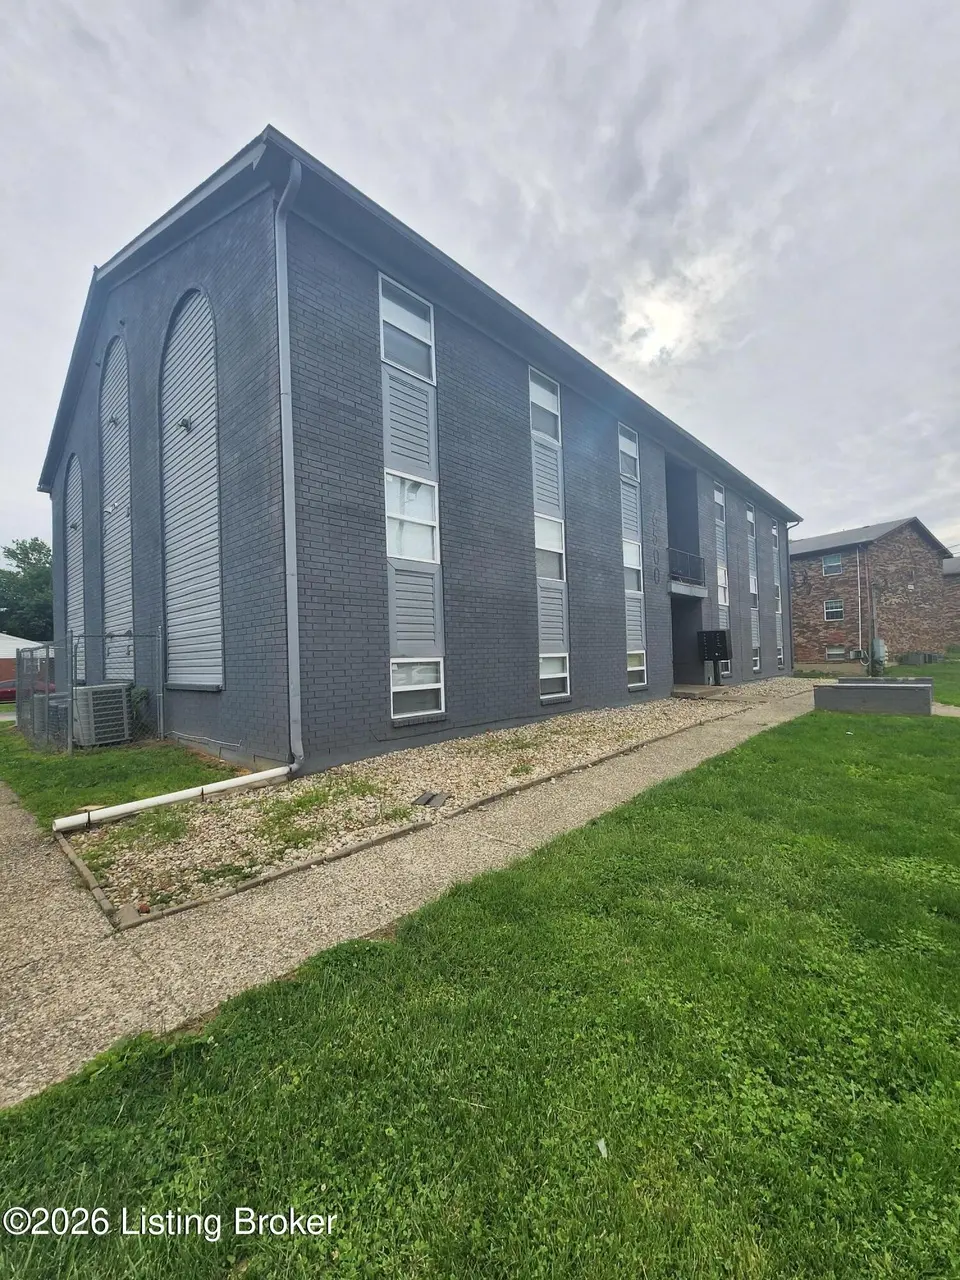
6500 Hackel Dr · Louisville/Jefferson County metro government (balance), KY
Flood risk 1/10 · Minimal
- FEMA flood zone
- X (shaded)
- Chance of flooding over 30 yrs
- 0.0%
- Est. flood insurance / yr
- $507 – $1,088
Fire risk 1/10 · Minimal
- Est. fire insurance / yr
- $839 – $1,559
Heat risk 5/10 · Moderate
- Hot days now (above 104°F)
- 7 days/yr
- Hot days in 30 yrs
- 20 days/yr
Wind risk 2/10 · Minimal
- Chance of severe wind over 30 yrs
- 2.0%
Air-quality risk 3/10 · Minor
- Unhealthy air days now
- 2 days/yr
- Unhealthy air days in 30 yrs
- 3 days/yr
Risk factors via First Street. Map © Google.
Why this score? — see what drove the B- grade
The composite is a weighted blend of 9 inputs, each scored 0–100. Each bar is that input's sub-score; the figure is the points it added to the 100-point composite (weight × sub-score).
- Cash flow +30.0/30.0
- DSCR +10.0/10.0
- 1% rule +8.2/10.0
- ARV discount +7.5/15.0
- Rent growth +2.6/5.0
- Livability +2.5/5.0
- Condition / age +2.5/5.0
- Schools +2.3/10.0
- Appreciation +0.0/10.0
$1,140,900
🖨 Deal sheet (PDF) 📄 Offer letter ✓ Due diligence
Multi-family units
County records classify this as Multi-Family (5+ Unit). Listing-text estimate: 8 units. confirmed
5+ unit building — per-unit beds/baths from public records are typically unavailable; the breakdown below (if shown) is an estimate from the listing text.
Listing remarks MLS
SOLID, BRICK 12-PLEX W/HUGE, 24-SLOT PARKING LOT. IN RAPIDLY IMPROVING AREA. *AT LEAST 48 HRS NOTICE TO SHOW.* 2 UNITS VACANT/1 BEING USED FOR STORAGE BUT WILL BE MADE RENT-READY PRIOR TO CLOSING. SOME SEC.8/SOME MARKET. BASED ON $400/UNIT, $4,800/MO. MIN. POSSIBLE. UPSIDE ON RENT GOOD. ALL UNITS HAVE 2 BR/1 BA/LR/DR/KIT. 2nd BR HAS HUGE W/I CLOSET. ALL KITS. W/RANGE & REFRIG. FURNACES, WATER HEATERS & CENTRAL AIR UNITS OF VARIOUS AGES. 8 UNITS HAVE NEWER CARPETING. EXCELLENT POTENTIAL FOR RENT INCREASE TO APPROX. $435/UNIT. DON'T CURB APPRAISE. COULD USE SOME LANDSCAPING & SIGNAGE. NEW CONSTRUCTION ALL AROUND. SEWER HOOK-UP EXPENSE IS NEGOTIABLE. NOTE: SEP. METERS. NEW LAUNDRY BEING BUILT IN AREA.
Key facts
- Washer dryer hookups
- Durable lvp flooring
- 0.29 acre lot
Tags
Property features AI
Finance
- Other: Lot is approximately 0.29 acres with lot dimensions 97.8 x 105.7 x 65.4 x 149.7; Subdivision: HUNTERS HILL; Not in a flood plain
- Financial info: Reported rent values listed per level (same amount for 1st, 2nd and 3rd): 895900.0 (as provided in data)
- HOA & community: No association fee
Exterior
- Parking: 21 parking spaces; No covered parking
- Utilities: Electricity connected; Owner pays water, sewer and trash removal; Tenants pay electric
- Home design: Apartment building; Built in 1974
- Construction: Brick construction; Shingle roof; Building area reported as 10,656 (source: Other)
- Exterior features: No exterior features listed
Interior
- Kitchen: Each unit includes a kitchen; Ranges provided on 1st, 2nd and 3rd levels (4 per level); Refrigerators provided on 1st, 2nd and 3rd levels (4 per level); Dishwashers provided on 1st, 2nd and 3rd levels (4 per level)
- Bedrooms: Total of 24 bedrooms; Each of the 1st, 2nd and 3rd levels contains 8 bedrooms
- Bathrooms: Each of the 1st, 2nd and 3rd levels has 4 full bathrooms; No partial baths reported on any level; No basement bathrooms
- Heating & cooling: Electric heating with forced air; 12 furnaces; Central air conditioning with 12 HVAC units
- Interior features: Apartment property with multiple units; Each floor contains living rooms and dining rooms
- Laundry & utility: Laundry facilities provided on 1st, 2nd and 3rd levels (4 per level); Basement has no laundry
Neighborhood map
What this means for you Summary
Snapshot
- This is a 8 × 3-bed/?-bath units multifamily listed at $1.14M.
Deal economics
- At list price, monthly cash flow is $5k ($56k/yr) — positive. Per door: $583/mo.
- The deal already cash-flows at list — no discount required.
- Meets the 1% rule at list price ($15k rent vs $1.14M).
- Recommended offer: $1.11M (3.0% below list) — sets the bar for market timing.
- Cap rate 11.2% vs local median 4.1% in Louisville/Jefferson County metro government (balance) — top-decile yield for the area; either an underpriced asset or a hidden risk that comps aren't pricing in. Stress-test before assuming the spread holds.
Location & tenants
- Location reads: area grade B — affects rentability + tenant quality, not the cash-flow math above.
- Jefferson County (urban): math 19% / reading 35% proficiency, ranked #121 of 165 in KY (top 73%) — low school quality limits family demand, transient renter base, plan for 1-2y turnover.
- Zoned schools: Sanders Elementary (math 8% / reading 22%, grade F, #620 of 676 statewide, top 93%, 430 students, 78% FRL); Conway Middle (math 4% / reading 20%, grade F, #215 of 217 statewide, top 99%, 730 students, 72% FRL); Western High (math 2% / reading 12%, grade F, #248 of 254 statewide, top 98%, 869 students, 77% FRL) — zoned schools average 76% FRL vs 56% district-wide (20 pts higher); higher-poverty schools than district average — tighter screening recommended.
- Zoned-school proficiency averages 11% at this address vs 27% district-wide (-16 pts) — the specific schools serving this property underperform the Jefferson County average; the district grade overstates school quality for this exact location.
- Market conditions: Rents flat; 127 active listings in the ZIP; 2,836 units permitted in Jefferson County in 2024 (1,558 in 5+ unit buildings).
- At $15,039/mo this rent would consume 265% of the median local household income ($68k/yr) (locally 839% of renters already pay >50% of income on rent) — very limited rent-growth headroom before tenants either downsize or default.
Forward outlook
- Local home prices are declining (-3.0%/yr); year-one equity from $8k of loan paydown is wiped out by about $34k of value loss. Plan a longer hold.
- Jefferson County population projected at +13% by 2050 — modest demand growth; plan on rents tracking national, not racing it.
- At projected returns (-3.0% appreciation + 0.5% rent growth), your $319k cash investment doubles in ~9 years — after that, you're playing with house money.
Negotiation context
- It's been on market 39 days — a 3% lower offer ($1.11M) is reasonable based on typical stale-listing flexibility.
- 5 sale attempts since 24y ago; this cycle's ask has dropped $83k (7%) from the opening price — seller is motivated, your offer sets the floor, not the list.
Risks & watch-outs
- Climate carrying-cost: extreme-heat days projected 7→20/yr by 2055 (HVAC capex compounding) — expect insurance premiums to compound above CPI over the hold.
Questions for the listing agent
- It's been on market 39 days. Have you received any prior offers? Is the seller open to a 3% concession, seller financing, or rate buy-down credit?
- Can we see the unit-by-unit rent roll, current vacancy, and any below-market leases? What's the average tenancy length?
- What capital expenditures (roof, boiler, parking lot, exteriors) have been made in the last 5 years, and what's planned in the next 2?
- Built in 1974 — when were the roof, HVAC, electrical panel, plumbing, and water heater last replaced?
- Is there a deadline driving the sale (1031 exchange, divorce, estate, relocation)? That informs how much negotiation room exists.
- What's the average days-on-market for RENTAL listings here right now (not sales)? A rising rental-DOM trend means longer vacancies and softer asking-rent achievability than the comps imply.
- What's the recent tenant-quality profile in this submarket — average credit score on applications, eviction rate, late-payment / NSF rate, and stable-employment percentage? A property-management company in the area should have these aggregated.
- How much new apartment / multifamily construction is in the pipeline within 1–3 miles? Heavy new supply (>2% of stock underway) typically softens rents 12–24 months out; light construction supports rent growth.
Investment metrics
- 1% rule
- 1.32% ✓
- Cap rate
- 11.20%
- Cash-on-cash
- 17.51%
- DSCR
- 1.78
- GRM
- 6.3
CMA / ARV
No comps found within radius.
Projected returns pro-forma
-3.0% appreciation · 0.5% rent growth · sell at horizon
- IRR
- 6.2%
- Equity multiple
- 1.23×
- Total profit
- $74,996
- Equity at exit
- $170,112
- IRR
- 13.3%
- Equity multiple
- 1.95×
- Total profit
- $302,895
- Equity at exit
- $98,644
Cash invested: $319,452 (down + closing). Projections, not guarantees.
Landlord ↔ Tenant lean methodology
- Overall (STATE)
- 83 Strongly Landlord-Friendly
- State Kentucky
- 83 Strongly Landlord-Friendly · R+16
- County
- — inherits STATE
- City
- — inherits STATE
ZIP-level market 40258
- Rents YoY
- 0.5%
- Active inventory
- 127
- Price-to-rent
- 50.6×
Monthly cashflow live
- Estimated rent
- $15,039 medium interval (Pro) →
- Mortgage (P&I)
- −$5,983
- Tax from tax record
- −$760 /mo · $9,118/yr
- Insurance
- −$475
- HOA
- −$0
- Lot rent
- −$0
- Vacancy / Maint / Mgmt
- −$3,158
- Net cashflow
- $4,663
Break-even live
Sensitivity live
| Price | -10% $5,308 | -5% $4,986 | +0% $4,663 | +5% $4,340 | +10% $4,017 |
|---|---|---|---|---|---|
| Rent | -10% $3,475 | -5% $4,069 | +0% $4,663 | +5% $5,257 | +10% $5,851 |
| Rate | -1.0pp $5,237 | -0.5pp $4,953 | base $4,663 | +0.5pp $4,367 | +1.0pp $4,066 |
8-unit breakdown (identical units grouped — click to expand)
| Units | Beds | Baths | Est. rent |
|---|---|---|---|
| 8× units | 3 | — | $15,040 |
| #1 | 3 | — | $1,880 |
| #2 | 3 | — | $1,880 |
| #3 | 3 | — | $1,880 |
| #4 | 3 | — | $1,880 |
| #5 | 3 | — | $1,880 |
| #6 | 3 | — | $1,880 |
| #7 | 3 | — | $1,880 |
| #8 | 3 | — | $1,880 |
| Total (8 units) | $15,039 | ||
UW: 25.0% down · 7.5% · 30yr · 1.5% tax · 5.0% vac · 8.0% maint · 8.0% mgmt
Financing live
Cash to close
- Down payment
- $285,225
- Closing costs
- $34,227
- Reserves months
- —
- Total cash needed
- —
Loan-product check · same deal, 3 products live
Conventional
25% down · 7.5% · 30yr
- Down + closing
- —
- Monthly P&I
- —
- Monthly cashflow
- —
- DSCR
- —
- Eligible?
- —
Personal DTI + credit; lowest rate.
DSCR
20% down · 8.5% · 30yr
- Down + closing
- —
- Monthly P&I
- —
- Monthly cashflow
- —
- DSCR
- —
- Eligible?
- —
No personal income docs; deal must DSCR.
Hard money
10% down · 12.0% · 12mo
- Down + closing
- —
- Monthly P&I
- —
- Monthly cashflow
- —
- DSCR
- —
- Eligible?
- —
Short-term bridge; refi at stabilization.
Listing history 29 events
-
2026-06-22days on market $1,140,900 Active 39 DOM
-
2026-06-21days on market $1,140,900 Active 38 DOM
-
2026-06-18days on market $1,140,900 Active 35 DOM
-
2026-06-17days on market $1,140,900 Active 34 DOM
-
2026-06-16days on market $1,140,900 Active 33 DOM
-
2026-06-15days on market $1,140,900 Active 32 DOM
-
2026-06-13pricedays on market $1,140,900 Active 30 DOM
-
2026-06-10days on market $1,223,900 Active 27 DOM
-
2026-06-09days on market $1,223,900 Active 26 DOM
-
2026-06-08days on market $1,223,900 Active 25 DOM
-
2026-06-07days on market $1,223,900 Active 24 DOM
-
2026-06-03days on market $1,223,900 Active 20 DOM
-
2026-06-02days on market $1,223,900 Active 19 DOM
-
2026-06-01days on market $1,223,900 Active 18 DOM
-
2026-05-31days on market $1,223,900 Active 17 DOM
-
2026-05-14$1,223,900 Active
-
2024-10-20historical $895
-
2024-10-20$895
-
2024-10-14historical $895
-
2024-10-13$895
-
2022-12-01soldstatus $1,050,000
-
2021-01-29soldstatus $605,000
-
2015-01-27historical
-
2014-11-03$129,900
-
2014-03-31soldstatus $501,000
-
2008-11-13soldstatus $273,000
-
2007-09-27soldstatus $291,077
-
2002-12-04soldstatus $277,000 719-char remark
Show marketing remark (719 chars)
SOLID, BRICK 12-PLEX W/HUGE, 24-SLOT PARKING LOT. IN RAPIDLY IMPROVING AREA. *AT LEAST 48 HRS NOTICE TO SHOW.* 2 UNITS VACANT/1 BEING USED FOR STORAGE BUT WILL BE MADE RENT-READY PRIOR TO CLOSING. SOME SEC.8/SOME MARKET. BASED ON $400/UNIT, $4,800/MO. MIN. POSSIBLE. UPSIDE ON RENT GOOD. ALL UNITS HAVE 2 BR/1 BA/LR/DR/KIT. 2nd BR HAS HUGE W/I CLOSET. ALL KITS. W/RANGE & REFRIG. FURNACES, WATER HEATERS & CENTRAL AIR UNITS OF VARIOUS AGES. 8 UNITS HAVE NEWER CARPETING. EXCELLENT POTENTIAL FOR RENT INCREASE TO APPROX. $435/UNIT. DON'T CURB APPRAISE. COULD USE SOME LANDSCAPING & SIGNAGE. NEW CONSTRUCTION ALL AROUND. SEWER HOOK-UP EXPENSE IS NEGOTIABLE. NOTE: SEP. METERS. NEW LAUNDRY BEING BUILT IN AREA.
-
2002-10-21$314,900 719-char remark
Show marketing remark (719 chars)
SOLID, BRICK 12-PLEX W/HUGE, 24-SLOT PARKING LOT. IN RAPIDLY IMPROVING AREA. *AT LEAST 48 HRS NOTICE TO SHOW.* 2 UNITS VACANT/1 BEING USED FOR STORAGE BUT WILL BE MADE RENT-READY PRIOR TO CLOSING. SOME SEC.8/SOME MARKET. BASED ON $400/UNIT, $4,800/MO. MIN. POSSIBLE. UPSIDE ON RENT GOOD. ALL UNITS HAVE 2 BR/1 BA/LR/DR/KIT. 2nd BR HAS HUGE W/I CLOSET. ALL KITS. W/RANGE & REFRIG. FURNACES, WATER HEATERS & CENTRAL AIR UNITS OF VARIOUS AGES. 8 UNITS HAVE NEWER CARPETING. EXCELLENT POTENTIAL FOR RENT INCREASE TO APPROX. $435/UNIT. DON'T CURB APPRAISE. COULD USE SOME LANDSCAPING & SIGNAGE. NEW CONSTRUCTION ALL AROUND. SEWER HOOK-UP EXPENSE IS NEGOTIABLE. NOTE: SEP. METERS. NEW LAUNDRY BEING BUILT IN AREA.
ⓘ Source: listings_history table (triggers on properties + properties_extension) + one-shot
backfill from property_details.listing_events for pre-trigger history.
Tax reassessment forecast KY · Resets to sale price
- Current annual tax
- $9,118 · $760/mo
- Projected year-2 tax
- $9,812 · $818/mo
- Expected delta
- +$694/yr (+$58/mo · 7.6%)
ⓘ Screening estimate from a state-policy table — verify with the county assessor before closing.
Climate risk First Street
- Flood 1/10 Low FEMA zone X (shaded) · 0% chance over 30 yrs
- Wildfire 1/10 Low
- Heat 5/10 Major 7 d/yr ≥104°F today · 20 d/yr by 30 yrs out
- Wind 2/10 Low 2% chance of damaging wind over 30 yrs
- Air quality 3/10 Moderate 2 unhealthy d/yr today · 3 by 30 yrs out
Nearby sold comps map
Loading sold comps map…
Walkable amenities ~0.75 mi
Loading nearby amenities…
Taxation est. · year 1
- Rental income
- $180,468
- − Mortgage interest
- −$63,908
- − Property taxes
- −$9,118
- − Insurance
- −$5,704
- − Repairs & maintenance
- −$14,437
- − Management
- −$14,437
- − Depreciation
- −$33,190
- Taxable income
- $39,672
- Est. tax owed @ 24.0%
- −$9,521
- After-tax cash flow
- $46,430/yr
For passive investors: Depreciation is non-cash, so a rental often shows a tax loss while cash-flowing — sheltering income. Rental losses are passive: they offset passive income freely, and up to $25,000/yr can offset ordinary (W-2) income if you actively participate and your MAGI is under $100k (phasing out to $0 by $150k); unused losses carry forward. On sale, claimed depreciation is recaptured at up to 25%, and gains may owe capital-gains tax (a 1031 exchange can defer both). Figures are a year-1 estimate at your 24.0% rate — not tax advice; consult a CPA.
Schools (NCES district)
- District
- Jefferson County
- NCES district ID
- 2102990
- Math proficiency
- 19% ▼ -17.00%
- Reading proficiency
- 35% ▼ -11.00%
- Median HH income
- $47,885
- Composite
- 23.45/100
- National rank
- #7884
- State rank
- #121 of 165 in KY
Livability — Louisville/Jefferson County metro government (balance)
No livability data for this city. (Only ~50 U.S. cities are tracked.)
Census & demographics
- Census place
- Louisville/Jefferson County metro government (balance), KY
- County
- Jefferson County · 790,184 people
- City population
- 419,741
- Metro
- Louisville/Jefferson County, KY-IN
- Population (ZIP)
- 26,841
- Household income
- $68,162
- Rent vs Own
- Severe rent burden
- 839.0
Population outlook (Jefferson County) Hauer SSP2
- Today (2025)
- 823,112 people
- By 2030
- 849,343 · +3.2%
- By 2040
- 895,696 · +8.8%
- By 2050
- 933,630 · +13.4%
- By 2075
- 1,028,262 · +24.9%
- By 2100
- 1,072,675 · +30.3%
Race, ethnicity, and origin ACS 2023
- Neighborhood character
- Predominantly White (67%)
- Race & ethnicity
- White 67% Black 22% Two or more races 8% Hispanic / Latino 5%
- Hispanic origin (detail)
- Mexican 3% Cuban 1%
- Common ancestry
- Iranian 2% Italian 2% Slovak 2%
- Foreign-born
- 5% · Canada
- Languages at home
- 94% English-only · Spanish 4%
Political lean MEDSL · Jefferson
- 2024 margin
- D (+16.6) · D 57.4% · R 40.9% · Other 1.7%
- 2008→2024 swing
- +4.5pp toward D · 2008: 12.0pp · 2024: 16.6pp
- All cycles
- 2024: D+16.6 2020: D+20.1 2016: D+13.3 2012: D+11.1 2008: D+12.0
Not yet ingested
- Civics
- —
Market trends
- HPI YoY
- ▼ -296.36%
- Current HPI
- 244.6667
- Rent YoY
- ▲ 0.50%
- Metro
- Louisville/Jefferson County, KY-IN
- State GDP YoY
- ▲ 1.81%
- F500 in state
- 4
Industry mix (Fortune 500 HQ in KY)
| Industry | F500 HQs | Revenue |
|---|---|---|
| Healthcare | 1 | $118B |
|
||
| Food / Beverage | 1 | $7B |
|
||
Price history
+288.7% since first listed14 events — show timeline
- 2026-05-14 Listed $1,223,900 Metro Search MLS
- 2024-10-20 Rental Removed $895 APPFOLIO
- 2024-10-20 Listed for Rent $895 APPFOLIO
- 2024-10-14 Rental Removed $895 APPFOLIO
- 2024-10-13 Listed for Rent $895 APPFOLIO
- 2022-12-01 Sold (Public Records) $1,050,000 Public Records
- 2021-01-29 Sold (Public Records) $605,000 Public Records
- 2015-01-27 Listing Removed — Metro Search MLS
- 2014-11-03 Listed $129,900 Metro Search MLS
- 2014-03-31 Sold (Public Records) $501,000 Public Records
- 2008-11-13 Sold (Public Records) $273,000 Public Records
- 2007-09-27 Sold (Public Records) $291,077 Public Records
- 2002-12-04 Sold (MLS) $277,000 Metro Search MLS
- 2002-10-21 Listed $314,900 Metro Search MLS
Property tax history
+16.4%/yrLatest (2025): $9,118 · -2.1% YoY. Source: county tax records.
Cash-flow waterfall
monthlySold comps — $/sqft
last 12 mo · ≤1 miLoading sold comps…