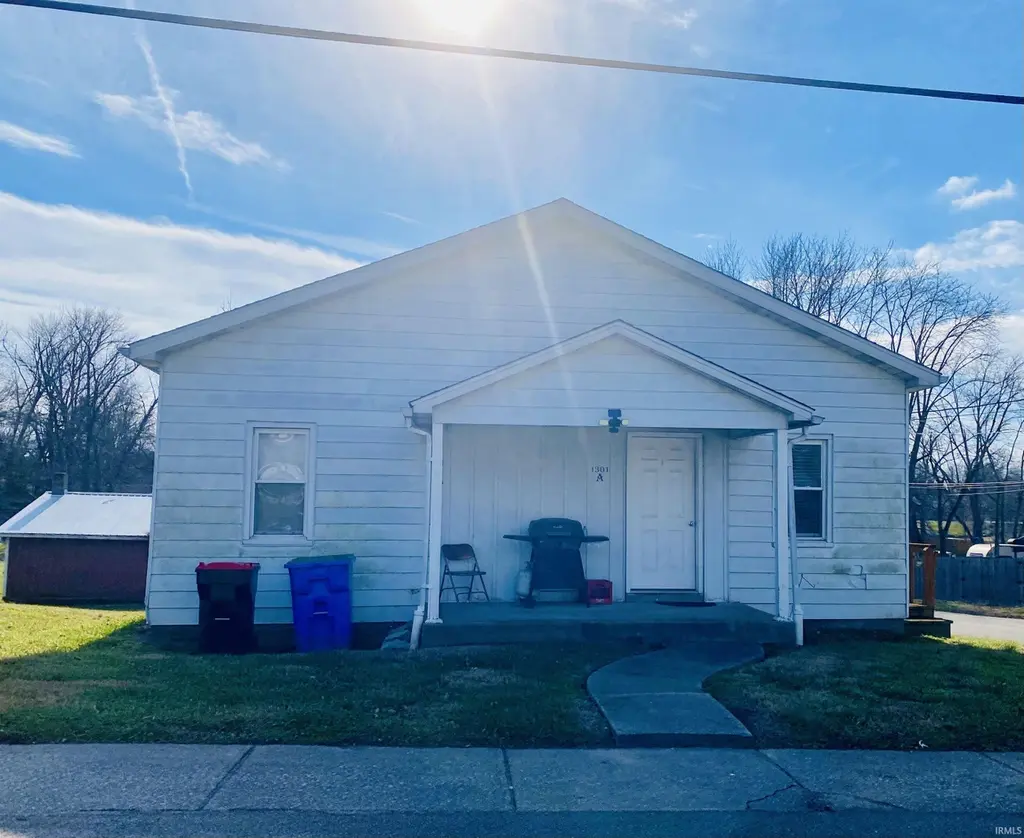
1301 E Walnut St · Boonville, IN
Flood risk 1/10 · Minimal
- FEMA flood zone
- X (unshaded)
- Chance of flooding over 30 yrs
- 0.0%
- Est. flood insurance / yr
- $473 – $860
Fire risk 1/10 · Minimal
- Est. fire insurance / yr
- $717 – $1,331
Heat risk 5/10 · Moderate
- Hot days now (above 106°F)
- 7 days/yr
- Hot days in 30 yrs
- 19 days/yr
Wind risk 2/10 · Minimal
- Chance of severe wind over 30 yrs
- 3.0%
Air-quality risk 2/10 · Minimal
- Unhealthy air days now
- 2 days/yr
- Unhealthy air days in 30 yrs
- 2 days/yr
Risk factors via First Street. Map © Google.
Why this score? — see what drove the C- grade
The composite is a weighted blend of 9 inputs, each scored 0–100. Each bar is that input's sub-score; the figure is the points it added to the 100-point composite (weight × sub-score).
- Cash flow +17.2/30.0
- ARV discount +10.0/15.0
- DSCR +5.4/10.0
- Schools +4.9/10.0
- 1% rule +4.7/10.0
- Livability +3.3/5.0
- Rent growth +2.5/5.0
- Condition / age +2.5/5.0
- Appreciation +0.0/10.0
$175,000
🖨 Deal sheet 📄 Offer letter ✓ Due diligence
Listing remarks MLS
Duplex Apartment with each unit having 2 bedrooms, 1 bath and laundry hook ups and 1 unit has a half bath in the laundry area. Also includes a detached 2 car garage all on a corner lot. Both units are currently rented.
Key facts
- 0.5 acre lot
- 2 garage spots
- Built 1936
Neighborhood map
What this means for you Summary
Snapshot
- This is a 4-bed/2.5-bath single-family listed at $175k.
Deal economics
- At list price, monthly cash flow is $125 ($2k/yr) — positive.
- The deal already cash-flows at list — no discount required.
- To meet the 1% rule (rent ≥ 1% of price), the offer needs to be $170k (3.1% below list).
- Recommended offer: $154k (12.0% below list) — sets the bar for market timing.
- Cap rate 7.2% vs local median 3.5% in Boonville — top-decile yield for the area; either an underpriced asset or a hidden risk that comps aren't pricing in. Stress-test before assuming the spread holds.
Location & tenants
- Location reads 66/100 on livability (#278 in IN) — a middle-class / working-renter tenant base. Strengths: cost of living A+, housing A+; Watch: crime D+, amenities F, commute F.
- Warrick County School Corporation (suburban): math 54% / reading 59% proficiency, ranked #24 of 301 in IN (top 8%) — acceptable for families but not a draw, mixed tenant base, ~2y average lease.
- Market conditions: 158 active listings in the ZIP; 1 comparable units currently listed for rent nearby; 249 units permitted in Warrick County in 2024 (0 in 5+ unit buildings).
Forward outlook
- Local home prices are declining (-3.0%/yr); year-one equity from $1k of loan paydown is wiped out by about $5k of value loss. Plan a longer hold.
- Warrick County population projected at +9% by 2050 — modest demand growth; plan on rents tracking national, not racing it.
Negotiation context
- It's been on market 159 days — a 12% lower offer ($154k) is reasonable based on typical stale-listing flexibility.
- 2 sale attempts since 9y ago; this cycle's ask has dropped $10k (5%) from the opening price — seller is motivated, your offer sets the floor, not the list.
- Current owner paid $50k; list at $175k implies a 248% gain — meaningful room to come down on a strong offer.
Risks & watch-outs
- Watch-outs: built in 1936 — expect roof / HVAC / electrical / plumbing capex.
- Climate carrying-cost: extreme-heat days projected 7→19/yr by 2055 (HVAC capex compounding) — expect insurance premiums to compound above CPI over the hold.
Questions for the listing agent
- It's been on market 159 days. Have you received any prior offers? Is the seller open to a 12% concession, seller financing, or rate buy-down credit?
- Built in 1936 — when were the roof, HVAC, electrical panel, plumbing, and water heater last replaced?
- Why hasn't it sold? Are there any deal-killer items the seller is aware of (foundation, flood, title, zoning, code violations)?
- Is there a deadline driving the sale (1031 exchange, divorce, estate, relocation)? That informs how much negotiation room exists.
- Crime grade is D in this area — have there been break-ins, vandalism, or insurance claims at this property in the last 3 years? What carrier currently insures it and at what premium?
- What's the average days-on-market for RENTAL listings here right now (not sales)? A rising rental-DOM trend means longer vacancies and softer asking-rent achievability than the comps imply.
- What's the recent tenant-quality profile in this submarket — average credit score on applications, eviction rate, late-payment / NSF rate, and stable-employment percentage? A property-management company in the area should have these aggregated.
- How much new for-sale + rental construction is in the pipeline within 1–3 miles? Heavy new supply typically softens prices + rents 12–24 months out; constrained supply supports both.
Investment metrics
- 1% rule
- 0.97% ✗
- Cap rate
- 7.15%
- Cash-on-cash
- 3.07%
- DSCR
- 1.14
- GRM
- 8.6
CMA / ARV
- ARV (median comp)
- $185,160
- List price
- $175,000
- Delta
- -5.49%
- Verdict
- FAIR
- Comps
- 20 within 1.0 mi
Show comp detail 12 sales within ~0.75 mi
| Address | Dist | Beds/Ba | Sqft | Sold | Price | $/sf | Match |
|---|---|---|---|---|---|---|---|
| 504 E Walnut St | 0.42mi | 3/2.0 (-1) | 1,864 (+4%) | 6mo | $230,000 | $123 | 62 |
| 413 E Division St | 0.49mi | 3/2.0 (-1) | 1,800 (+0%) | 9mo | $200,000 | $111 | 62 |
| 603 E Moore St | 0.52mi | 3/2.0 (-1) | 1,909 (+6%) | 7mo | $205,000 | $107 | 52 |
| 424 E Oak St | 0.52mi | 3/2.0 (-1) | 1,649 (-8%) | 4mo | $180,000 | $109 | 52 |
| 323 S Seventh St | 0.44mi | 4/2.0 | 1,675 (-6%) | 17mo | $181,000 | $108 | 52 |
| 916 Maple Ln | 0.33mi | 3/2.0 (-1) | 1,607 (-10%) | 12mo | $250,000 | $156 | 50 |
| 506 E Locust St | 0.43mi | 3/1.0 (-1) | 1,920 (+7%) | 10mo | $138,000 | $72 | 49 |
| 617 E Division St | 0.38mi | 5/2.0 (+1) | 1,904 (+6%) | 20mo | $219,000 | $115 | 49 |
| 321 E Chestnut St | 0.64mi | 3/1.0 (-1) | 1,620 (-10%) | 0mo | $119,000 | $73 | 43 |
| 406 E Maple St | 0.53mi | 4/1.5 | 1,625 (-9%) | 20mo | $195,000 | $120 | 40 |
| 408 E Locust St | 0.49mi | 3/1.5 (-1) | 1,664 (-7%) | 22mo | $135,000 | $81 | 38 |
| 503 E Locust St | 0.43mi | 3/1.0 (-1) | 1,569 (-12%) | 18mo | $209,000 | $133 | 33 |
Match score weights: distance 35% · size 25% · config 20% · recency 20%. Top-matched comps best support the ARV.
Projected returns pro-forma
-3.0% appreciation · 3.0% rent growth · sell at horizon
- IRR
- -11.4%
- Equity multiple
- 0.58×
- Total profit
- $-20,347
- Equity at exit
- $26,093
- IRR
- -2.2%
- Equity multiple
- 0.85×
- Total profit
- $-7,324
- Equity at exit
- $15,131
Cash invested: $49,000 (down + closing). Projections, not guarantees.
Landlord ↔ Tenant lean methodology
- Overall (STATE)
- 90 Strongly Landlord-Friendly
- State Indiana
- 90 Strongly Landlord-Friendly · R+11
- County
- — inherits STATE
- City
- — inherits STATE
ZIP-level market 47601
- Active inventory
- 158
- Price-to-rent
- 8.6×
Monthly cashflow live
- Estimated rent
- $1,695 medium interval (Pro) →
- Mortgage (P&I)
- −$918
- Tax from tax record
- −$223 /mo · $2,677/yr
- Insurance
- −$73
- HOA
- −$0
- Vacancy / Maint / Mgmt
- −$356
- Net cashflow
- $125
Break-even live
UW: 25.0% down · 7.5% · 30yr · 1.5% tax · 5.0% vac · 8.0% maint · 8.0% mgmt
Financing live
Cash to close
- Down payment
- $43,750
- Closing costs
- $5,250
- Reserves months
- —
- Total cash needed
- —
Loan-product check · same deal, 3 products live
Conventional
25% down · 7.5% · 30yr
- Down + closing
- —
- Monthly P&I
- —
- Monthly cashflow
- —
- DSCR
- —
- Eligible?
- —
Personal DTI + credit; lowest rate.
DSCR
20% down · 8.5% · 30yr
- Down + closing
- —
- Monthly P&I
- —
- Monthly cashflow
- —
- DSCR
- —
- Eligible?
- —
No personal income docs; deal must DSCR.
Hard money
10% down · 12.0% · 12mo
- Down + closing
- —
- Monthly P&I
- —
- Monthly cashflow
- —
- DSCR
- —
- Eligible?
- —
Short-term bridge; refi at stabilization.
Rent comps 1 comps
| Address | Beds | Baths | Sqft | Rent | $/sqft | DOM | Units | Dist |
|---|---|---|---|---|---|---|---|---|
| 911 Mayfair Dr Boonville, IN | 3.0 | 2.0 | 1897 | $1,695 | $0.89 | 43d | 1 | 0.53mi |
Listing history 18 events
-
2026-06-18days on market $175,000 Active 159 DOM
-
2026-06-17days on market $175,000 Active 158 DOM
-
2026-06-16days on market $175,000 Active 157 DOM
-
2026-06-15days on market $175,000 Active 156 DOM
-
2026-06-14days on market $175,000 Active 154 DOM
-
2026-06-13days on market $175,000 Active 153 DOM
-
2026-06-10days on market $175,000 Active 151 DOM
-
2026-06-09days on market $175,000 Active 150 DOM
-
2026-06-08days on market $175,000 Active 149 DOM
-
2026-06-07days on market $175,000 Active 148 DOM
-
2026-06-02days on market $175,000 Active 143 DOM
-
2026-06-01days on market $175,000 Active 142 DOM
-
2026-05-31days on market $175,000 Active 141 DOM
-
2026-05-30days on market $175,000 Active 140 DOM
-
2026-04-07price $175,000 218-char remark
Show marketing remark (218 chars)
Duplex Apartment with each unit having 2 bedrooms, 1 bath and laundry hook ups and 1 unit has a half bath in the laundry area. Also includes a detached 2 car garage all on a corner lot. Both units are currently rented.
-
2026-01-11$185,000 Active 218-char remark
Show marketing remark (218 chars)
Duplex Apartment with each unit having 2 bedrooms, 1 bath and laundry hook ups and 1 unit has a half bath in the laundry area. Also includes a detached 2 car garage all on a corner lot. Both units are currently rented.
-
2017-09-12soldstatus $50,318
-
2017-09-10$69,900
ⓘ Source: listings_history table (triggers on properties + properties_extension) + one-shot
backfill from property_details.listing_events for pre-trigger history.
Tax reassessment forecast IN · Partial reset (capped growth)
- Current annual tax
- $2,677 · $223/mo
- Projected year-2 tax
- $2,677 · $223/mo
- Expected delta
- $0/yr ($0/mo · 0.0%)
ⓘ Screening estimate from a state-policy table — verify with the county assessor before closing.
Climate risk First Street
- Flood 1/10 Low FEMA zone X (unshaded) · 0% chance over 30 yrs
- Wildfire 1/10 Low
- Heat 5/10 Major 7 d/yr ≥106°F today · 19 d/yr by 30 yrs out
- Wind 2/10 Low 3% chance of damaging wind over 30 yrs
- Air quality 2/10 Low 2 unhealthy d/yr today · 2 by 30 yrs out
Nearby sold comps map
Loading sold comps map…
Walkable amenities ~0.75 mi
Loading nearby amenities…
Taxation est. · year 1
- Rental income
- $20,340
- − Mortgage interest
- −$9,803
- − Property taxes
- −$2,677
- − Insurance
- −$875
- − Repairs & maintenance
- −$1,627
- − Management
- −$1,627
- − Depreciation
- −$5,091
- Taxable loss
- −$1,360
- Est. tax savings @ 24.0%
- +$326
- After-tax cash flow
- $1,830/yr
For passive investors: Depreciation is non-cash, so a rental often shows a tax loss while cash-flowing — sheltering income. Rental losses are passive: they offset passive income freely, and up to $25,000/yr can offset ordinary (W-2) income if you actively participate and your MAGI is under $100k (phasing out to $0 by $150k); unused losses carry forward. On sale, claimed depreciation is recaptured at up to 25%, and gains may owe capital-gains tax (a 1031 exchange can defer both). Figures are a year-1 estimate at your 24.0% rate — not tax advice; consult a CPA.
Schools (NCES district)
- District
- Warrick County School Corporation
- NCES district ID
- 1812390
- Math proficiency
- 54% ▼ -8.00%
- Reading proficiency
- 59% ▼ -6.00%
- Median HH income
- $62,801
- Composite
- 49.38/100
- National rank
- #2014
- State rank
- #24 of 301 in IN
Livability — Boonville
- Score
- 66/100
- State rank
- #278
- US rank
- #11520
Category grades
Schools grade is shown separately in the Schools card above.
Census & demographics
- Census place
- Boonville, IN
- Population (ZIP)
- 13,119
Population outlook (Warrick County) Hauer SSP2
- Today (2025)
- 66,569 people
- By 2030
- 68,404 · +2.8%
- By 2040
- 71,131 · +6.9%
- By 2050
- 72,743 · +9.3%
- By 2075
- 76,088 · +14.3%
- By 2100
- 72,261 · +8.6%
Race, ethnicity, and origin ACS 2023
- Neighborhood character
- Predominantly White (95%)
- Race & ethnicity
- White 95% Two or more races 3% Hispanic / Latino 2%
- Common ancestry
- Slovak 2% Italian 1% Lithuanian 1%
- Foreign-born
- 0% · Canada
- Languages at home
- 99% English-only · Spanish 1%
Political lean MEDSL · Warrick
- 2024 margin
- Solid R (+30.2) · D 34.1% · R 64.3% · Other 1.5%
- 2008→2024 swing
- -17.4pp toward R · 2008: -12.8pp · 2024: -30.2pp
- All cycles
- 2024: R+30.2 2020: R+27.8 2016: R+33.9 2012: R+26.6 2008: R+12.8
Not yet ingested
- Civics
- —
Market trends
- HPI YoY
- ▼ -119.46%
- Current HPI
- 207.7817
- Rent YoY
- —
- Metro
- —
- State GDP YoY
- ▲ 2.90%
- F500 in state
- 18
Industry mix (Fortune 500 HQ in IN)
| Industry | F500 HQs | Revenue |
|---|---|---|
| Industrial Machinery | 2 | $37B |
|
||
| Healthcare | 1 | $177B |
|
||
| Pharmaceuticals | 1 | $45B |
|
||
| Metals / Steel | 1 | $18B |
|
||
| Agriculture | 1 | $17B |
|
||
| Packaging | 1 | $12B |
|
||
Price history
+150.4% since first listed4 events — show timeline
- 2026-04-07 Price Changed $175,000 IRMLS
- 2026-01-11 Listed $185,000 IRMLS
- 2017-09-12 Sold (MLS) $50,318 IRMLS
- 2017-09-10 Listed $69,900 IRMLS
Property tax history
+0.6%/yrLatest (2024): $2,677 · -6.3% YoY. Source: county tax records.
Cash-flow waterfall
monthlySold comps — $/sqft
last 12 mo · ≤1 miLoading sold comps…