 7-Plex
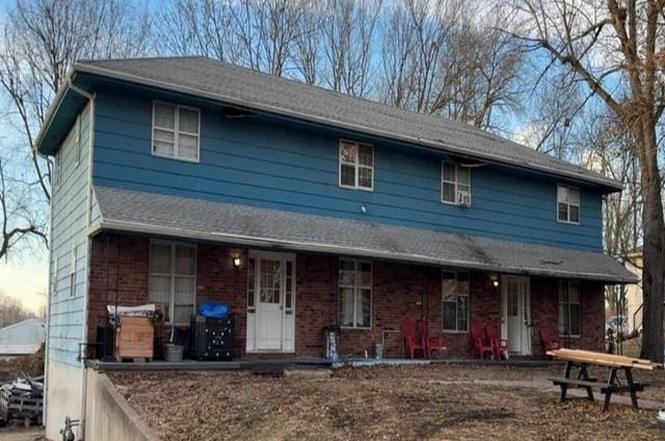
3606 -3612 Charles St · St. Joseph, MO
Flood risk 1/10 · Minimal
- FEMA flood zone
- X
- Chance of flooding over 30 yrs
- 0.0%
- Est. flood insurance / yr
- $473 – $860
Fire risk 1/10 · Minimal
- Est. fire insurance / yr
- $1,054 – $1,958
Heat risk 4/10 · Minor
- Hot days now (above 106°F)
- 7 days/yr
- Hot days in 30 yrs
- 16 days/yr
Wind risk 2/10 · Minimal
- Chance of severe wind over 30 yrs
- —
Air-quality risk 2/10 · Minimal
- Unhealthy air days now
- 1 days/yr
- Unhealthy air days in 30 yrs
- 1 days/yr
Risk factors via First Street. Map © Google.
Why this score? — see what drove the D grade
The composite is a weighted blend of 9 inputs, each scored 0–100. Each bar is that input's sub-score; the figure is the points it added to the 100-point composite (weight × sub-score).
- Cash flow +15.0/30.0
- ARV discount +7.7/15.0
- 1% rule +5.0/10.0
- DSCR +5.0/10.0
- Schools +2.8/10.0
- Rent growth +2.5/5.0
- Livability +2.5/5.0
- Condition / age +2.5/5.0
- Appreciation +0.0/10.0
$155,900
🖨 Deal sheet 📄 Offer letter ✓ Due diligence
Multi-family units
County records classify this as Multi-Family (5+ Unit). Listing-text estimate: 7 units. confirmed
5+ unit building — per-unit beds/baths from public records are typically unavailable; the breakdown below (if shown) is an estimate from the listing text.
Listing remarks
REO Occupied – The seller does not represent or guarantee occupancy status. NO viewings of this property. Please DO NOT DISTURB the occupant. Drive by only. Four-unit building. 8 bedrooms and 4 bathrooms. AS IS, cash only sale with no contingencies or inspections. Buyer will be responsible for obtaining possession of the property upon closing. Property sold without contingencies, repairs, warranties, guarantees or representation as to the listing accuracy, property information, photo or other depiction included or described herein. Auction
Key facts
- 0.32 acre lot
- Built 1978
- Listed 35 days
Neighborhood map
What this means for you Summary
Snapshot
- This is a 7 × 3-bed/?-bath units multifamily listed at $156k.
Deal economics
- At list price, monthly cash flow is $5k ($58k/yr) — positive. Per door: $693/mo.
- The deal already cash-flows at list — no discount required.
- Meets the 1% rule at list price ($8k rent vs $156k).
- Recommended offer: $151k (3.0% below list) — sets the bar for market timing.
- Cap rate 43.6% vs local median 4.7% in St. Joseph — top-decile yield for the area; either an underpriced asset or a hidden risk that comps aren't pricing in. Stress-test before assuming the spread holds.
Location & tenants
- Location reads: area grade D — affects rentability + tenant quality, not the cash-flow math above.
- St. Joseph (urban): math 28% / reading 38% proficiency, ranked #241 of 324 in MO (top 74%) — families likely to look elsewhere, expect single-tenant / working-renter base with shorter leases.
- Zoned schools: Mark Twain Elem. (math 12% / reading 32%, grade F, #910 of 1,115 statewide, top 83%, 315 students, 99% FRL); Central High (math 28% / reading 50%, grade F, #287 of 521 statewide, top 55%, 1,728 students, 40% FRL) — zoned schools average 70% FRL vs 53% district-wide (17 pts higher); higher-poverty schools than district average — tighter screening recommended.
- Market conditions: 119 active listings in the ZIP; 70 units permitted in Buchanan County in 2024 (0 in 5+ unit buildings).
- At $7,578/mo this rent would consume 139% of the median local household income ($66k/yr) (locally 686% of renters already pay >50% of income on rent) — very limited rent-growth headroom before tenants either downsize or default.
Forward outlook
- Local home prices are declining (-3.0%/yr); year-one equity from $1k of loan paydown is wiped out by about $5k of value loss. Plan a longer hold.
- Buchanan County population projected to shrink 6% by 2050 — rents likely to lag national; underwrite the cash flow, not the appreciation.
- At projected returns (-3.0% appreciation + 3.0% rent growth), your $44k cash investment doubles in ~1 year — after that, you're playing with house money.
Negotiation context
- It's been on market 35 days — a 3% lower offer ($151k) is reasonable based on typical stale-listing flexibility.
Questions for the listing agent
- It's been on market 35 days. Have you received any prior offers? Is the seller open to a 3% concession, seller financing, or rate buy-down credit?
- Can we see the unit-by-unit rent roll, current vacancy, and any below-market leases? What's the average tenancy length?
- What capital expenditures (roof, boiler, parking lot, exteriors) have been made in the last 5 years, and what's planned in the next 2?
- Built in 1978 — when were the roof, HVAC, electrical panel, plumbing, and water heater last replaced?
- Is there a deadline driving the sale (1031 exchange, divorce, estate, relocation)? That informs how much negotiation room exists.
- The area grade is low — what's the realistic commute time and amenity access for the typical tenant pool here? Any planned neighborhood developments (good or bad) we should know about?
- What's the average days-on-market for RENTAL listings here right now (not sales)? A rising rental-DOM trend means longer vacancies and softer asking-rent achievability than the comps imply.
- What's the recent tenant-quality profile in this submarket — average credit score on applications, eviction rate, late-payment / NSF rate, and stable-employment percentage? A property-management company in the area should have these aggregated.
- How much new apartment / multifamily construction is in the pipeline within 1–3 miles? Heavy new supply (>2% of stock underway) typically softens rents 12–24 months out; light construction supports rent growth.
Investment metrics
- 1% rule
- 4.86% ✓
- Cap rate
- 43.62%
- Cash-on-cash
- 133.30%
- DSCR
- 6.93
- GRM
- 1.7
CMA / ARV
- ARV (on-the-fly)
- $156,600
- Comps found
- 1
Show comp detail 1 sale within ~0.75 mi
| Address | Dist | Beds/Ba | Sqft | Sold | Price | $/sf | Match |
|---|---|---|---|---|---|---|---|
| 3606 -3612 Charles St | 0.00mi | 20/10.0 (-1) | 2,088 (0%) | 0mo | $155,900 | $75 | 94 |
Match score weights: distance 35% · size 25% · config 20% · recency 20%. Top-matched comps best support the ARV.
Projected returns pro-forma
-3.0% appreciation · 3.0% rent growth · sell at horizon
- IRR
- —
- Equity multiple
- 7.50×
- Total profit
- $283,728
- Equity at exit
- $23,245
- IRR
- —
- Equity multiple
- 15.78×
- Total profit
- $645,360
- Equity at exit
- $13,479
Cash invested: $43,652 (down + closing). Projections, not guarantees.
Landlord ↔ Tenant lean methodology
- Overall (STATE)
- 81 Strongly Landlord-Friendly
- State Missouri
- 81 Strongly Landlord-Friendly · R+10
- County
- — inherits STATE
- City
- — inherits STATE
ZIP-level market 64506
- Active inventory
- 119
- Price-to-rent
- 12.0×
Monthly cashflow live
- Estimated rent
- $7,578 medium interval (Pro) →
- Mortgage (P&I)
- −$818
- Tax from tax record
- −$255 /mo · $3,061/yr
- Insurance
- −$65
- HOA
- −$0
- Vacancy / Maint / Mgmt
- −$1,591
- Net cashflow
- $4,849
Break-even live
7-unit breakdown (identical units grouped — click to expand)
| Units | Beds | Baths | Est. rent |
|---|---|---|---|
| 7× units | 3 | — | $7,581 |
| #1 | 3 | — | $1,083 |
| #2 | 3 | — | $1,083 |
| #3 | 3 | — | $1,083 |
| #4 | 3 | — | $1,083 |
| #5 | 3 | — | $1,083 |
| #6 | 3 | — | $1,083 |
| #7 | 3 | — | $1,083 |
| Total (7 units) | $7,578 | ||
UW: 25.0% down · 7.5% · 30yr · 1.5% tax · 5.0% vac · 8.0% maint · 8.0% mgmt
Financing live
Cash to close
- Down payment
- $38,975
- Closing costs
- $4,677
- Reserves months
- —
- Total cash needed
- —
Loan-product check · same deal, 3 products live
Conventional
25% down · 7.5% · 30yr
- Down + closing
- —
- Monthly P&I
- —
- Monthly cashflow
- —
- DSCR
- —
- Eligible?
- —
Personal DTI + credit; lowest rate.
DSCR
20% down · 8.5% · 30yr
- Down + closing
- —
- Monthly P&I
- —
- Monthly cashflow
- —
- DSCR
- —
- Eligible?
- —
No personal income docs; deal must DSCR.
Hard money
10% down · 12.0% · 12mo
- Down + closing
- —
- Monthly P&I
- —
- Monthly cashflow
- —
- DSCR
- —
- Eligible?
- —
Short-term bridge; refi at stabilization.
Listing history 4 events
-
2026-03-24status Pending
-
2026-03-05price $155,900
-
2026-02-17$178,100 Active
-
2004-06-25soldstatus
ⓘ Source: listings_history table (triggers on properties + properties_extension) + one-shot
backfill from property_details.listing_events for pre-trigger history.
Tax reassessment forecast MO · Resets to sale price
- Current annual tax
- $3,061 · $255/mo
- Projected year-2 tax
- $3,061 · $255/mo
- Expected delta
- $0/yr ($0/mo · 0.0%)
ⓘ Screening estimate from a state-policy table — verify with the county assessor before closing.
Climate risk First Street
- Flood 1/10 Low FEMA zone X · 0% chance over 30 yrs
- Wildfire 1/10 Low
- Heat 4/10 Moderate 7 d/yr ≥106°F today · 16 d/yr by 30 yrs out
- Wind 2/10 Low
- Air quality 2/10 Low 1 unhealthy d/yr today · 1 by 30 yrs out
Nearby sold comps map
Loading sold comps map…
Walkable amenities ~0.75 mi
Loading nearby amenities…
Taxation est. · year 1
- Rental income
- $90,936
- − Mortgage interest
- −$8,733
- − Property taxes
- −$3,061
- − Insurance
- −$780
- − Repairs & maintenance
- −$7,275
- − Management
- −$7,275
- − Depreciation
- −$4,535
- Taxable income
- $59,278
- Est. tax owed @ 24.0%
- −$14,227
- After-tax cash flow
- $43,962/yr
For passive investors: Depreciation is non-cash, so a rental often shows a tax loss while cash-flowing — sheltering income. Rental losses are passive: they offset passive income freely, and up to $25,000/yr can offset ordinary (W-2) income if you actively participate and your MAGI is under $100k (phasing out to $0 by $150k); unused losses carry forward. On sale, claimed depreciation is recaptured at up to 25%, and gains may owe capital-gains tax (a 1031 exchange can defer both). Figures are a year-1 estimate at your 24.0% rate — not tax advice; consult a CPA.
Schools (NCES district)
- District
- St. Joseph
- NCES district ID
- 2927060
- Math proficiency
- 28% ▼ -6.00%
- Reading proficiency
- 38% ▼ -1.00%
- Median HH income
- $43,007
- Composite
- 27.99/100
- National rank
- #6853
- State rank
- #241 of 324 in MO
Livability — St. Joseph
No livability data for this city. (Only ~50 U.S. cities are tracked.)
Census & demographics
- Census place
- St. Joseph, MO
- County
- Buchanan County · 32,150 people
- City population
- 44,382
- Metro
- St. Joseph, MO-KS
- Population (ZIP)
- 21,461
- Household income
- $65,573
- Rent vs Own
- Severe rent burden
- 686.0
Population outlook (Buchanan County) Hauer SSP2
- Today (2025)
- 89,041 people
- By 2030
- 88,401 · -0.7%
- By 2040
- 86,220 · -3.2%
- By 2050
- 83,603 · -6.1%
- By 2075
- 76,750 · -13.8%
- By 2100
- 67,623 · -24.1%
Race, ethnicity, and origin ACS 2023
- Neighborhood character
- Predominantly White (80%)
- Race & ethnicity
- White 80% Black 7% Hispanic / Latino 6% Two or more races 6% Asian 2% Pacific Islander 1%
- Hispanic origin (detail)
- Mexican 4%
- Common ancestry
- Romanian 4% Lithuanian 2% Slovak 2%
- Foreign-born
- 4% · Canada, Vietnam
- Languages at home
- 93% English-only · Spanish 3% Other Asian/Pacific 1% Vietnamese 1%
Political lean MEDSL · Buchanan
- 2024 margin
- Strong R (+28.0) · D 35.2% · R 63.3% · Other 1.5%
- 2008→2024 swing
- -28.2pp toward R · 2008: 0.1pp · 2024: -28.0pp
- All cycles
- 2024: R+28.0 2020: R+24.6 2016: R+26.2 2012: R+8.7 2008: D+0.1
Not yet ingested
- Civics
- —
Market trends
- HPI YoY
- ▼ -127.26%
- Current HPI
- 186.0383
- Rent YoY
- —
- Metro
- St. Joseph, MO-KS
- State GDP YoY
- ▲ 1.84%
- F500 in state
- 20
Industry mix (Fortune 500 HQ in MO)
| Industry | F500 HQs | Revenue |
|---|---|---|
| Healthcare | 1 | $163B |
|
||
| Insurance | 1 | $21B |
|
||
| Industrial Technology | 1 | $17B |
|
||
| Retail | 1 | $16B |
|
||
| Industrial Distribution | 1 | $10B |
|
||
| Utilities | 1 | $9B |
|
||
Price history
-12.5% since first listed4 events — show timeline
- 2026-03-24 Pending — MARIS as Distributed by MLS Grid
- 2026-03-05 Price Changed $155,900 MARIS as Distributed by MLS Grid
- 2026-02-17 Listed $178,100 MARIS as Distributed by MLS Grid
- 2004-06-25 Sold (Public Records) — Public Records
Property tax history
+1.5%/yrLatest (2025): $3,061 · +6.6% YoY. Source: county tax records.
Cash-flow waterfall
monthlySold comps — $/sqft
last 12 mo · ≤1 miLoading sold comps…