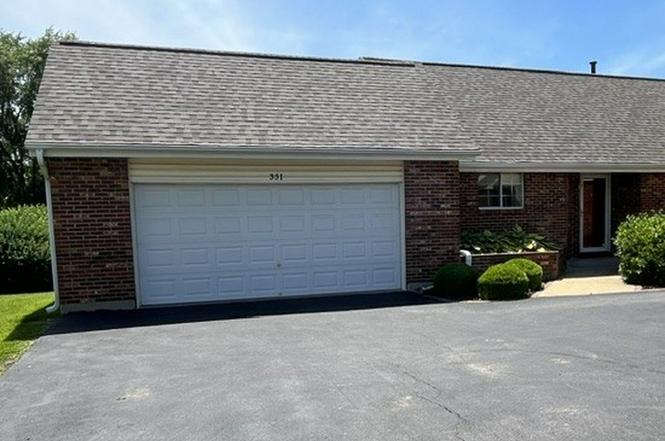
331 Devonshire Ct · St. Peters, MO
Flood risk 1/10 · Minimal
- FEMA flood zone
- X (unshaded)
- Chance of flooding over 30 yrs
- 0.0%
- Est. flood insurance / yr
- $473 – $860
Fire risk 1/10 · Minimal
- Est. fire insurance / yr
- $1,054 – $1,958
Heat risk 5/10 · Moderate
- Hot days now (above 108°F)
- 7 days/yr
- Hot days in 30 yrs
- 20 days/yr
Wind risk 2/10 · Minimal
- Chance of severe wind over 30 yrs
- 1.0%
Air-quality risk 2/10 · Minimal
- Unhealthy air days now
- 2 days/yr
- Unhealthy air days in 30 yrs
- 2 days/yr
Risk factors via First Street. Map © Google.
Why this score? — see what drove the F grade
The composite is a weighted blend of 9 inputs, each scored 0–100. Each bar is that input's sub-score; the figure is the points it added to the 100-point composite (weight × sub-score).
- ARV discount +7.5/15.0
- Cash flow +7.0/30.0
- Schools +5.1/10.0
- 1% rule +4.0/10.0
- Rent growth +3.2/5.0
- Condition / age +2.8/5.0
- Livability +2.5/5.0
- DSCR +1.2/10.0
- Appreciation +0.0/10.0
$200,000
🖨 Deal sheet (PDF) 📄 Offer letter ✓ Due diligence
Listing remarks
Don't miss out on this desirable end unit condo with no units above it, priced to allow a refresh. This 1,238 sf home features a primary walk-in closet, eat-in kitchen with a pantry, large open dining/living room with a charming wood burning brick fireplace, vaulted ceilings, ceiling fans, along with a spacious finished basement that includes a laundry room, full bath (3rd one), family/rec room, den/office, workroom, and abundant built-in storage with shelves galore. Enjoy the convenience of an attached 2 vehicle garage and added outdoor living space of 2 decks. A great opportunity for comfortable living with flexible space for guests, hobbies, work or entertaining. Location, location, loca
Key facts
- Eat-in kitchen
- End unit condo
- Built 1984
Tags
Neighborhood map
What this means for you Summary
Snapshot
- This is a 2-bed/2.0-bath condo listed at $200k. Condition is rated average.
Deal economics
- At list price, monthly cash flow is $-294 ($-4k/yr) — negative.
- The deal already cash-flows at list — no discount required.
- To meet the 1% rule (rent ≥ 1% of price), the offer needs to be $179k (10.3% below list).
- Recommended offer: $179k (10.3% below list) — sets the bar for 1% rule.
Location & tenants
- Location reads: area grade F — affects rentability + tenant quality, not the cash-flow math above.
- Ft. Zumwalt R-II (suburban): math 54% / reading 60% proficiency, ranked #14 of 324 in MO (top 4%) — acceptable for families but not a draw, mixed tenant base, ~2y average lease; only 18% free/reduced lunch — higher-income household profile.
- Market conditions: Rents rising (+2.7%/yr); 297 active listings in the ZIP; 6 comparable units currently listed for rent nearby; rentals leasing fast (median 6d on market — plan ~1-2 weeks tenant-placement turnaround); solid renter incomes; 2,021 units permitted in St. Charles County in 2024 (568 in 5+ unit buildings).
Forward outlook
- Local home prices are declining (-3.0%/yr); year-one equity from $1k of loan paydown is wiped out by about $6k of value loss. Plan a longer hold.
- St. Charles County population projected at +22% by 2050 — long-run rental-demand tailwind backs the buy-and-hold thesis.
Negotiation context
- Only 2 days on market — expect competitive offers; lowballing is unlikely to land.
Risks & watch-outs
- Climate carrying-cost: extreme-heat days projected 7→20/yr by 2055 (HVAC capex compounding) — expect insurance premiums to compound above CPI over the hold.
Questions for the listing agent
- What do current leases actually rent for vs. the listed asking? Can we see a recent rent roll and the last 12 months of T-12 income?
- What does the HOA fee cover, when was the last increase, and are there any pending special assessments or reserve-fund shortfalls?
- Any open or pending special assessments — roof, HVAC, plumbing, elevator, façade? What's the per-unit balance and payoff schedule, and is the seller paying it off at close or rolling it to the buyer?
- Is there a deadline driving the sale (1031 exchange, divorce, estate, relocation)? That informs how much negotiation room exists.
- The area grade is low — what's the realistic commute time and amenity access for the typical tenant pool here? Any planned neighborhood developments (good or bad) we should know about?
- What's the average days-on-market for RENTAL listings here right now (not sales)? A rising rental-DOM trend means longer vacancies and softer asking-rent achievability than the comps imply.
- What's the recent tenant-quality profile in this submarket — average credit score on applications, eviction rate, late-payment / NSF rate, and stable-employment percentage? A property-management company in the area should have these aggregated.
- How much new apartment / multifamily construction is in the pipeline within 1–3 miles? Heavy new supply (>2% of stock underway) typically softens rents 12–24 months out; light construction supports rent growth.
Investment metrics
- 1% rule
- 0.90% ✗
- Cap rate
- 4.53%
- Cash-on-cash
- -6.30%
- DSCR
- 0.72
- GRM
- 9.3
CMA / ARV
No comps found within radius.
Projected returns pro-forma
-3.0% appreciation · 2.69% rent growth · sell at horizon
- IRR
- -27.4%
- Equity multiple
- 0.08×
- Total profit
- $-51,477
- Equity at exit
- $29,821
- IRR
- -26.5%
- Equity multiple
- -0.26×
- Total profit
- $-70,297
- Equity at exit
- $17,292
Cash invested: $56,000 (down + closing). Projections, not guarantees.
Landlord ↔ Tenant lean methodology
- Overall (STATE)
- 81 Strongly Landlord-Friendly
- State Missouri
- 81 Strongly Landlord-Friendly · R+10
- County
- — inherits STATE
- City
- — inherits STATE
ZIP-level market 63376
- Rents YoY
- 2.7%
- Active inventory
- 297
- Price-to-rent
- 9.3×
Monthly cashflow live
- Estimated rent
- $1,795 high interval (Pro) →
- Mortgage (P&I)
- −$1,049
- Tax est. 1.5%
- −$250 /mo · $3,000/yr
- Insurance
- −$83
- HOA est. from 2 same-building comps
- −$330
- Vacancy / Maint / Mgmt
- −$377
- Net cashflow
- $-294
Break-even live
Sensitivity live
| Price | -10% $-156 | -5% $-225 | +0% $-294 | +5% $-363 | +10% $-432 |
|---|---|---|---|---|---|
| Rent | -10% $-436 | -5% $-365 | +0% $-294 | +5% $-223 | +10% $-152 |
| Rate | -1.0pp $-194 | -0.5pp $-243 | base $-294 | +0.5pp $-346 | +1.0pp $-399 |
UW: 25.0% down · 7.5% · 30yr · 1.5% tax · 5.0% vac · 8.0% maint · 8.0% mgmt
Financing live
Cash to close
- Down payment
- $50,000
- Closing costs
- $6,000
- Reserves months
- —
- Total cash needed
- —
Loan-product check · same deal, 3 products live
Conventional
25% down · 7.5% · 30yr
- Down + closing
- —
- Monthly P&I
- —
- Monthly cashflow
- —
- DSCR
- —
- Eligible?
- —
Personal DTI + credit; lowest rate.
DSCR
20% down · 8.5% · 30yr
- Down + closing
- —
- Monthly P&I
- —
- Monthly cashflow
- —
- DSCR
- —
- Eligible?
- —
No personal income docs; deal must DSCR.
Hard money
10% down · 12.0% · 12mo
- Down + closing
- —
- Monthly P&I
- —
- Monthly cashflow
- —
- DSCR
- —
- Eligible?
- —
Short-term bridge; refi at stabilization.
Rent comps 6 comps
| Address | Beds | Baths | Sqft | Rent | $/sqft | DOM | Units | Dist |
|---|---|---|---|---|---|---|---|---|
| 28 Jamestown Dr Saint Peters, MO | 3.0 | 1.0 | 1073 | $1,825 | $1.70 | 6d | 1 | 0.24mi |
| 23 Steeplechase Dr Saint Peters, MO | 3.0 | 1.0 | 1073 | $1,776 | $1.66 | 14d | 1 | 0.26mi |
| 2000 Enson LN St Peters, MO | 1.0–2.0 | 1.0–2.0 | 930 | $1,815 | $1.95 | 0d | 19 | 0.52mi |
| 131 Oak Dr Saint Peters, MO | 3.0 | 2.0 | 1500 | $1,950 | $1.30 | 25d | 1 | 0.61mi |
| 100 Ridgegate Ln Saint Peters, MO | 1.0–2.0 | 1.0–2.0 | 847 | $1,695 | $2.00 | 0d | 9 | 0.68mi |
| 8 Oak Dr Saint Peters, MO | 3.0 | 1.5 | 1134 | $2,171 | $1.91 | 0d | 1 | 0.74mi |
HOA detail condo
- Monthly dues
- $0 · $0/yr
- Assessments
- None detected in remarks — confirm with the listing agent.
Listing history 2 events
-
2026-06-13remarks 699-char remark
-
2026-06-13$200,000 Under Contract 2 DOM
ⓘ Source: listings_history table (triggers on properties + properties_extension) + one-shot
backfill from property_details.listing_events for pre-trigger history.
Climate risk First Street
- Flood 1/10 Low FEMA zone X (unshaded) · 0% chance over 30 yrs
- Wildfire 1/10 Low
- Heat 5/10 Major 7 d/yr ≥108°F today · 20 d/yr by 30 yrs out
- Wind 2/10 Low 100% chance of damaging wind over 30 yrs
- Air quality 2/10 Low 2 unhealthy d/yr today · 2 by 30 yrs out
Nearby sold comps map
Loading sold comps map…
Walkable amenities ~0.75 mi
Loading nearby amenities…
Taxation est. · year 1
- Rental income
- $21,538
- − Mortgage interest
- −$11,203
- − Property taxes
- −$3,000
- − Insurance
- −$1,000
- − Repairs & maintenance
- −$1,723
- − Management
- −$1,723
- − HOA
- −$3,960
- − Depreciation
- −$5,818
- Taxable loss
- −$6,889
- Est. tax savings @ 24.0%
- +$1,653
- After-tax cash flow
- $-1,877/yr
For passive investors: Depreciation is non-cash, so a rental often shows a tax loss while cash-flowing — sheltering income. Rental losses are passive: they offset passive income freely, and up to $25,000/yr can offset ordinary (W-2) income if you actively participate and your MAGI is under $100k (phasing out to $0 by $150k); unused losses carry forward. On sale, claimed depreciation is recaptured at up to 25%, and gains may owe capital-gains tax (a 1031 exchange can defer both). Figures are a year-1 estimate at your 24.0% rate — not tax advice; consult a CPA.
Condition & rehab AI · 9 photos
This end unit condo is in average condition with some cosmetic repairs and maintenance needed. It offers a spacious layout with a finished basement and attached garage, making it a good opportunity for comfortable living with flexible space for guests, hobbies, work, or entertaining.
Repairs flagged
- Minor Deck — Deck appears to have some wear and tear.
- Minor Landscaping — Landscaping appears somewhat sparse and in need of maintenance.
Value-add opportunities
- Resale Paint exterior siding — Fresh paint can enhance curb appeal and property value.
- Both Landscaping improvements — Improved landscaping can enhance both resale and rental value.
- Resale Deck repair — A repaired deck can add value and functionality to the property.
Renovation cost estimate screening
| Repair item | Severity | Est. cost |
|---|---|---|
| Deck · Deck appears to have some wear and tear. | Minor | $500–3,000 |
| Landscaping · Landscaping appears somewhat sparse and in need of maintenance. | Minor | $500–3,000 |
| Total estimated repair cost · 2 items | $1,000–6,000 |
Value-add ROI direction
- Resale Paint exterior siding — Fresh paint can enhance curb appeal and property value. ↑
- Both Landscaping improvements — Improved landscaping can enhance both resale and rental value. ↑
- Resale Deck repair — A repaired deck can add value and functionality to the property. ↑
ⓘ Cost ranges are severity-bucket heuristics (US national rule-of-thumb). Get contractor quotes + a written scope before underwriting a rehab budget.
Schools (NCES district)
- District
- Ft. Zumwalt R-II
- NCES district ID
- 2908370
- Math proficiency
- 54% ▼ -7.00%
- Reading proficiency
- 60% ▼ -4.00%
- Median HH income
- $75,817
- Composite
- 51.04/100
- National rank
- #1772
- State rank
- #14 of 324 in MO
Livability — St. Peters
No livability data for this city. (Only ~50 U.S. cities are tracked.)
Census & demographics
- Census place
- St. Peters, MO
- County
- Saint Charles County · 399,703 people
- City population
- 74,876
- Metro
- St. Louis, MO-IL
- Population (ZIP)
- 74,962
- Household income
- $96,393
- Rent vs Own
- Severe rent burden
- 964.0
Population outlook (St. Charles County) Hauer SSP2
- Today (2025)
- 437,857 people
- By 2030
- 461,707 · +5.4%
- By 2040
- 503,222 · +14.9%
- By 2050
- 534,684 · +22.1%
- By 2075
- 597,047 · +36.4%
- By 2100
- 609,682 · +39.2%
Race, ethnicity, and origin ACS 2023
- Neighborhood character
- Predominantly White (86%)
- Race & ethnicity
- White 86% Two or more races 6% Black 5% Hispanic / Latino 2% Asian 2%
- Common ancestry
- Lithuanian 3% Romanian 3% Italian 2%
- Foreign-born
- 3% · China, Canada
- Languages at home
- 96% English-only · Spanish 1% Chinese 1% Other Asian/Pacific 1%
Political lean MEDSL · St. Charles
- 2024 margin
- R (+17.0) · D 40.8% · R 57.8% · Other 1.4%
- 2008→2024 swing
- -7.2pp toward R · 2008: -9.7pp · 2024: -17.0pp
- All cycles
- 2024: R+17.0 2020: R+17.5 2016: R+26.4 2012: R+21.0 2008: R+9.7
Not yet ingested
- Civics
- —
Market trends
- HPI YoY
- ▼ -315.50%
- Current HPI
- 230.3362
- Rent YoY
- ▲ 2.69%
- Metro
- St. Louis, MO-IL
- State GDP YoY
- ▲ 1.84%
- F500 in state
- 20
Industry mix (Fortune 500 HQ in MO)
| Industry | F500 HQs | Revenue |
|---|---|---|
| Healthcare | 1 | $163B |
|
||
| Insurance | 1 | $21B |
|
||
| Industrial Technology | 1 | $17B |
|
||
| Retail | 1 | $16B |
|
||
| Industrial Distribution | 1 | $10B |
|
||
| Utilities | 1 | $9B |
|
||
Price history
2 events — show timeline
- 2026-06-12 Contingent — ForSaleByOwner.com
- 2026-06-10 Listed $200,000 ForSaleByOwner.com
Cash-flow waterfall
monthlySold comps — $/sqft
last 12 mo · ≤1 miLoading sold comps…