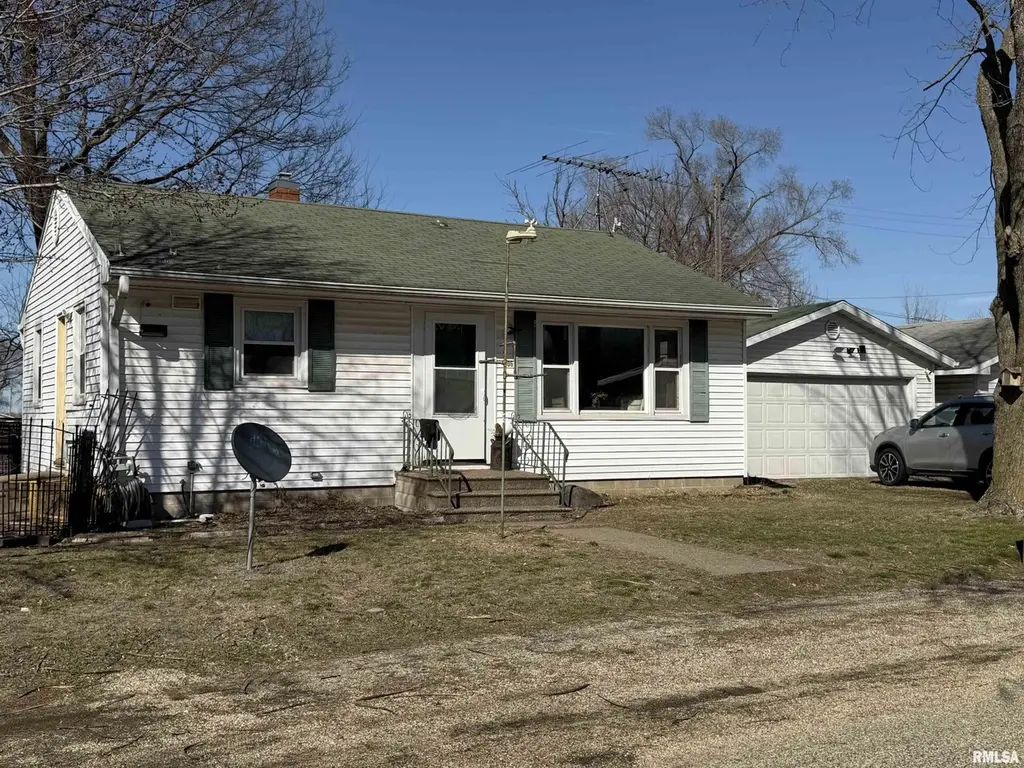
106 W Sycamore St · Gladstone, IL
Flood risk 1/10 · Minimal
- FEMA flood zone
- X (unshaded)
- Chance of flooding over 30 yrs
- 0.0%
- Est. flood insurance / yr
- $507 – $1,088
Fire risk 1/10 · Minimal
- Est. fire insurance / yr
- $804 – $1,492
Heat risk 3/10 · Minor
- Hot days now (above 105°F)
- 7 days/yr
- Hot days in 30 yrs
- 16 days/yr
Wind risk 2/10 · Minimal
- Chance of severe wind over 30 yrs
- —
Air-quality risk 2/10 · Minimal
- Unhealthy air days now
- 0 days/yr
- Unhealthy air days in 30 yrs
- 1 days/yr
Risk factors via First Street. Map © Google.
Why this score? — see what drove the B grade
The composite is a weighted blend of 9 inputs, each scored 0–100. Each bar is that input's sub-score; the figure is the points it added to the 100-point composite (weight × sub-score).
- Cash flow +30.0/30.0
- DSCR +10.0/10.0
- 1% rule +9.3/10.0
- Appreciation +7.6/10.0
- ARV discount +7.0/15.0
- Livability +2.8/5.0
- Rent growth +2.5/5.0
- Condition / age +2.5/5.0
- Schools +0.9/10.0
$59,000
🖨 Deal sheet (PDF) 📄 Offer letter ✓ Due diligence
Listing remarks
This two bed one bath ranch home has full unfinished basement and sits on a corner lot. Home sold as is. Fence not included. Tenant occupied.
Key facts
- Corner lot
- Garage
- Built 1940
Tags
Property features AI
Finance
- Other: Living area 768 (building area total 768); Irregular lot dimensions; Not new construction; Located in Gladstone subdivision
Exterior
- Parking: Detached 1-car garage
- Utilities: Public water; Septic system
- Home design: Single-family residence; Built in 1940
- Construction: Shingle roof
- Exterior features: Fenced yard; Private road access; Level lot
Interior
- Kitchen: Kitchen with vinyl flooring
- Bedrooms: 2 bedrooms (both on the main level)
- Flooring: Hardwood in primary living areas; Carpet in one bedroom; Vinyl in kitchen
- Bathrooms: 1 full bathroom
- Heating & cooling: Forced air heating; Central air conditioning
- Interior features: Full unfinished basement; No fireplaces
- Laundry & utility: Septic system (private wastewater)
Neighborhood map
What this means for you Summary
Snapshot
- This is a 2-bed/1.0-bath single-family listed at $59k.
Deal economics
- At list price, monthly cash flow is $261 ($3k/yr) — positive.
- The deal already cash-flows at list — no discount required.
- Meets the 1% rule at list price ($846 rent vs $59k).
- Recommended offer: $55k (6.0% below list) — sets the bar for market timing.
Location & tenants
- Location reads 56/100 on livability (#1,204 in IL) — a working-class tenant base; expect higher turnover. Strengths: cost of living A+, housing A-; Watch: health & safety C-, crime D-, amenities F.
- West Central CUSD 235 (rural): math 8% / reading 10% proficiency, ranked #581 of 620 in IL (top 94%) — low school quality limits family demand, transient renter base, plan for 1-2y turnover.
- Zoned schools: West Central High School (math 5% / reading 15%, grade F, #528 of 693 statewide, top 82%, 199 students, 0% FRL) — zoned schools average 0% FRL vs 48% district-wide (48 pts lower); this property's tenant base skews higher-income than the district average.
- Market conditions: 6 active listings in the ZIP; 5 units permitted in Henderson County in 2024 (0 in 5+ unit buildings).
Forward outlook
- In year one you build about $3k of equity ($408 loan paydown + $3k appreciation (5.2% local appreciation)).
- Henderson County population projected at -31% by 2050 — secular population decline; favor cash flow + early exit over multi-decade hold.
- At projected returns (5.2% appreciation + 3.0% rent growth), your $17k cash investment doubles in ~3 years — after that, you're playing with house money.
- By year 9, paydown + projected appreciation supports a ~$30k cash-out refi (75% LTV) — recoverable capital for the next deal without selling this one.
Negotiation context
- It's been on market 67 days — a 6% lower offer ($55k) is reasonable based on typical stale-listing flexibility.
Risks & watch-outs
- Watch-outs: built in 1940 — expect roof / HVAC / electrical / plumbing capex.
Questions for the listing agent
- It's been on market 67 days. Have you received any prior offers? Is the seller open to a 6% concession, seller financing, or rate buy-down credit?
- Built in 1940 — when were the roof, HVAC, electrical panel, plumbing, and water heater last replaced?
- Why hasn't it sold? Are there any deal-killer items the seller is aware of (foundation, flood, title, zoning, code violations)?
- Is there a deadline driving the sale (1031 exchange, divorce, estate, relocation)? That informs how much negotiation room exists.
- Schools are F-rated, which usually means shorter tenancies and higher turnover. Who's the typical renter profile here, and what's been the actual vacancy rate?
- Crime grade is D in this area — have there been break-ins, vandalism, or insurance claims at this property in the last 3 years? What carrier currently insures it and at what premium?
- What's the average days-on-market for RENTAL listings here right now (not sales)? A rising rental-DOM trend means longer vacancies and softer asking-rent achievability than the comps imply.
- What's the recent tenant-quality profile in this submarket — average credit score on applications, eviction rate, late-payment / NSF rate, and stable-employment percentage? A property-management company in the area should have these aggregated.
- How much new for-sale + rental construction is in the pipeline within 1–3 miles? Heavy new supply typically softens prices + rents 12–24 months out; constrained supply supports both.
Investment metrics
- 1% rule
- 1.43% ✓
- Cap rate
- 11.60%
- Cash-on-cash
- 18.94%
- DSCR
- 1.84
- GRM
- 5.8
CMA / ARV
- ARV (on-the-fly)
- $58,368
- Comps found
- 2
Show comp detail 2 sales within ~0.75 mi
| Address | Dist | Beds/Ba | Sqft | Sold | Price | $/sf | Match |
|---|---|---|---|---|---|---|---|
| 106 W Sycamore St | 0.00mi | 2/1.0 | 768 (0%) | 0mo | $58,000 | $76 | 100 |
| 403 W Elm St | 0.23mi | 1/1.0 (-1) | 876 (+14%) | 19mo | $25,000 | $29 | 45 |
Match score weights: distance 35% · size 25% · config 20% · recency 20%. Top-matched comps best support the ARV.
Projected returns pro-forma
5.17% appreciation · 3.0% rent growth · sell at horizon
- IRR
- 29.7%
- Equity multiple
- 2.86×
- Total profit
- $30,801
- Equity at exit
- $34,051
- IRR
- 28.2%
- Equity multiple
- 5.75×
- Total profit
- $78,522
- Equity at exit
- $59,284
Cash invested: $16,520 (down + closing). Projections, not guarantees.
Landlord ↔ Tenant lean methodology
- Overall (STATE)
- 43 Moderately Tenant-Leaning
- State Illinois
- 43 Moderately Tenant-Leaning · D+7
- County
- — inherits STATE
- City
- — inherits STATE
ZIP-level market 61437
- Home prices YoY
- 3.5%
- Active inventory
- 6
- Price-to-rent
- 5.8×
Monthly cashflow live
- Estimated rent
- $846 medium interval (Pro) →
- Mortgage (P&I)
- −$309
- Tax est. 1.5%
- −$74 /mo · $885/yr
- Insurance
- −$25
- HOA
- −$0
- Vacancy / Maint / Mgmt
- −$178
- Net cashflow
- $261
Break-even live
Sensitivity live
| Price | -10% $302 | -5% $281 | +0% $261 | +5% $240 | +10% $220 |
|---|---|---|---|---|---|
| Rent | -10% $194 | -5% $227 | +0% $261 | +5% $294 | +10% $328 |
| Rate | -1.0pp $291 | -0.5pp $276 | base $261 | +0.5pp $246 | +1.0pp $230 |
UW: 25.0% down · 7.5% · 30yr · 1.5% tax · 5.0% vac · 8.0% maint · 8.0% mgmt
Financing live
Cash to close
- Down payment
- $14,750
- Closing costs
- $1,770
- Reserves months
- —
- Total cash needed
- —
Loan-product check · same deal, 3 products live
Conventional
25% down · 7.5% · 30yr
- Down + closing
- —
- Monthly P&I
- —
- Monthly cashflow
- —
- DSCR
- —
- Eligible?
- —
Personal DTI + credit; lowest rate.
DSCR
20% down · 8.5% · 30yr
- Down + closing
- —
- Monthly P&I
- —
- Monthly cashflow
- —
- DSCR
- —
- Eligible?
- —
No personal income docs; deal must DSCR.
Hard money
10% down · 12.0% · 12mo
- Down + closing
- —
- Monthly P&I
- —
- Monthly cashflow
- —
- DSCR
- —
- Eligible?
- —
Short-term bridge; refi at stabilization.
Listing history 10 events
-
2026-06-09days on market $59,000 Under Contract 67 DOM
-
2026-06-08days on market $59,000 Under Contract 66 DOM
-
2026-06-07days on market $59,000 Under Contract 65 DOM
-
2026-06-07days on market $59,000 Under Contract 64 DOM
-
2026-06-02days on market $59,000 Under Contract 60 DOM
-
2026-06-01days on market $59,000 Under Contract 59 DOM
-
2026-05-31days on market $59,000 Under Contract 58 DOM
-
2026-05-30days on market $59,000 Under Contract 57 DOM
-
2026-04-11historical Under Contract
-
2026-03-25$59,000 Active
ⓘ Source: listings_history table (triggers on properties + properties_extension) + one-shot
backfill from property_details.listing_events for pre-trigger history.
Climate risk First Street
- Flood 1/10 Low FEMA zone X (unshaded) · 0% chance over 30 yrs
- Wildfire 1/10 Low
- Heat 3/10 Moderate 7 d/yr ≥105°F today · 16 d/yr by 30 yrs out
- Wind 2/10 Low
- Air quality 2/10 Low 0 unhealthy d/yr today · 1 by 30 yrs out
Nearby sold comps map
Loading sold comps map…
Walkable amenities ~0.75 mi
Loading nearby amenities…
Taxation est. · year 1
- Rental income
- $10,155
- − Mortgage interest
- −$3,305
- − Property taxes
- −$885
- − Insurance
- −$295
- − Repairs & maintenance
- −$812
- − Management
- −$812
- − Depreciation
- −$1,716
- Taxable income
- $2,329
- Est. tax owed @ 24.0%
- −$559
- After-tax cash flow
- $2,571/yr
For passive investors: Depreciation is non-cash, so a rental often shows a tax loss while cash-flowing — sheltering income. Rental losses are passive: they offset passive income freely, and up to $25,000/yr can offset ordinary (W-2) income if you actively participate and your MAGI is under $100k (phasing out to $0 by $150k); unused losses carry forward. On sale, claimed depreciation is recaptured at up to 25%, and gains may owe capital-gains tax (a 1031 exchange can defer both). Figures are a year-1 estimate at your 24.0% rate — not tax advice; consult a CPA.
Schools (NCES district)
- District
- West Central CUSD 235
- NCES district ID
- 1700319
- Math proficiency
- 8% ▼ -3.00%
- Reading proficiency
- 10% ▼ -9.00%
- Median HH income
- $47,424
- Composite
- 8.55/100
- National rank
- #9902
- State rank
- #581 of 620 in IL
Livability — Gladstone
- Score
- 56/100
- State rank
- #1204
- US rank
- #22661
Category grades
Schools grade is shown separately in the Schools card above.
Census & demographics
- Census place
- Gladstone, IL
- Population (ZIP)
- 504
Population outlook (Henderson County) Hauer SSP2
- Today (2025)
- 6,231 people
- By 2030
- 5,815 · -6.7%
- By 2040
- 5,016 · -19.5%
- By 2050
- 4,310 · -30.8%
- By 2075
- 3,166 · -49.2%
- By 2100
- 2,285 · -63.3%
Race, ethnicity, and origin ACS 2023
- Neighborhood character
- Predominantly White (98%)
- Race & ethnicity
- White 98%
- Common ancestry
- Portuguese 3% Iranian 2%
Political lean MEDSL · Henderson
- 2024 margin
- Solid R (+38.8) · D 29.6% · R 68.4% · Other 1.9%
- 2008→2024 swing
- -56.5pp toward R · 2008: 17.7pp · 2024: -38.8pp
- All cycles
- 2024: R+38.8 2020: R+33.0 2016: R+28.8 2012: D+12.3 2008: D+17.7
Not yet ingested
- Civics
- —
Market trends
- HPI YoY
- ▲ 5.17%
- Current HPI
- 150.9837
- Rent YoY
- —
- Metro
- —
- State GDP YoY
- ▲ 1.59%
- F500 in state
- 60
Industry mix (Fortune 500 HQ in IL)
| Industry | F500 HQs | Revenue |
|---|---|---|
| Insurance | 4 | $201B |
|
||
| Consumer Goods | 4 | $87B |
|
||
| Industrial Machinery | 3 | $64B |
|
||
| Healthcare | 2 | $55B |
|
||
| Retail / Pharmacy | 1 | $148B |
|
||
| Agriculture / Food | 1 | $86B |
|
||
Price history
2 events — show timeline
- 2026-04-11 Contingent — RMLSA as Distributed by MLS Grid
- 2026-03-25 Listed $59,000 RMLSA as Distributed by MLS Grid
Property tax history
+13.2%/yrLatest (2024): $59 · +3.7% YoY. Source: county tax records.
Cash-flow waterfall
monthlySold comps — $/sqft
last 12 mo · ≤1 miLoading sold comps…