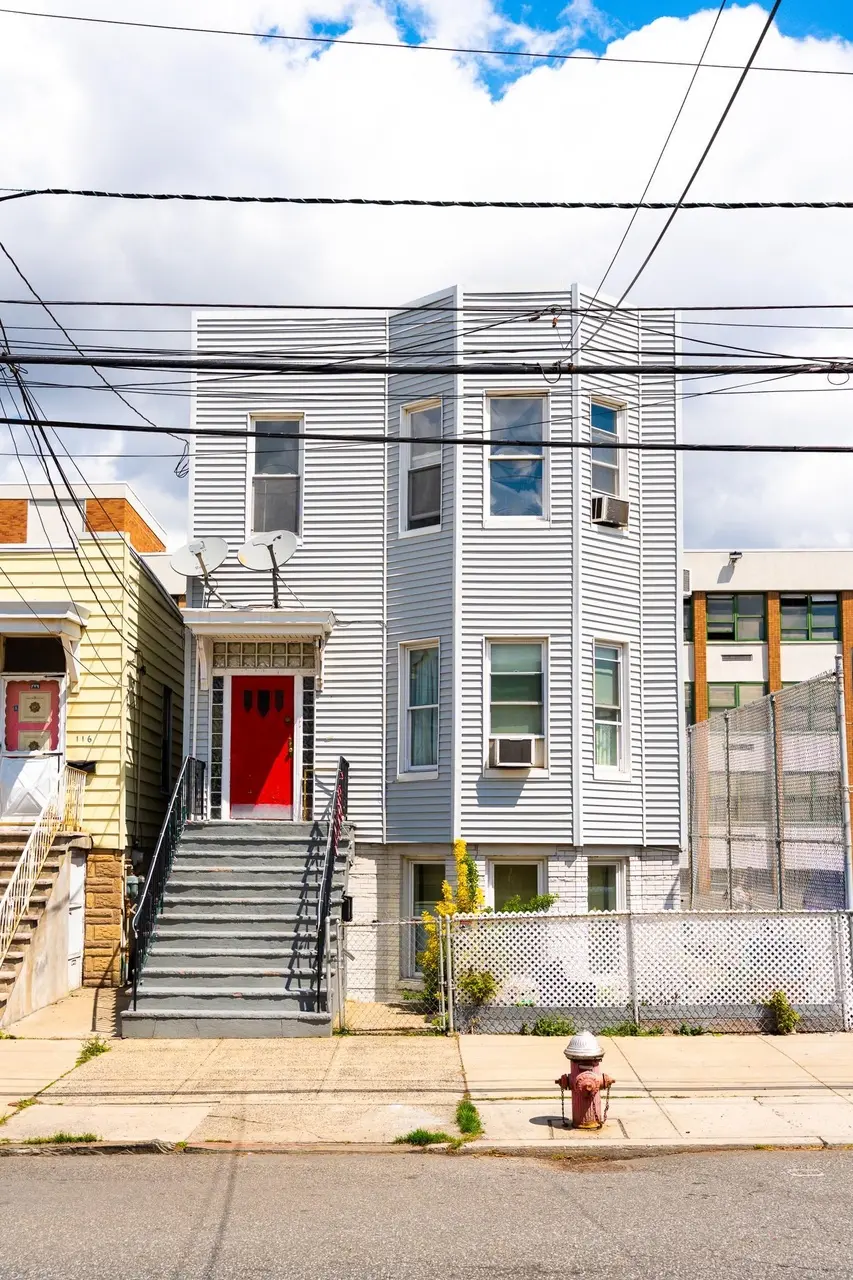
114 GRAHAM St · Jersey City, NJ
Flood risk 1/10 · Minimal
- FEMA flood zone
- X (unshaded)
- Chance of flooding over 30 yrs
- 0.0%
- Est. flood insurance / yr
- $473 – $860
Fire risk 1/10 · Minimal
- Est. fire insurance / yr
- $526 – $976
Heat risk 7/10 · Major
- Hot days now (above 98°F)
- 7 days/yr
- Hot days in 30 yrs
- 15 days/yr
Wind risk 6/10 · Moderate
- Chance of severe wind over 30 yrs
- 27.0%
Air-quality risk 3/10 · Minor
- Unhealthy air days now
- 3 days/yr
- Unhealthy air days in 30 yrs
- 4 days/yr
Risk factors via First Street. Map © Google.
Why this score? — see what drove the F grade
The composite is a weighted blend of 9 inputs, each scored 0–100. Each bar is that input's sub-score; the figure is the points it added to the 100-point composite (weight × sub-score).
- ARV discount +7.5/15.0
- Cash flow +4.0/30.0
- Livability +3.9/5.0
- Rent growth +3.3/5.0
- Condition / age +2.5/5.0
- Schools +2.4/10.0
- 1% rule +0.0/10.0
- DSCR +0.0/10.0
- Appreciation +0.0/10.0
$799,999
🖨 Deal sheet (PDF) 📄 Offer letter ✓ Due diligence
Listing remarks
Opportunity knocks in Jersey City's Heights neighborhood. This three-family property represents exactly the kind of value-add acquisition that serious investors have been hunting for. The possibilities are wide open: renovate and hold, tap into the rental opportunities across three units, or demo and build new. 114 Graham Street gives you the canvas. The multiple units and flexible layout offer endless potential, and the basement, while finished, is ready for a full renovation to unlock even more. The Heights continues to be one of Jersey City's most sought-after neighborhoods, known for its tree-lined streets and local parks that draw families and young professionals alike. Commuters are w
Key facts
- Nj transit buses
- Flexible layout
- Finished basement
Tags
Property features AI
Finance
- Financial info: Taxes listed for 2025
Exterior
- Parking: No parking available
- Home design: Multi-level property with living rooms on basement, first and second levels
- Construction: Lead paint form: Yes
- Exterior features: Aluminum/vinyl and brick exterior
Interior
- Kitchen: Three separate kitchens (one on each level)
- Bedrooms: Basement bedroom: 1; First floor bedrooms: 2; Second floor bedrooms: 3
- Bathrooms: Total of 3 full bathrooms; Basement has 1 full bathroom; First floor has 1 full bathroom; Second floor has 1 full bathroom
- Heating & cooling: Radiator heating
- Interior features: Partial finished basement; Appliances and fixtures included (personal belongings excluded); Raditor heating system
Neighborhood map
What this means for you Summary
Snapshot
- This is a 6-bed/3.0-bath single-family listed at $800k.
Deal economics
- At list price, monthly cash flow is $-2k ($-27k/yr) — negative.
- To cash-flow at today's rent, offer at most $407k (49.1% below list).
- To meet the 1% rule (rent ≥ 1% of price), the offer needs to be $386k (51.7% below list).
- Recommended offer: $386k (51.7% below list) — sets the bar for 1% rule.
- Cap rate 3.0% vs local median 1.8% in Jersey City — top-decile yield for the area; either an underpriced asset or a hidden risk that comps aren't pricing in. Stress-test before assuming the spread holds.
Location & tenants
- Location reads 77/100 on livability (#116 in NJ, #2,955 nationally) — a middle-class / working-renter tenant base. Strengths: amenities A+, commute A+, employment A+; Watch: crime F, cost of living F.
- Jersey City Public Schools (urban): math 16% / reading 38% proficiency, ranked #369 of 472 in NJ (top 78%) — low school quality limits family demand, transient renter base, plan for 1-2y turnover; 69% free/reduced lunch — lower-income household profile, screen leases tightly.
- Market conditions: Rents rising (+3.0%/yr); 289 active listings in the ZIP; solid renter incomes; 5,310 units permitted in Hudson County in 2024 (4,154 in 5+ unit buildings).
- At $3,861/mo this rent would consume 56% of the median local household income ($83k/yr) (locally 2550% of renters already pay >50% of income on rent) — very limited rent-growth headroom before tenants either downsize or default.
Forward outlook
- Local home prices are declining (-3.0%/yr); year-one equity from $6k of loan paydown is wiped out by about $24k of value loss. Plan a longer hold.
- Hudson County population projected at +29% by 2050 — long-run rental-demand tailwind backs the buy-and-hold thesis.
Negotiation context
- It's been on market 23 days — a 2% lower offer ($788k) is reasonable based on typical stale-listing flexibility.
- Current owner paid $115k; list at $800k implies a 596% gain — meaningful room to come down on a strong offer.
Risks & watch-outs
- Watch-outs: built in 1900 — expect roof / HVAC / electrical / plumbing capex.
- Climate carrying-cost: major wind risk, 27% chance of damaging wind over 30y; extreme-heat days projected 7→15/yr by 2055 (HVAC capex compounding) — expect insurance premiums to compound above CPI over the hold.
Questions for the listing agent
- What do current leases actually rent for vs. the listed asking? Can we see a recent rent roll and the last 12 months of T-12 income?
- Built in 1900 — when were the roof, HVAC, electrical panel, plumbing, and water heater last replaced?
- Is there a deadline driving the sale (1031 exchange, divorce, estate, relocation)? That informs how much negotiation room exists.
- Schools are B-rated — typically a magnet for longer-tenancy family renters. What's the average tenant stay here, and is there a school-zone premium baked into asking?
- Crime grade is F in this area — have there been break-ins, vandalism, or insurance claims at this property in the last 3 years? What carrier currently insures it and at what premium?
- The area grade is low — what's the realistic commute time and amenity access for the typical tenant pool here? Any planned neighborhood developments (good or bad) we should know about?
- What's the average days-on-market for RENTAL listings here right now (not sales)? A rising rental-DOM trend means longer vacancies and softer asking-rent achievability than the comps imply.
- What's the recent tenant-quality profile in this submarket — average credit score on applications, eviction rate, late-payment / NSF rate, and stable-employment percentage? A property-management company in the area should have these aggregated.
- How much new for-sale + rental construction is in the pipeline within 1–3 miles? Heavy new supply typically softens prices + rents 12–24 months out; constrained supply supports both.
Investment metrics
- 1% rule
- 0.48% ✗
- Cap rate
- 2.95%
- Cash-on-cash
- -11.92%
- DSCR
- 0.47
- GRM
- 17.3
CMA / ARV
No comps found within radius.
Projected returns pro-forma
-3.0% appreciation · 3.04% rent growth · sell at horizon
- IRR
- -38.2%
- Equity multiple
- -0.21×
- Total profit
- $-271,328
- Equity at exit
- $119,282
- IRR
- -57.4%
- Equity multiple
- -0.87×
- Total profit
- $-418,553
- Equity at exit
- $69,169
Cash invested: $224,000 (down + closing). Projections, not guarantees.
Landlord ↔ Tenant lean methodology
- Overall (CITY)
- 6 Strongly Tenant-Friendly
- State New Jersey
- 21 Tenant-Leaning · D+6
- County
- — inherits STATE
- City Jersey City
- 6 Strongly Tenant-Friendly · D+34
ZIP-level market 07307
- Rents YoY
- 3.0%
- Active inventory
- 289
- Price-to-rent
- 17.3×
Monthly cashflow live
- Estimated rent
- $3,861 medium interval (Pro) →
- Mortgage (P&I)
- −$4,195
- Tax from tax record
- −$747 /mo · $8,964/yr
- Insurance
- −$333
- HOA
- −$0
- Vacancy / Maint / Mgmt
- −$811
- Net cashflow
- $-2,226
Break-even live
Sensitivity live
| Price | -10% $-1,773 | -5% $-1,999 | +0% $-2,226 | +5% $-2,452 | +10% $-2,679 |
|---|---|---|---|---|---|
| Rent | -10% $-2,531 | -5% $-2,378 | +0% $-2,226 | +5% $-2,073 | +10% $-1,921 |
| Rate | -1.0pp $-1,823 | -0.5pp $-2,022 | base $-2,226 | +0.5pp $-2,433 | +1.0pp $-2,644 |
UW: 25.0% down · 7.5% · 30yr · 1.5% tax · 5.0% vac · 8.0% maint · 8.0% mgmt
Financing live
Cash to close
- Down payment
- $200,000
- Closing costs
- $24,000
- Reserves months
- —
- Total cash needed
- —
Loan-product check · same deal, 3 products live
Conventional
25% down · 7.5% · 30yr
- Down + closing
- —
- Monthly P&I
- —
- Monthly cashflow
- —
- DSCR
- —
- Eligible?
- —
Personal DTI + credit; lowest rate.
DSCR
20% down · 8.5% · 30yr
- Down + closing
- —
- Monthly P&I
- —
- Monthly cashflow
- —
- DSCR
- —
- Eligible?
- —
No personal income docs; deal must DSCR.
Hard money
10% down · 12.0% · 12mo
- Down + closing
- —
- Monthly P&I
- —
- Monthly cashflow
- —
- DSCR
- —
- Eligible?
- —
Short-term bridge; refi at stabilization.
Listing history 7 events
-
2026-05-13status Under Contract
-
2026-04-20$799,999 Active
-
1986-10-24soldstatus $115,000
-
1986-04-02soldstatus $115,000
-
1985-07-01soldstatus $65,000
-
1980-11-01soldstatus $30,000
-
1980-11-01soldstatus $30,000
ⓘ Source: listings_history table (triggers on properties + properties_extension) + one-shot
backfill from property_details.listing_events for pre-trigger history.
Tax reassessment forecast NJ · Partial reset (capped growth)
- Current annual tax
- $8,964 · $747/mo
- Projected year-2 tax
- $14,442 · $1,204/mo
- Expected delta
- +$5,478/yr (+$456/mo · 61.1%)
ⓘ Screening estimate from a state-policy table — verify with the county assessor before closing.
Climate risk First Street
- Flood 1/10 Low FEMA zone X (unshaded) · 0% chance over 30 yrs
- Wildfire 1/10 Low
- Heat 7/10 Severe 7 d/yr ≥98°F today · 15 d/yr by 30 yrs out
- Wind 6/10 Major 27% chance of damaging wind over 30 yrs
- Air quality 3/10 Moderate 3 unhealthy d/yr today · 4 by 30 yrs out
Nearby sold comps map
Loading sold comps map…
Walkable amenities ~0.75 mi
Loading nearby amenities…
Taxation est. · year 1
- Rental income
- $46,329
- − Mortgage interest
- −$44,812
- − Property taxes
- −$8,964
- − Insurance
- −$4,000
- − Repairs & maintenance
- −$3,706
- − Management
- −$3,706
- − Depreciation
- −$23,273
- Taxable loss
- −$42,133
- Est. tax savings @ 24.0%
- +$10,112
- After-tax cash flow
- $-16,596/yr
For passive investors: Depreciation is non-cash, so a rental often shows a tax loss while cash-flowing — sheltering income. Rental losses are passive: they offset passive income freely, and up to $25,000/yr can offset ordinary (W-2) income if you actively participate and your MAGI is under $100k (phasing out to $0 by $150k); unused losses carry forward. On sale, claimed depreciation is recaptured at up to 25%, and gains may owe capital-gains tax (a 1031 exchange can defer both). Figures are a year-1 estimate at your 24.0% rate — not tax advice; consult a CPA.
Schools (NCES district)
- District
- Jersey City Public Schools
- NCES district ID
- 3407830
- Math proficiency
- 16% ▼ -17.00%
- Reading proficiency
- 38% ▼ -11.00%
- Median HH income
- $58,431
- Composite
- 24.43/100
- National rank
- #7678
- State rank
- #369 of 472 in NJ
Livability — Jersey City
- Score
- 77/100
- State rank
- #116
- US rank
- #2955
Category grades
Schools grade is shown separately in the Schools card above.
Census & demographics
- Census place
- Jersey City, NJ
- County
- Hudson County · 718,323 people
- City population
- 294,078
- Metro
- New York-Newark-Jersey City, NY-NJ-PA
- Population (ZIP)
- 42,645
- Household income
- $83,297
- Rent vs Own
- Severe rent burden
- 2550.0
Population outlook (Hudson County) Hauer SSP2
- Today (2025)
- 771,834 people
- By 2030
- 818,028 · +6.0%
- By 2040
- 907,866 · +17.6%
- By 2050
- 994,480 · +28.8%
- By 2075
- 1,163,301 · +50.7%
- By 2100
- 1,254,703 · +62.6%
Race, ethnicity, and origin ACS 2023
- Neighborhood character
- Diverse neighborhood (Simpson 0.69)
- Race & ethnicity
- Hispanic / Latino 42% White 27% Asian 24% Two or more races 18% Black 5%
- Hispanic origin (detail)
- Mexican 3% Puerto Rican 12% Cuban 2% Dominican 9% Salvadoran 1%
- Common ancestry
- Romanian 2% Scotch-Irish 1%
- Foreign-born
- 43% · Canada, Jamaica, China
- Languages at home
- 41% English-only · Spanish 32% Other Indo-European 16% Other Asian/Pacific 4%
Political lean MEDSL · Hudson
- 2024 margin
- Strong D (+28.1) · D 62.6% · R 34.6% · Other 2.8%
- 2008→2024 swing
- -18.7pp toward R · 2008: 46.7pp · 2024: 28.1pp
- All cycles
- 2024: D+28.1 2020: D+46.2 2016: D+51.8 2012: D+55.7 2008: D+46.7
Not yet ingested
- Civics
- —
Market trends
- HPI YoY
- ▼ -271.12%
- Current HPI
- 471.33
- Rent YoY
- ▲ 3.04%
- Metro
- New York-Newark-Jersey City, NY-NJ-PA
- State GDP YoY
- ▲ 2.05%
- F500 in state
- 34
Industry mix (Fortune 500 HQ in NJ)
| Industry | F500 HQs | Revenue |
|---|---|---|
| Consumer Goods | 3 | $31B |
|
||
| Pharmaceuticals | 2 | $153B |
|
||
| Technology | 2 | $21B |
|
||
| Insurance | 2 | $20B |
|
||
| Healthcare | 2 | $19B |
|
||
| Financial Services | 1 | $70B |
|
||
Price history
+2566.7% since first listed7 events — show timeline
- 2026-05-13 Pending — HCMLS
- 2026-04-20 Listed $799,999 HCMLS
- 1986-10-24 Sold (Public Records) $115,000 Public Records
- 1986-04-02 Sold (Public Records) $115,000 Public Records
- 1985-07-01 Sold (Public Records) $65,000 Public Records
- 1980-11-01 Sold (Public Records) $30,000 Public Records
- 1980-11-01 Sold (Public Records) $30,000 Public Records
Property tax history
+1.0%/yrLatest (2025): $8,964 · +4.6% YoY. Source: county tax records.
Cash-flow waterfall
monthlySold comps — $/sqft
last 12 mo · ≤1 miLoading sold comps…