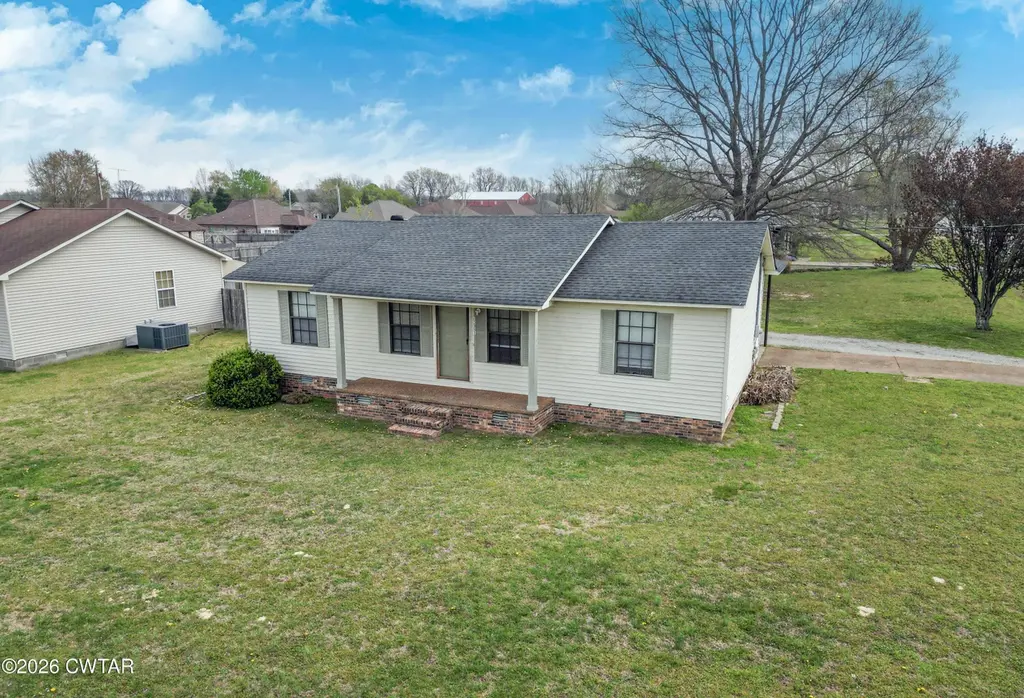
1530 Belle Meade Rd · Bells, TN
Flood risk 1/10 · Minimal
- FEMA flood zone
- X (unshaded)
- Chance of flooding over 30 yrs
- 0.0%
- Est. flood insurance / yr
- $507 – $1,088
Fire risk 1/10 · Minimal
- Est. fire insurance / yr
- $949 – $1,763
Heat risk 7/10 · Major
- Hot days now (above 109°F)
- 7 days/yr
- Hot days in 30 yrs
- 20 days/yr
Wind risk 4/10 · Minor
- Chance of severe wind over 30 yrs
- 14.0%
Air-quality risk 1/10 · Minimal
- Unhealthy air days now
- 0 days/yr
- Unhealthy air days in 30 yrs
- 0 days/yr
Risk factors via First Street. Map © Google.
Why this score? — see what drove the D+ grade
The composite is a weighted blend of 9 inputs, each scored 0–100. Each bar is that input's sub-score; the figure is the points it added to the 100-point composite (weight × sub-score).
- ARV discount +15.0/15.0
- Cash flow +9.1/30.0
- Appreciation +6.8/10.0
- Schools +4.0/10.0
- Livability +3.2/5.0
- DSCR +2.5/10.0
- Rent growth +2.5/5.0
- Condition / age +2.5/5.0
- 1% rule +2.0/10.0
$179,000
🖨 Deal sheet 📄 Offer letter ✓ Due diligence
Listing remarks
3BR/1.5BA home situated on a corner lot in Bells, TN. This property features a functional layout with comfortable living spaces, a carport with attached storage room, and a large yard offering plenty of space for outdoor enjoyment. Conveniently located near schools, shopping, and everyday amenities, this home provides both accessibility and practicality. Great opportunity for buyers looking for a well-located property with added outdoor space.
Key facts
- Near schools
- Near shopping
- Carport
Tags
Property features AI
Finance
- Financial info: Annual tax amount listed
Exterior
- Parking: Four total parking spaces; Two-space carport
- Utilities: Public water; Public sewer; Electricity connected; Natural gas connected; Natural gas available
- Home design: Single-family residence; One story; Raised foundation
- Construction: Residential construction
- Exterior features: Corner lot; Covered front porch; Patio/porch
Interior
- Kitchen: Electric range; Dishwasher
- Bedrooms: Three main-level bedrooms
- Bathrooms: One full bathroom; One half bathroom; Two main-level bathrooms
- Heating & cooling: Central heating (natural gas); Central air conditioning; Ceiling fans; Electric cooling
- Interior features: Dishwasher; Electric range; Gas water heater; Covered front porch
- Laundry & utility: Laundry room with washer and electric dryer hookups
Neighborhood map
What this means for you Summary
Snapshot
- This is a 3-bed/1.0-bath single-family listed at $179k.
Deal economics
- At list price, monthly cash flow is $-136 ($-2k/yr) — negative.
- To cash-flow at today's rent, offer at most $155k (13.4% below list).
- To meet the 1% rule (rent ≥ 1% of price), the offer needs to be $126k (29.9% below list).
- Recommended offer: $126k (29.9% below list) — sets the bar for 1% rule.
Location & tenants
- Location reads 65/100 on livability (#156 in TN) — a middle-class / working-renter tenant base. Strengths: crime A+, cost of living A+, housing A+; Watch: health & safety C-, schools D-, amenities F.
- Bells (town): math 60% / reading 30% proficiency, ranked #22 of 145 in TN (top 15%) — families likely to look elsewhere, expect single-tenant / working-renter base with shorter leases; 61% free/reduced lunch — lower-income household profile, screen leases tightly.
- Market conditions: 25 active listings in the ZIP; 26 units permitted in Crockett County in 2024 (0 in 5+ unit buildings).
Forward outlook
- In year one you build about $8k of equity ($1k loan paydown + $6k appreciation (3.5% local appreciation)).
- By year 5, paydown + projected appreciation supports a ~$33k cash-out refi (75% LTV) — recoverable capital for the next deal without selling this one.
Negotiation context
- It's been on market 81 days — a 6% lower offer ($168k) is reasonable based on typical stale-listing flexibility.
- Current owner paid $43k; list at $179k implies a 320% gain — meaningful room to come down on a strong offer.
Risks & watch-outs
- Climate carrying-cost: extreme-heat days projected 7→20/yr by 2055 (HVAC capex compounding) — expect insurance premiums to compound above CPI over the hold.
Questions for the listing agent
- What do current leases actually rent for vs. the listed asking? Can we see a recent rent roll and the last 12 months of T-12 income?
- It's been on market 81 days. Have you received any prior offers? Is the seller open to a 30% concession, seller financing, or rate buy-down credit?
- Why hasn't it sold? Are there any deal-killer items the seller is aware of (foundation, flood, title, zoning, code violations)?
- Is there a deadline driving the sale (1031 exchange, divorce, estate, relocation)? That informs how much negotiation room exists.
- Schools are D-rated, which usually means shorter tenancies and higher turnover. Who's the typical renter profile here, and what's been the actual vacancy rate?
- The area grade is low — what's the realistic commute time and amenity access for the typical tenant pool here? Any planned neighborhood developments (good or bad) we should know about?
- What's the average days-on-market for RENTAL listings here right now (not sales)? A rising rental-DOM trend means longer vacancies and softer asking-rent achievability than the comps imply.
- What's the recent tenant-quality profile in this submarket — average credit score on applications, eviction rate, late-payment / NSF rate, and stable-employment percentage? A property-management company in the area should have these aggregated.
- How much new for-sale + rental construction is in the pipeline within 1–3 miles? Heavy new supply typically softens prices + rents 12–24 months out; constrained supply supports both.
Investment metrics
- 1% rule
- 0.70% ✗
- Cap rate
- 5.38%
- Cash-on-cash
- -3.26%
- DSCR
- 0.85
- GRM
- 11.9
CMA / ARV
- ARV (on-the-fly)
- $238,720
- Comps found
- 12
Show comp detail 12 sales within ~0.75 mi
| Address | Dist | Beds/Ba | Sqft | Sold | Price | $/sf | Match |
|---|---|---|---|---|---|---|---|
| 290 Taylor Dr | 0.06mi | 3/2.0 | 1,357 (-9%) | 10mo | $247,000 | $182 | 69 |
| 171 Taylor Dr | 0.13mi | 4/2.0 (+1) | 1,524 (+2%) | 19mo | $245,000 | $161 | 66 |
| 41 King Cv | 0.07mi | 3/2.0 | 1,316 (-12%) | 10mo | $199,900 | $152 | 65 |
| 250 Taylor Dr | 0.09mi | 3/2.0 | 1,330 (-11%) | 12mo | $227,500 | $171 | 64 |
| 136 Layne Dr | 0.36mi | 3/2.0 | 1,380 (-8%) | 7mo | $225,000 | $163 | 61 |
| 47 Hunter Ln | 0.25mi | 3/3.0 | 1,563 (+5%) | 16mo | $250,000 | $160 | 59 |
| 1637 Bell Meade Rd | 0.12mi | 4/2.0 (+1) | 1,690 (+13%) | 10mo | $262,500 | $155 | 55 |
| 158 Taylor Dr | 0.33mi | 3/2.0 | 1,360 (-9%) | 18mo | $214,000 | $157 | 51 |
| 200 Layne Dr | 0.42mi | 4/2.0 (+1) | 1,570 (+5%) | 16mo | $235,000 | $150 | 50 |
| 104 Layne Dr | 0.33mi | 4/2.0 (+1) | 1,589 (+6%) | 20mo | $250,000 | $157 | 48 |
| 47 Crider Dr | 0.74mi | 4/1.5 (+1) | 1,504 (+1%) | 14mo | $185,000 | $123 | 45 |
| 30 Rolling Hills Dr | 0.73mi | 3/2.0 | 1,694 (+14%) | 4mo | $309,900 | $183 | 36 |
Match score weights: distance 35% · size 25% · config 20% · recency 20%. Top-matched comps best support the ARV.
Projected returns pro-forma
3.53% appreciation · 3.0% rent growth · sell at horizon
- IRR
- 6.0%
- Equity multiple
- 1.36×
- Total profit
- $17,935
- Equity at exit
- $85,909
- IRR
- 8.7%
- Equity multiple
- 2.39×
- Total profit
- $69,796
- Equity at exit
- $136,776
Cash invested: $50,120 (down + closing). Projections, not guarantees.
Landlord ↔ Tenant lean methodology
- Overall (STATE)
- 87 Strongly Landlord-Friendly
- State Tennessee
- 87 Strongly Landlord-Friendly · R+13
- County
- — inherits STATE
- City
- — inherits STATE
ZIP-level market 38006
- Home prices YoY
- 1.3%
- Active inventory
- 25
- Price-to-rent
- 11.9×
Monthly cashflow live
- Estimated rent
- $1,255 medium interval (Pro) →
- Mortgage (P&I)
- −$939
- Tax from tax record
- −$115 /mo · $1,375/yr
- Insurance
- −$75
- HOA
- −$0
- Vacancy / Maint / Mgmt
- −$264
- Net cashflow
- $-136
Break-even live
UW: 25.0% down · 7.5% · 30yr · 1.5% tax · 5.0% vac · 8.0% maint · 8.0% mgmt
Financing live
Cash to close
- Down payment
- $44,750
- Closing costs
- $5,370
- Reserves months
- —
- Total cash needed
- —
Loan-product check · same deal, 3 products live
Conventional
25% down · 7.5% · 30yr
- Down + closing
- —
- Monthly P&I
- —
- Monthly cashflow
- —
- DSCR
- —
- Eligible?
- —
Personal DTI + credit; lowest rate.
DSCR
20% down · 8.5% · 30yr
- Down + closing
- —
- Monthly P&I
- —
- Monthly cashflow
- —
- DSCR
- —
- Eligible?
- —
No personal income docs; deal must DSCR.
Hard money
10% down · 12.0% · 12mo
- Down + closing
- —
- Monthly P&I
- —
- Monthly cashflow
- —
- DSCR
- —
- Eligible?
- —
Short-term bridge; refi at stabilization.
Listing history 20 events
-
2026-06-19days on market $179,000 Active 81 DOM
-
2026-06-18days on market $179,000 Active 80 DOM
-
2026-06-18status $179,000 Active 79 DOM
-
2026-06-15statusdays on market $179,000 Pending 79 DOM
-
2026-06-14days on market $179,000 Active 78 DOM
-
2026-06-13days on market $179,000 Active 77 DOM
-
2026-06-10days on market $179,000 Active 75 DOM
-
2026-06-09days on market $179,000 Active 74 DOM
-
2026-06-08days on market $179,000 Active 73 DOM
-
2026-06-07days on market $179,000 Active 72 DOM
-
2026-06-05days on market $179,000 Active 69 DOM
-
2026-06-03days on market $179,000 Active 68 DOM
-
2026-06-03price $179,000 Active 67 DOM
-
2026-06-02days on market $189,900 Active 67 DOM
-
2026-06-01days on market $189,900 Active 66 DOM
-
2026-05-31days on market $189,900 Active 65 DOM
-
2026-05-30days on market $189,900 Active 64 DOM
-
2026-04-20price $189,900
-
2026-03-25$205,000 Active
-
2001-02-14soldstatus $42,635
ⓘ Source: listings_history table (triggers on properties + properties_extension) + one-shot
backfill from property_details.listing_events for pre-trigger history.
Tax reassessment forecast TN · Resets to sale price
- Current annual tax
- $1,375 · $115/mo
- Projected year-2 tax
- $1,375 · $115/mo
- Expected delta
- $0/yr ($0/mo · 0.0%)
ⓘ Screening estimate from a state-policy table — verify with the county assessor before closing.
Climate risk First Street
- Flood 1/10 Low FEMA zone X (unshaded) · 0% chance over 30 yrs
- Wildfire 1/10 Low
- Heat 7/10 Severe 7 d/yr ≥109°F today · 20 d/yr by 30 yrs out
- Wind 4/10 Moderate 14% chance of damaging wind over 30 yrs
- Air quality 1/10 Low 0 unhealthy d/yr today · 0 by 30 yrs out
Nearby sold comps map
Loading sold comps map…
Walkable amenities ~0.75 mi
Loading nearby amenities…
Taxation est. · year 1
- Rental income
- $15,062
- − Mortgage interest
- −$10,027
- − Property taxes
- −$1,375
- − Insurance
- −$895
- − Repairs & maintenance
- −$1,205
- − Management
- −$1,205
- − Depreciation
- −$5,207
- Taxable loss
- −$4,852
- Est. tax savings @ 24.0%
- +$1,164
- After-tax cash flow
- $-471/yr
For passive investors: Depreciation is non-cash, so a rental often shows a tax loss while cash-flowing — sheltering income. Rental losses are passive: they offset passive income freely, and up to $25,000/yr can offset ordinary (W-2) income if you actively participate and your MAGI is under $100k (phasing out to $0 by $150k); unused losses carry forward. On sale, claimed depreciation is recaptured at up to 25%, and gains may owe capital-gains tax (a 1031 exchange can defer both). Figures are a year-1 estimate at your 24.0% rate — not tax advice; consult a CPA.
Schools (NCES district)
- District
- Bells
- NCES district ID
- 4700210
- Math proficiency
- 60% ▲ 5.00%
- Reading proficiency
- 30% ▼ -10.00%
- Median HH income
- $42,217
- Composite
- 40.18/100
- National rank
- #7829
- State rank
- #22 of 145 in TN
Livability — Bells
- Score
- 65/100
- State rank
- #156
- US rank
- #13510
Category grades
Schools grade is shown separately in the Schools card above.
Census & demographics
- Census place
- Bells, TN
- Population (ZIP)
- 5,375
Population outlook (Crockett County) Hauer SSP2
- Today (2025)
- 14,795 people
- By 2030
- 14,812 · +0.1%
- By 2040
- 14,811 · +0.1%
- By 2050
- 14,809 · +0.1%
- By 2075
- 15,405 · +4.1%
- By 2100
- 16,200 · +9.5%
Race, ethnicity, and origin ACS 2023
- Neighborhood character
- Predominantly White (72%)
- Race & ethnicity
- White 72% Hispanic / Latino 13% Black 12% Two or more races 8%
- Hispanic origin (detail)
- Mexican 6%
- Common ancestry
- Italian 1% Serbian 1% Slovak 1%
- Foreign-born
- 5% · Canada
- Languages at home
- 91% English-only · Spanish 9%
Political lean MEDSL · Crockett
- 2024 margin
- Solid R (+58.7) · D 20.2% · R 78.9%
- 2008→2024 swing
- -25.2pp toward R · 2008: -33.6pp · 2024: -58.7pp
- All cycles
- 2024: R+58.7 2020: R+53.8 2016: R+49.7 2012: R+38.4 2008: R+33.6
Not yet ingested
- Civics
- —
Market trends
- HPI YoY
- ▲ 3.53%
- Current HPI
- 271.5507
- Rent YoY
- —
- Metro
- —
- State GDP YoY
- ▲ 2.78%
- F500 in state
- 22
Industry mix (Fortune 500 HQ in TN)
| Industry | F500 HQs | Revenue |
|---|---|---|
| Healthcare | 3 | $91B |
|
||
| Retail | 3 | $72B |
|
||
| Transportation / Logistics | 1 | $88B |
|
||
| Paper / Packaging | 1 | $19B |
|
||
| Insurance | 1 | $13B |
|
||
| Energy | 1 | $12B |
|
||
Price history
+345.4% since first listed3 events — show timeline
- 2026-04-20 Price Changed $189,900 CWTAR
- 2026-03-25 Listed $205,000 CWTAR
- 2001-02-14 Sold (Public Records) $42,635 Public Records
Property tax history
+5.4%/yrLatest (2025): $1,375 · +16.9% YoY. Source: county tax records.
Cash-flow waterfall
monthlySold comps — $/sqft
last 12 mo · ≤1 miLoading sold comps…