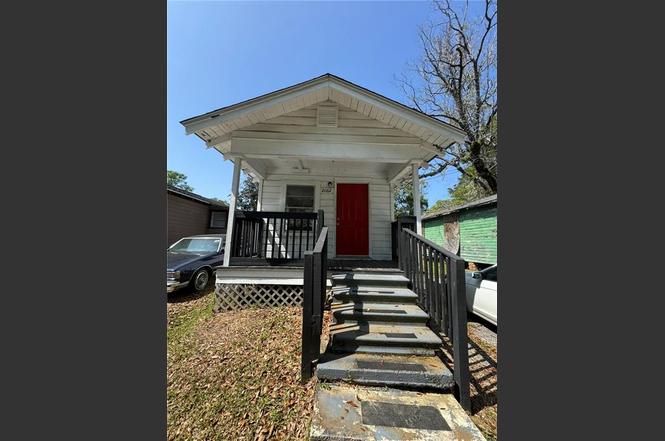
2064 Andrews St · Mobile, AL
Flood risk 1/10 · Minimal
- FEMA flood zone
- X (unshaded)
- Chance of flooding over 30 yrs
- 0.0%
- Est. flood insurance / yr
- $507 – $1,088
Fire risk 1/10 · Minimal
- Est. fire insurance / yr
- $916 – $1,700
Heat risk 9/10 · Severe
- Hot days now (above 104°F)
- 7 days/yr
- Hot days in 30 yrs
- 21 days/yr
Wind risk 9/10 · Severe
- Chance of severe wind over 30 yrs
- 99.0%
Air-quality risk 2/10 · Minimal
- Unhealthy air days now
- 1 days/yr
- Unhealthy air days in 30 yrs
- 1 days/yr
Risk factors via First Street. Map © Google.
Why this score? — see what drove the F grade
The composite is a weighted blend of 9 inputs, each scored 0–100. Each bar is that input's sub-score; the figure is the points it added to the 100-point composite (weight × sub-score).
- ARV discount +7.5/15.0
- Appreciation +7.4/10.0
- Livability +3.8/5.0
- Cash flow +3.0/30.0
- Rent growth +2.5/5.0
- Condition / age +2.5/5.0
- Schools +2.3/10.0
- 1% rule +0.0/10.0
- DSCR +0.0/10.0
$220,000
🖨 Deal sheet 📄 Offer letter ✓ Due diligence
Listing remarks
Investor opportunity — package sale of four income-producing units at 2050, 2052, 2062, and 2064 Andrews St, Mobile, AL 36617. Each unit is a one-bedroom, one-bathroom residence, offering a consistent and manageable footprint ideal for long-term rental operations. All four units are currently occupied, providing immediate cash flow from day one with no lease-up period required.
Key facts
- 4,791 sq ft lot
- Parking
- Built 1990
Property features AI
Finance
- Other: Four total units (multi-unit residential); Address: 2064 Andrews St, Mobile AL 36617
- Financial info: No financial details provided for investors or income/expenses
- HOA & community: No HOA information provided
Exterior
- Parking: Driveway parking for 1 vehicle
- Security: No security features listed
- Utilities: Cable available; Electricity available; Public sewer; Water available
- Home design: Residential income property; Subdivision: Carver; Built in 1990; Shingle roof; Vinyl siding
- Construction: Vinyl siding construction; Shingle roof; Built in 1990; No window features listed
- Exterior features: No fencing; Property has a view
Interior
- Kitchen: No kitchen appliance details provided
- Bedrooms: Not specified
- Flooring: Not specified
- Bathrooms: Not specified
- Heating & cooling: Heating: Other; Cooling: Ceiling fan(s) and window unit(s)
- Interior features: Ceiling fans; Window units for cooling; No special accessibility features listed
- Laundry & utility: No laundry appliances specified
Neighborhood map
What this means for you Summary
Snapshot
- This is a 1-bed/1.0-bath single-family listed at $220k.
Deal economics
- At list price, monthly cash flow is $-715 ($-9k/yr) — negative.
- To cash-flow at today's rent, offer at most $117k (47.0% below list).
- To meet the 1% rule (rent ≥ 1% of price), the offer needs to be $102k (53.6% below list).
- Recommended offer: $102k (53.6% below list) — sets the bar for 1% rule.
- Cap rate 2.4% vs local median 4.9% in Mobile — below-typical yield; the buyer is paying a premium for something (appreciation thesis, condition, location) that the cap rate doesn't capture.
Location & tenants
- Location reads 75/100 on livability (#20 in AL, #4,262 nationally) — a middle-class / working-renter tenant base. Strengths: commute A+, cost of living A+, housing A+; Watch: crime F, employment D-.
- Mobile County (urban): math 15% / reading 39% proficiency, ranked #81 of 129 in AL (top 63%) — low school quality limits family demand, transient renter base, plan for 1-2y turnover; 67% free/reduced lunch — lower-income household profile, screen leases tightly.
- Zoned schools: Holloway Elementary (math 5% / reading 19%, grade F, #554 of 627 statewide, top 88%, 498 students, 98% FRL); John L Leflore Magnet School (math 2% / reading 2%, grade F, #291 of 305 statewide, top 100%, 618 students, 84% FRL) — zoned schools average 91% FRL vs 67% district-wide (23 pts higher); higher-poverty schools than district average — tighter screening recommended.
- Zoned-school proficiency averages 7% at this address vs 27% district-wide (-20 pts) — the specific schools serving this property underperform the Mobile County average; the district grade overstates school quality for this exact location.
- Market conditions: 40 active listings in the ZIP; 1,678 units permitted in Mobile County in 2024 (264 in 5+ unit buildings).
Forward outlook
- In year one you build about $12k of equity ($2k loan paydown + $11k appreciation (4.8% local appreciation)).
- Mobile County population projected to shrink 8% by 2050 — rents likely to lag national; underwrite the cash flow, not the appreciation.
- By year 4, paydown + projected appreciation supports a ~$41k cash-out refi (75% LTV) — recoverable capital for the next deal without selling this one.
Negotiation context
- Only 2 days on market — expect competitive offers; lowballing is unlikely to land.
- Current owner paid $42k; list at $220k implies a 419% gain — meaningful room to come down on a strong offer.
Risks & watch-outs
- Climate carrying-cost: severe wind risk, 99% chance of damaging wind over 30y; extreme-heat days projected 7→21/yr by 2055 (HVAC capex compounding) — expect insurance premiums to compound above CPI over the hold.
Questions for the listing agent
- What do current leases actually rent for vs. the listed asking? Can we see a recent rent roll and the last 12 months of T-12 income?
- Is there a deadline driving the sale (1031 exchange, divorce, estate, relocation)? That informs how much negotiation room exists.
- Schools are D-rated, which usually means shorter tenancies and higher turnover. Who's the typical renter profile here, and what's been the actual vacancy rate?
- Crime grade is F in this area — have there been break-ins, vandalism, or insurance claims at this property in the last 3 years? What carrier currently insures it and at what premium?
- The area grade is low — what's the realistic commute time and amenity access for the typical tenant pool here? Any planned neighborhood developments (good or bad) we should know about?
- What's the average days-on-market for RENTAL listings here right now (not sales)? A rising rental-DOM trend means longer vacancies and softer asking-rent achievability than the comps imply.
- What's the recent tenant-quality profile in this submarket — average credit score on applications, eviction rate, late-payment / NSF rate, and stable-employment percentage? A property-management company in the area should have these aggregated.
- How much new for-sale + rental construction is in the pipeline within 1–3 miles? Heavy new supply typically softens prices + rents 12–24 months out; constrained supply supports both.
Investment metrics
- 1% rule
- 0.46% ✗
- Cap rate
- 2.39%
- Cash-on-cash
- -13.92%
- DSCR
- 0.38
- GRM
- 18.0
CMA / ARV
No comps found within radius.
Projected returns pro-forma
4.78% appreciation · 3.0% rent growth · sell at horizon
- IRR
- 0.6%
- Equity multiple
- 1.04×
- Total profit
- $2,404
- Equity at exit
- $121,701
- IRR
- 4.2%
- Equity multiple
- 1.78×
- Total profit
- $48,052
- Equity at exit
- $207,623
Cash invested: $61,600 (down + closing). Projections, not guarantees.
Landlord ↔ Tenant lean methodology
- Overall (STATE)
- 90 Strongly Landlord-Friendly
- State Alabama
- 90 Strongly Landlord-Friendly · R+15
- County
- — inherits STATE
- City
- — inherits STATE
ZIP-level market 36617
- Home prices YoY
- 3.9%
- Active inventory
- 40
- Price-to-rent
- 18.0×
Monthly cashflow live
- Estimated rent
- $1,020 medium interval (Pro) →
- Mortgage (P&I)
- −$1,154
- Tax est. 1.5%
- −$275 /mo · $3,300/yr
- Insurance
- −$92
- HOA
- −$0
- Vacancy / Maint / Mgmt
- −$214
- Net cashflow
- $-715
Break-even live
UW: 25.0% down · 7.5% · 30yr · 1.5% tax · 5.0% vac · 8.0% maint · 8.0% mgmt
Financing live
Cash to close
- Down payment
- $55,000
- Closing costs
- $6,600
- Reserves months
- —
- Total cash needed
- —
Loan-product check · same deal, 3 products live
Conventional
25% down · 7.5% · 30yr
- Down + closing
- —
- Monthly P&I
- —
- Monthly cashflow
- —
- DSCR
- —
- Eligible?
- —
Personal DTI + credit; lowest rate.
DSCR
20% down · 8.5% · 30yr
- Down + closing
- —
- Monthly P&I
- —
- Monthly cashflow
- —
- DSCR
- —
- Eligible?
- —
No personal income docs; deal must DSCR.
Hard money
10% down · 12.0% · 12mo
- Down + closing
- —
- Monthly P&I
- —
- Monthly cashflow
- —
- DSCR
- —
- Eligible?
- —
Short-term bridge; refi at stabilization.
Listing history 3 events
-
2026-06-18days on market $220,000 Active 2 DOM
-
2026-06-16remarks 380-char remark
-
2026-06-16$220,000 Active 1 DOM
ⓘ Source: listings_history table (triggers on properties + properties_extension) + one-shot
backfill from property_details.listing_events for pre-trigger history.
Climate risk First Street
- Flood 1/10 Low FEMA zone X (unshaded) · 0% chance over 30 yrs
- Wildfire 1/10 Low
- Heat 9/10 Extreme 7 d/yr ≥104°F today · 21 d/yr by 30 yrs out
- Wind 9/10 Extreme 99% chance of damaging wind over 30 yrs
- Air quality 2/10 Low 1 unhealthy d/yr today · 1 by 30 yrs out
Nearby sold comps map
Loading sold comps map…
Walkable amenities ~0.75 mi
Loading nearby amenities…
Taxation est. · year 1
- Rental income
- $12,236
- − Mortgage interest
- −$12,323
- − Property taxes
- −$3,300
- − Insurance
- −$1,100
- − Repairs & maintenance
- −$979
- − Management
- −$979
- − Depreciation
- −$6,400
- Taxable loss
- −$12,845
- Est. tax savings @ 24.0%
- +$3,083
- After-tax cash flow
- $-5,495/yr
For passive investors: Depreciation is non-cash, so a rental often shows a tax loss while cash-flowing — sheltering income. Rental losses are passive: they offset passive income freely, and up to $25,000/yr can offset ordinary (W-2) income if you actively participate and your MAGI is under $100k (phasing out to $0 by $150k); unused losses carry forward. On sale, claimed depreciation is recaptured at up to 25%, and gains may owe capital-gains tax (a 1031 exchange can defer both). Figures are a year-1 estimate at your 24.0% rate — not tax advice; consult a CPA.
Schools (NCES district)
- District
- Mobile County
- NCES district ID
- 0102370
- Math proficiency
- 15% ▼ -28.00%
- Reading proficiency
- 39% ▬ 0.00%
- Median HH income
- $42,455
- Composite
- 22.9/100
- National rank
- #8002
- State rank
- #81 of 129 in AL
Livability — Mobile
- Score
- 75/100
- State rank
- #20
- US rank
- #4262
Category grades
Schools grade is shown separately in the Schools card above.
Census & demographics
- Census place
- Mobile, AL
- City population
- 205,729
- Population (ZIP)
- 11,952
Population outlook (Mobile County) Hauer SSP2
- Today (2025)
- 415,303 people
- By 2030
- 411,755 · -0.9%
- By 2040
- 399,670 · -3.8%
- By 2050
- 382,616 · -7.9%
- By 2075
- 337,353 · -18.8%
- By 2100
- 283,391 · -31.8%
Race, ethnicity, and origin ACS 2023
- Neighborhood character
- Predominantly Black (97%)
- Race & ethnicity
- Black 97% White 2%
- Foreign-born
- 0%
Political lean MEDSL · Mobile
- 2024 margin
- R (+16.4) · D 41.3% · R 57.7%
- 2008→2024 swing
- -7.7pp toward R · 2008: -8.7pp · 2024: -16.4pp
- All cycles
- 2024: R+16.4 2020: R+11.9 2016: R+13.9 2012: R+9.3 2008: R+8.7
Not yet ingested
- Civics
- —
Market trends
- HPI YoY
- ▲ 4.78%
- Current HPI
- 128.8377
- Rent YoY
- —
- Metro
- —
- State GDP YoY
- ▲ 2.94%
- F500 in state
- 4
Industry mix (Fortune 500 HQ in AL)
| Industry | F500 HQs | Revenue |
|---|---|---|
| Financial Services | 1 | $8B |
|
||
| Healthcare | 1 | $5B |
|
||
Price history
+418.9% since first listed2 events — show timeline
- 2026-06-16 Listed $220,000 GCMLS AL
- 2020-06-02 Sold (Public Records) $42,400 Public Records
Property tax history
+8.5%/yrLatest (2025): $295 · +0.0% YoY. Source: county tax records.
Cash-flow waterfall
monthlySold comps — $/sqft
last 12 mo · ≤1 miLoading sold comps…