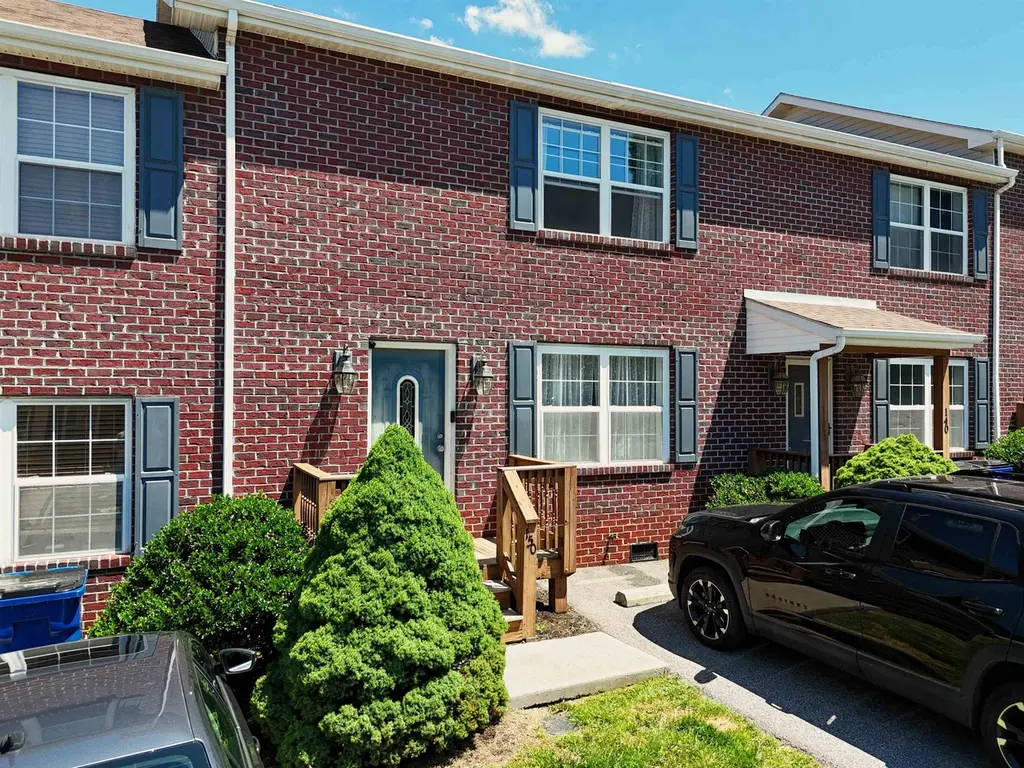
150 Hunters Ridge Ln NW · Christiansburg, VA
Flood risk 1/10 · Minimal
- FEMA flood zone
- X (unshaded)
- Chance of flooding over 30 yrs
- 0.0%
- Est. flood insurance / yr
- $507 – $1,088
Fire risk 4/10 · Minor
- Est. fire insurance / yr
- $666 – $1,236
Heat risk 4/10 · Minor
- Hot days now (above 95°F)
- 7 days/yr
- Hot days in 30 yrs
- 20 days/yr
Wind risk 2/10 · Minimal
- Chance of severe wind over 30 yrs
- 1.0%
Air-quality risk 1/10 · Minimal
- Unhealthy air days now
- 0 days/yr
- Unhealthy air days in 30 yrs
- 0 days/yr
Risk factors via First Street. Map © Google.
Why this score? — see what drove the D grade
The composite is a weighted blend of 9 inputs, each scored 0–100. Each bar is that input's sub-score; the figure is the points it added to the 100-point composite (weight × sub-score).
- ARV discount +13.3/15.0
- Cash flow +10.8/30.0
- Schools +5.4/10.0
- Livability +4.0/5.0
- DSCR +3.1/10.0
- 1% rule +2.9/10.0
- Rent growth +2.8/5.0
- Condition / age +2.5/5.0
- Appreciation +0.0/10.0
$229,900
🖨 Deal sheet 📄 Offer letter ✓ Due diligence
Listing remarks MLS
Well maintained two-story brick townhome located within walking distance of the Huckleberry Trail and Christiansburg Recreation Center. This cozy two bedroom 1.5 bath has plenty of character and is in an excellent location. Offering a natural gas fireplace in the living room, washer and dryer on the main level, and a private walk-out back porch, this property is a must see! Two large bedrooms upstairs provide plenty of closet space and a full bath connected to the master. A short walk off of the back porch and you'll be on the Huckleberry Trail, connecting Christiansburg to Blacksburg on the paved biking and walking trail!
Key facts
- Recently updated
- Ample closet space
- Brick townhouse
Tags
Property features AI
Finance
- HOA & community: Homeowners association with an annual fee of $1,440 (equivalent to $120/month)
Exterior
- Parking: Asphalt parking
- Utilities: Public water; Public sewer
- Home design: Residential townhouse; One story (above-grade finished area noted)
- Construction: Brick construction; Shingle roof; Crawl space foundation; Built area above grade recorded (1,300)
- Exterior features: Deck; Cul-de-sac lot
Interior
- Kitchen: Dishwasher; Microwave; Electric range; Refrigerator
- Bedrooms: Total rooms: 5
- Flooring: Carpet; Vinyl
- Bathrooms: 1 full bathroom; 1 half bathroom
- Heating & cooling: Heat pump (heating present)
- Interior features: Walk-in closet(s); Gas log fireplace in the living room
- Laundry & utility: Washer; Dryer; Electric water heater
Neighborhood map
What this means for you Summary
Snapshot
- This is a 2-bed/2.0-bath townhouse listed at $230k.
Deal economics
- At list price, monthly cash flow is $-105 ($-1k/yr) — negative.
- To cash-flow at today's rent, offer at most $211k (8.0% below list).
- To meet the 1% rule (rent ≥ 1% of price), the offer needs to be $183k (20.5% below list).
- Recommended offer: $183k (20.5% below list) — sets the bar for 1% rule.
- Cap rate 5.7% vs local median 3.8% in Christiansburg — top-decile yield for the area; either an underpriced asset or a hidden risk that comps aren't pricing in. Stress-test before assuming the spread holds.
Location & tenants
- Location reads 81/100 on livability (#53 in VA, #1,452 nationally) — a professional / high-income tenant draw. Strengths: cost of living A+, housing A+, commute A-; Watch: amenities F.
- Montgomery County Public School District (urban): math 57% / reading 70% proficiency, ranked #47 of 131 in VA (top 36%) — acceptable for families but not a draw, mixed tenant base, ~2y average lease.
- Zoned schools: Christiansburg Primary (405 students, 49% FRL); Christiansburg Middle (math 38% / reading 63%, grade C, #226 of 342 statewide, top 67%, 752 students, 44% FRL); Christiansburg High (math 79% / reading 77%, grade A-, #80 of 319 statewide, top 25%, 1,116 students, 41% FRL).
- Market conditions: Rents rising (+1.1%/yr); 248 active listings in the ZIP; 8 comparable units currently listed for rent nearby; rentals lingering (median 44d on market — plan ~5-8 weeks vacancy on turnover, expect pricing pressure); 100% of comp listings sitting > 30 days — soft ceiling on asking rent; solid renter incomes; 323 units permitted in Montgomery County in 2024 (0 in 5+ unit buildings).
Forward outlook
- Local home prices are declining (-3.0%/yr); year-one equity from $2k of loan paydown is wiped out by about $7k of value loss. Plan a longer hold.
- Montgomery County population projected at +13% by 2050 — modest demand growth; plan on rents tracking national, not racing it.
Negotiation context
- Only 6 days on market — expect competitive offers; lowballing is unlikely to land.
- 3 sale attempts since 7y ago with the ask held roughly flat each time — persistent listings suggest the price (not the market) is what's stuck; bring a comps-based counter.
- Current owner paid $175k; 31% above their basis — modest negotiation headroom, anchor on the comps not their cost.
Questions for the listing agent
- What do current leases actually rent for vs. the listed asking? Can we see a recent rent roll and the last 12 months of T-12 income?
- What does the HOA fee cover, when was the last increase, and are there any pending special assessments or reserve-fund shortfalls?
- Is there a deadline driving the sale (1031 exchange, divorce, estate, relocation)? That informs how much negotiation room exists.
- Schools are A-rated — typically a magnet for longer-tenancy family renters. What's the average tenant stay here, and is there a school-zone premium baked into asking?
- The area grade is low — what's the realistic commute time and amenity access for the typical tenant pool here? Any planned neighborhood developments (good or bad) we should know about?
- What's the average days-on-market for RENTAL listings here right now (not sales)? A rising rental-DOM trend means longer vacancies and softer asking-rent achievability than the comps imply.
- What's the recent tenant-quality profile in this submarket — average credit score on applications, eviction rate, late-payment / NSF rate, and stable-employment percentage? A property-management company in the area should have these aggregated.
- How much new for-sale + rental construction is in the pipeline within 1–3 miles? Heavy new supply typically softens prices + rents 12–24 months out; constrained supply supports both.
Investment metrics
- 1% rule
- 0.79% ✗
- Cap rate
- 5.75%
- Cash-on-cash
- -1.95%
- DSCR
- 0.91
- GRM
- 10.5
CMA / ARV
- ARV (on-the-fly)
- $263,900
- Comps found
- 12
Show comp detail 12 sales within ~0.75 mi
| Address | Dist | Beds/Ba | Sqft | Sold | Price | $/sf | Match |
|---|---|---|---|---|---|---|---|
| 1270 Orange Leaf Ct | 0.11mi | 2/2.5 | 1,224 (-6%) | 2mo | $265,000 | $217 | 82 |
| 1290 Orange Leaf Ct | 0.11mi | 2/2.5 | 1,224 (-6%) | 2mo | $205,000 | $167 | 81 |
| 120 Blue Leaf Dr | 0.26mi | 2/2.5 | 1,296 (-0%) | 7mo | $253,000 | $195 | 79 |
| 1687 York Dr | 0.06mi | 3/2.5 (+1) | 1,242 (-4%) | 5mo | $200,000 | $161 | 78 |
| 145 Blue Leaf Dr | 0.29mi | 2/2.5 | 1,244 (-4%) | 1mo | $288,500 | $232 | 76 |
| 1655 York Dr | 0.04mi | 3/2.5 (+1) | 1,206 (-7%) | 4mo | $231,000 | $192 | 76 |
| 825 Oaktree Blvd | 0.30mi | 2/2.5 | 1,230 (-5%) | 3mo | $252,000 | $205 | 73 |
| 160 Willow Oak Dr NW | 0.23mi | 2/3.5 | 1,224 (-6%) | 2mo | $266,000 | $217 | 72 |
| 565 Oaktree Blvd | 0.38mi | 2/2.5 | 1,230 (-5%) | 2mo | $255,000 | $207 | 70 |
| 585 Silver Leaf Dr | 0.36mi | 3/2.5 (+1) | 1,344 (+3%) | 2mo | $259,900 | $193 | 68 |
| 235 Silver Leaf Dr NW | 0.44mi | 2/2.0 | 1,242 (-4%) | 7mo | $252,000 | $203 | 66 |
| 255 Gold Leaf Dr | 0.39mi | 2/2.0 | 1,167 (-10%) | 8mo | $227,000 | $195 | 58 |
Match score weights: distance 35% · size 25% · config 20% · recency 20%. Top-matched comps best support the ARV.
Projected returns pro-forma
-3.0% appreciation · 1.05% rent growth · sell at horizon
- IRR
- -21.7%
- Equity multiple
- 0.26×
- Total profit
- $-47,429
- Equity at exit
- $34,279
- IRR
- -20.7%
- Equity multiple
- 0.01×
- Total profit
- $-63,744
- Equity at exit
- $19,878
Cash invested: $64,372 (down + closing). Projections, not guarantees.
Landlord ↔ Tenant lean methodology
- Overall (STATE)
- 55 Moderately Landlord-Leaning
- State Virginia
- 55 Moderately Landlord-Leaning · D+2
- County
- — inherits STATE
- City
- — inherits STATE
ZIP-level market 24073
- Home prices YoY
- -26.2%
- Rents YoY
- 1.1%
- Active inventory
- 248
- Price-to-rent
- 10.5×
Monthly cashflow live
- Estimated rent
- $1,827 high interval (Pro) →
- Mortgage (P&I)
- −$1,206
- Tax from tax record
- −$116 /mo · $1,397/yr
- Insurance
- −$96
- HOA
- −$130
- Vacancy / Maint / Mgmt
- −$384
- Net cashflow
- $-105
Break-even live
UW: 25.0% down · 7.5% · 30yr · 1.5% tax · 5.0% vac · 8.0% maint · 8.0% mgmt
Financing live
Cash to close
- Down payment
- $57,475
- Closing costs
- $6,897
- Reserves months
- —
- Total cash needed
- —
Loan-product check · same deal, 3 products live
Conventional
25% down · 7.5% · 30yr
- Down + closing
- —
- Monthly P&I
- —
- Monthly cashflow
- —
- DSCR
- —
- Eligible?
- —
Personal DTI + credit; lowest rate.
DSCR
20% down · 8.5% · 30yr
- Down + closing
- —
- Monthly P&I
- —
- Monthly cashflow
- —
- DSCR
- —
- Eligible?
- —
No personal income docs; deal must DSCR.
Hard money
10% down · 12.0% · 12mo
- Down + closing
- —
- Monthly P&I
- —
- Monthly cashflow
- —
- DSCR
- —
- Eligible?
- —
Short-term bridge; refi at stabilization.
Rent comps 8 comps
| Address | Beds | Baths | Sqft | Rent | $/sqft | DOM | Units | Dist |
|---|---|---|---|---|---|---|---|---|
| 120 Amber Cir NW Christiansburg, VA | 3.0 | 3.5 | 1854 | $1,850 | $1.00 | 43d | 1 | 0.16mi |
| 700 Oaktree Blvd Christiansburg, VA | 3.0 | 2.0 | 1576 | $1,850 | $1.17 | 43d | 1 | 0.36mi |
| 2156 Yellow Sulphur Rd Christiansburg, VA | 3.0 | 1.0 | 1064 | $1,600 | $1.50 | 43d | 1 | 1.14mi |
| 200 Meadow Dr Christiansburg, VA | 3.0 | 2.5 | 1752 | $2,100 | $1.20 | 43d | 1 | 1.44mi |
| 215 Lunaria Ln NW Christiansburg, VA | 2.0 | 2.5 | 1276 | $1,699 | $1.33 | 43d | 1 | 1.45mi |
| 265 Lunaria Ln NW Christiansburg, VA | 3.0 | 2.5 | 1276 | $1,799 | $1.41 | 43d | 1 | 1.46mi |
| 260 Lunaria Ln NW Christiansburg, VA | 3.0 | 2.5 | 1276 | $1,799 | $1.41 | 43d | 1 | 1.48mi |
| 270 Lunaria Ln NW Christiansburg, VA | 2.0 | 2.0 | 1276 | $1,699 | $1.33 | 43d | 1 | 1.48mi |
HOA detail
- Monthly dues
- $130 · $1,560/yr
- Likely covers
- gas
Listing history 6 events
-
2026-06-14statusdays on market $229,900 Pending 6 DOM
-
2026-06-13days on market $229,900 Active 5 DOM
-
2026-06-10days on market $229,900 Active 3 DOM
-
2026-06-09days on market $229,900 Active 2 DOM
-
2026-06-08remarks 695-char remark
-
2026-06-08$229,900 Active 1 DOM
ⓘ Source: listings_history table (triggers on properties + properties_extension) + one-shot
backfill from property_details.listing_events for pre-trigger history.
Tax reassessment forecast VA · Resets to sale price
- Current annual tax
- $1,397 · $116/mo
- Projected year-2 tax
- $1,885 · $157/mo
- Expected delta
- +$488/yr (+$41/mo · 35.0%)
ⓘ Screening estimate from a state-policy table — verify with the county assessor before closing.
Climate risk First Street
- Flood 1/10 Low FEMA zone X (unshaded) · 0% chance over 30 yrs
- Wildfire 4/10 Moderate
- Heat 4/10 Moderate 7 d/yr ≥95°F today · 20 d/yr by 30 yrs out
- Wind 2/10 Low 100% chance of damaging wind over 30 yrs
- Air quality 1/10 Low 0 unhealthy d/yr today · 0 by 30 yrs out
Nearby sold comps map
Loading sold comps map…
Walkable amenities ~0.75 mi
Loading nearby amenities…
Taxation est. · year 1
- Rental income
- $21,922
- − Mortgage interest
- −$12,878
- − Property taxes
- −$1,397
- − Insurance
- −$1,150
- − Repairs & maintenance
- −$1,754
- − Management
- −$1,754
- − HOA
- −$1,560
- − Depreciation
- −$6,688
- Taxable loss
- −$5,258
- Est. tax savings @ 24.0%
- +$1,262
- After-tax cash flow
- $7/yr
For passive investors: Depreciation is non-cash, so a rental often shows a tax loss while cash-flowing — sheltering income. Rental losses are passive: they offset passive income freely, and up to $25,000/yr can offset ordinary (W-2) income if you actively participate and your MAGI is under $100k (phasing out to $0 by $150k); unused losses carry forward. On sale, claimed depreciation is recaptured at up to 25%, and gains may owe capital-gains tax (a 1031 exchange can defer both). Figures are a year-1 estimate at your 24.0% rate — not tax advice; consult a CPA.
Schools (NCES district)
- District
- Montgomery County Public School District
- NCES district ID
- 5102520
- Math proficiency
- 57% ▼ -29.00%
- Reading proficiency
- 70% ▼ -11.00%
- Median HH income
- $46,618
- Composite
- 53.6/100
- National rank
- #1440
- State rank
- #47 of 131 in VA
Livability — Christiansburg
- Score
- 81/100
- State rank
- #53
- US rank
- #1452
Category grades
Schools grade is shown separately in the Schools card above.
Census & demographics
- Census place
- Christiansburg, VA
- County
- Montgomery County · 78,218 people
- City population
- 29,677
- Metro
- Blacksburg-Christiansburg, VA
- Population (ZIP)
- 29,677
- Household income
- $76,800
- Rent vs Own
- Severe rent burden
- 861.0
Population outlook (Montgomery County) Hauer SSP2
- Today (2025)
- 105,748 people
- By 2030
- 110,301 · +4.3%
- By 2040
- 115,652 · +9.4%
- By 2050
- 119,651 · +13.1%
- By 2075
- 126,005 · +19.2%
- By 2100
- 129,771 · +22.7%
Race, ethnicity, and origin ACS 2023
- Neighborhood character
- Predominantly White (86%)
- Race & ethnicity
- White 86% Two or more races 5% Black 4% Hispanic / Latino 4% Asian 3%
- Common ancestry
- Italian 3% Slovak 3% Serbian 2%
- Foreign-born
- 5% · Canada, South Korea, Jamaica
- Languages at home
- 94% English-only · Spanish 3% Other Indo-European 2% Korean 1%
Political lean MEDSL · Montgomery
- 2024 margin
- Toss-up / Even · D 50.9% · R 47.4% · Other 1.7%
- 2008→2024 swing
- -1.4pp toward R · 2008: 4.9pp · 2024: 3.5pp
- All cycles
- 2024: D+3.5 2020: D+5.8 2016: D+1.3 2012: R+0.2 2008: D+4.9
Not yet ingested
- Civics
- —
Market trends
- HPI YoY
- ▼ -94.98%
- Current HPI
- 267.2504
- Rent YoY
- ▲ 1.05%
- Metro
- Blacksburg-Christiansburg, VA
- State GDP YoY
- ▲ 2.40%
- F500 in state
- 50
Industry mix (Fortune 500 HQ in VA)
| Industry | F500 HQs | Revenue |
|---|---|---|
| Aerospace / Defense | 4 | $236B |
|
||
| Technology / Defense | 3 | $32B |
|
||
| Financial Services | 2 | $176B |
|
||
| Utilities | 2 | $27B |
|
||
| Insurance | 2 | $25B |
|
||
| Technology | 2 | $15B |
|
||
Price history
+109.0% since first listed10 events — show timeline
- 2026-06-08 Listed $229,900 NRVMLS
- 2022-01-24 Sold (Public Records) $175,000 Public Records
- 2022-01-24 Sold (MLS) $175,000 NRVMLS
- 2021-12-19 Listed $166,000 NRVMLS
- 2019-07-11 Sold (Public Records) $143,000 Public Records
- 2019-07-10 Sold (MLS) $143,000 NRVMLS
- 2019-05-27 Listed $138,000 NRVMLS
- 2006-06-08 Sold (Public Records) $124,000 Public Records
- 2004-04-16 Sold (Public Records) $110,000 Public Records
- 2004-04-16 Sold (Public Records) $110,000 Public Records
Property tax history
+2.5%/yrLatest (2025): $1,397 · +1.3% YoY. Source: county tax records.
Cash-flow waterfall
monthlySold comps — $/sqft
last 12 mo · ≤1 miLoading sold comps…