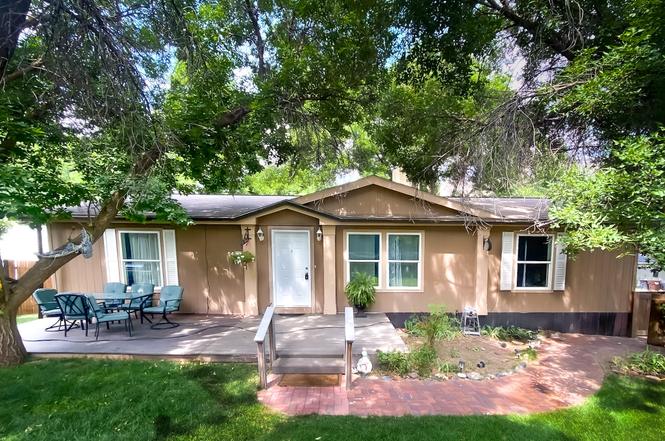
5033 County road 335 #112 · New Castle, CO
Flood risk 3/10 · Minor
- FEMA flood zone
- X
- Chance of flooding over 30 yrs
- 0.12%
- Est. flood insurance / yr
- $507 – $1,088
Fire risk 6/10 · Moderate
- Est. fire insurance / yr
- $939 – $1,743
Heat risk 3/10 · Minor
- Hot days now (above 89°F)
- 7 days/yr
- Hot days in 30 yrs
- 20 days/yr
Wind risk 1/10 · Minimal
- Chance of severe wind over 30 yrs
- —
Air-quality risk 1/10 · Minimal
- Unhealthy air days now
- 0 days/yr
- Unhealthy air days in 30 yrs
- 0 days/yr
Risk factors via First Street. Map © Google.
Why this score? — see what drove the D- grade
The composite is a weighted blend of 9 inputs, each scored 0–100. Each bar is that input's sub-score; the figure is the points it added to the 100-point composite (weight × sub-score).
- Cash flow +15.3/30.0
- DSCR +4.7/10.0
- ARV discount +3.6/15.0
- Livability +3.5/5.0
- 1% rule +3.1/10.0
- Rent growth +2.5/5.0
- Condition / age +2.5/5.0
- Schools +2.4/10.0
- Appreciation +0.0/10.0
$199,000
🖨 Deal sheet (PDF) 📄 Offer letter ✓ Due diligence
Listing remarks
Seeking an affordable and comfortable home in New Castle? This 3-bedroom, 2-bathroom mobile home, built in 2007 and recently painted is the perfect solution. Enjoy the outdoor deck and a practical layout designed for everyday living. Located in the Apple Tree community, you'll find a friendly atmosphere and convenient access to I-70 and local amenities. This listing is for the mobile home only, with a lot lease. Embrace the ease of mobile home living without sacrificing comfort or location. Inquire today!
Key facts
- Outdoor deck
- Built 2007
- Listed 363 days
Tags
Neighborhood map
What this means for you Summary
Snapshot
- This is a 3-bed/2.0-bath manufactured listed at $199k.
Deal economics
- At list price, monthly cash flow is $73 ($878/yr) — positive.
- The deal already cash-flows at list — no discount required.
- To meet the 1% rule (rent ≥ 1% of price), the offer needs to be $161k (19.0% below list).
- Recommended offer: $161k (19.0% below list) — sets the bar for 1% rule.
- Cap rate 6.7% vs local median 0.9% in New Castle — top-decile yield for the area; either an underpriced asset or a hidden risk that comps aren't pricing in. Stress-test before assuming the spread holds.
Location & tenants
- Location reads 70/100 on livability (#87 in CO) — a middle-class / working-renter tenant base. Strengths: crime A+, employment A+, housing A+; Watch: amenities F, cost of living F, health & safety F.
- Garfield School District No. Re-2 (town): math 16% / reading 36% proficiency, ranked #61 of 86 in CO (top 71%) — low school quality limits family demand, transient renter base, plan for 1-2y turnover.
- Zoned schools: Kathryn Senor Elementary School (math 5% / reading 37%, grade F, #673 of 966 statewide, top 71%, 273 students, 34% FRL); Riverside School (math 17% / reading 42%, grade F, #129 of 270 statewide, top 51%, 468 students, 37% FRL); Coal Ridge High School (math 27% / reading 57%, grade F, #155 of 381 statewide, top 42%, 527 students, 32% FRL) — zoned schools at 34% FRL track the district average.
- Market conditions: 106 active listings in the ZIP; 171 units permitted in Garfield County in 2024 (64 in 5+ unit buildings).
Forward outlook
- Local home prices are declining (-3.0%/yr); year-one equity from $1k of loan paydown is wiped out by about $6k of value loss. Plan a longer hold.
- Garfield County population projected at +5% by 2050 — modest demand growth; plan on rents tracking national, not racing it.
Negotiation context
- It's been on market 363 days — a 12% lower offer ($175k) is reasonable based on typical stale-listing flexibility.
- 3 sale attempts; this cycle's ask has dropped $30k (13%) from the opening price — seller is motivated, your offer sets the floor, not the list.
Risks & watch-outs
- Climate carrying-cost: major wildfire risk — expect insurance premiums to compound above CPI over the hold.
Questions for the listing agent
- It's been on market 363 days. Have you received any prior offers? Is the seller open to a 19% concession, seller financing, or rate buy-down credit?
- Why hasn't it sold? Are there any deal-killer items the seller is aware of (foundation, flood, title, zoning, code violations)?
- Is there a deadline driving the sale (1031 exchange, divorce, estate, relocation)? That informs how much negotiation room exists.
- Schools are D-rated, which usually means shorter tenancies and higher turnover. Who's the typical renter profile here, and what's been the actual vacancy rate?
- The area grade is low — what's the realistic commute time and amenity access for the typical tenant pool here? Any planned neighborhood developments (good or bad) we should know about?
- What's the average days-on-market for RENTAL listings here right now (not sales)? A rising rental-DOM trend means longer vacancies and softer asking-rent achievability than the comps imply.
- What's the recent tenant-quality profile in this submarket — average credit score on applications, eviction rate, late-payment / NSF rate, and stable-employment percentage? A property-management company in the area should have these aggregated.
- How much new for-sale + rental construction is in the pipeline within 1–3 miles? Heavy new supply typically softens prices + rents 12–24 months out; constrained supply supports both.
Investment metrics
- 1% rule
- 0.81% ✗
- Cap rate
- 6.73%
- Cash-on-cash
- 1.58%
- DSCR
- 1.07
- GRM
- 10.3
CMA / ARV
- ARV (on-the-fly)
- $183,168
- Comps found
- 7
Show comp detail 7 sales within ~0.75 mi
| Address | Dist | Beds/Ba | Sqft | Sold | Price | $/sf | Match |
|---|---|---|---|---|---|---|---|
| 5033 County road 335 #112 | 0.00mi | 3/2.0 | 1,404 (-2%) | 1mo | $180,000 | $128 | 96 |
| 5033 County Road 335 #73 | 0.00mi | 3/2.0 | 1,404 (-2%) | 4mo | $180,000 | $128 | 93 |
| 5033 335 COUNTY Rd #153 | 0.00mi | 3/2.0 | 1,512 (+6%) | 16mo | $190,000 | $126 | 77 |
| 5033 County Road 335 #33 | 0.00mi | 3/2.0 | 1,344 (-6%) | 22mo | $155,000 | $115 | 72 |
| 5033 335 County Rd #189 | 0.00mi | 3/2.0 | 1,240 (-13%) | 9mo | $165,000 | $133 | 70 |
| 5033 Co Rd 335 #80 | 0.00mi | 3/2.0 | 1,560 (+9%) | 20mo | $195,000 | $125 | 68 |
| 5033 335 County Rd #134 | 0.00mi | 3/2.0 | 1,250 (-13%) | 15mo | $195,000 | $156 | 67 |
Match score weights: distance 35% · size 25% · config 20% · recency 20%. Top-matched comps best support the ARV.
Projected returns pro-forma
-3.0% appreciation · 3.0% rent growth · sell at horizon
- IRR
- -13.8%
- Equity multiple
- 0.50×
- Total profit
- $-27,668
- Equity at exit
- $29,672
- IRR
- -5.1%
- Equity multiple
- 0.67×
- Total profit
- $-18,427
- Equity at exit
- $17,206
Cash invested: $55,720 (down + closing). Projections, not guarantees.
Landlord ↔ Tenant lean methodology
- Overall (STATE)
- 38 Tenant-Leaning
- State Colorado
- 38 Tenant-Leaning · D+4
- County
- — inherits STATE
- City
- — inherits STATE
ZIP-level market 81647
- Home prices YoY
- -5.8%
- Active inventory
- 106
- Price-to-rent
- 10.3×
Monthly cashflow live
- Estimated rent
- $1,613 medium interval (Pro) →
- Mortgage (P&I)
- −$1,044
- Tax from tax record
- −$74 /mo · $891/yr
- Insurance
- −$83
- HOA
- −$0
- Vacancy / Maint / Mgmt
- −$339
- Net cashflow
- $73
Break-even live
Sensitivity live
| Price | -10% $186 | -5% $130 | +0% $73 | +5% $17 | +10% $-39 |
|---|---|---|---|---|---|
| Rent | -10% $-54 | -5% $9 | +0% $73 | +5% $137 | +10% $201 |
| Rate | -1.0pp $173 | -0.5pp $124 | base $73 | +0.5pp $22 | +1.0pp $-31 |
UW: 25.0% down · 7.5% · 30yr · 1.5% tax · 5.0% vac · 8.0% maint · 8.0% mgmt
Financing live
Cash to close
- Down payment
- $49,750
- Closing costs
- $5,970
- Reserves months
- —
- Total cash needed
- —
Loan-product check · same deal, 3 products live
Conventional
25% down · 7.5% · 30yr
- Down + closing
- —
- Monthly P&I
- —
- Monthly cashflow
- —
- DSCR
- —
- Eligible?
- —
Personal DTI + credit; lowest rate.
DSCR
20% down · 8.5% · 30yr
- Down + closing
- —
- Monthly P&I
- —
- Monthly cashflow
- —
- DSCR
- —
- Eligible?
- —
No personal income docs; deal must DSCR.
Hard money
10% down · 12.0% · 12mo
- Down + closing
- —
- Monthly P&I
- —
- Monthly cashflow
- —
- DSCR
- —
- Eligible?
- —
Short-term bridge; refi at stabilization.
Listing history 7 events
-
2026-04-25status Pending
-
2026-03-27status Active
-
2026-03-27price $199,000
-
2025-10-08status Active
-
2025-08-15price $214,000
-
2025-04-15price $219,000
-
2025-03-31$229,000 Active
ⓘ Source: listings_history table (triggers on properties + properties_extension) + one-shot
backfill from property_details.listing_events for pre-trigger history.
Tax reassessment forecast CO · Resets to sale price
- Current annual tax
- $891 · $74/mo
- Projected year-2 tax
- $1,094 · $91/mo
- Expected delta
- +$203/yr (+$17/mo · 22.8%)
ⓘ Screening estimate from a state-policy table — verify with the county assessor before closing.
Climate risk First Street
- Flood 3/10 Moderate FEMA zone X · 12% chance over 30 yrs
- Wildfire 6/10 Major
- Heat 3/10 Moderate 7 d/yr ≥89°F today · 20 d/yr by 30 yrs out
- Wind 1/10 Low
- Air quality 1/10 Low 0 unhealthy d/yr today · 0 by 30 yrs out
Nearby sold comps map
Loading sold comps map…
Walkable amenities ~0.75 mi
Loading nearby amenities…
Taxation est. · year 1
- Rental income
- $19,351
- − Mortgage interest
- −$11,147
- − Property taxes
- −$891
- − Insurance
- −$995
- − Repairs & maintenance
- −$1,548
- − Management
- −$1,548
- − Depreciation
- −$5,789
- Taxable loss
- −$2,567
- Est. tax savings @ 24.0%
- +$616
- After-tax cash flow
- $1,494/yr
For passive investors: Depreciation is non-cash, so a rental often shows a tax loss while cash-flowing — sheltering income. Rental losses are passive: they offset passive income freely, and up to $25,000/yr can offset ordinary (W-2) income if you actively participate and your MAGI is under $100k (phasing out to $0 by $150k); unused losses carry forward. On sale, claimed depreciation is recaptured at up to 25%, and gains may owe capital-gains tax (a 1031 exchange can defer both). Figures are a year-1 estimate at your 24.0% rate — not tax advice; consult a CPA.
Schools (NCES district)
- District
- Garfield School District No. Re-2
- NCES district ID
- 0806240
- Math proficiency
- 16% ▼ -7.00%
- Reading proficiency
- 36% ▼ -1.00%
- Median HH income
- $60,207
- Composite
- 23.78/100
- National rank
- #7811
- State rank
- #61 of 86 in CO
Livability — New Castle
- Score
- 70/100
- State rank
- #87
- US rank
- #7758
Category grades
Schools grade is shown separately in the Schools card above.
Census & demographics
- City population
- 7,037
- Population (ZIP)
- 7,037
Population outlook (Garfield County) Hauer SSP2
- Today (2025)
- 61,756 people
- By 2030
- 63,255 · +2.4%
- By 2040
- 64,952 · +5.2%
- By 2050
- 64,937 · +5.2%
- By 2075
- 62,413 · +1.1%
- By 2100
- 55,730 · -9.8%
Race, ethnicity, and origin ACS 2023
- Neighborhood character
- Majority White (62%)
- Race & ethnicity
- White 62% Hispanic / Latino 33% Two or more races 21%
- Hispanic origin (detail)
- Mexican 25%
- Common ancestry
- Slovak 3% Serbian 3% Lithuanian 2%
- Foreign-born
- 12% · Canada
- Languages at home
- 75% English-only · Spanish 23% Other Indo-European 1% German/W. Germanic 1%
Political lean MEDSL · Garfield
- 2024 margin
- Toss-up / Even · D 49.8% · R 47.7% · Other 2.5%
- 2008→2024 swing
- +2.1pp toward D · 2008: -0.0pp · 2024: 2.1pp
- All cycles
- 2024: D+2.1 2020: D+2.3 2016: R+7.1 2012: R+4.9 2008: R+0.0
Not yet ingested
- Civics
- —
Market trends
- HPI YoY
- ▼ -34.66%
- Current HPI
- 565.0918
- Rent YoY
- —
- Metro
- —
- State GDP YoY
- ▲ 1.95%
- F500 in state
- 14
Industry mix (Fortune 500 HQ in CO)
| Industry | F500 HQs | Revenue |
|---|---|---|
| Technology Distribution | 1 | $31B |
|
||
| Food / Agriculture | 1 | $18B |
|
||
| Packaging | 1 | $14B |
|
||
| Healthcare | 1 | $13B |
|
||
| Energy | 1 | $10B |
|
||
| Technology | 1 | $4B |
|
||
Price history
-13.1% since first listed7 events — show timeline
- 2026-04-25 Pending — AGMLS
- 2026-03-27 Relisted — AGMLS
- 2026-03-27 Price Changed $199,000 AGMLS
- 2025-10-08 Relisted — AGMLS
- 2025-08-15 Price Changed $214,000 AGMLS
- 2025-04-15 Price Changed $219,000 AGMLS
- 2025-03-31 Listed $229,000 AGMLS
Property tax history
+18.6%/yrLatest (2025): $891 · +167.5% YoY. Source: county tax records.
Cash-flow waterfall
monthlySold comps — $/sqft
last 12 mo · ≤1 miLoading sold comps…