10696 N Credo Dr · Willow, AK
Flood risk 1/10 · Minimal
- FEMA flood zone
- X (unshaded)
- Chance of flooding over 30 yrs
- 0.0%
- Est. flood insurance / yr
- $507 – $1,088
Fire risk No data
- Est. fire insurance / yr
- —
Heat risk No data
- Hot days now (above threshold)
- —
- Hot days in 30 yrs
- —
Wind risk No data
- Chance of severe wind over 30 yrs
- —
Air-quality risk 1/10 · Minimal
- Unhealthy air days now
- —
- Unhealthy air days in 30 yrs
- —
Risk factors via First Street. Map © Google.
Why this score? — see what drove the B grade
The composite is a weighted blend of 9 inputs, each scored 0–100. Each bar is that input's sub-score; the figure is the points it added to the 100-point composite (weight × sub-score).
- Cash flow +30.0/30.0
- 1% rule +10.0/10.0
- DSCR +10.0/10.0
- ARV discount +7.5/15.0
- Appreciation +4.9/10.0
- Schools +4.1/10.0
- Livability +3.0/5.0
- Rent growth +2.5/5.0
- Condition / age +2.5/5.0
$45,000
🖨 Deal sheet 📄 Offer letter ✓ Due diligence
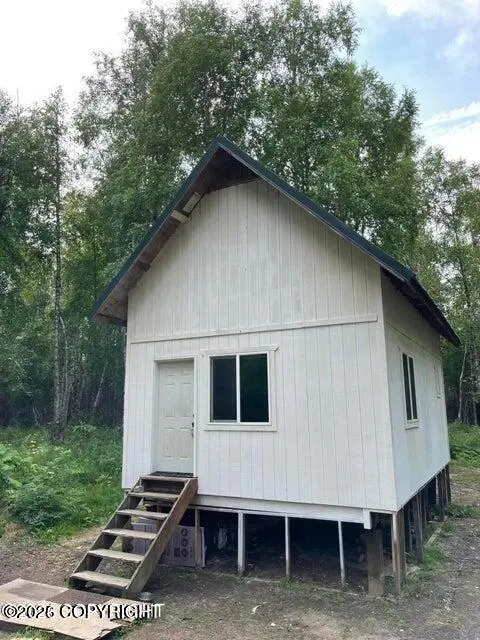
Listing remarks
BUILDING ONLY!! Remodeled, easyish to move. Go under as few lines as possible and you will have a great home to live in.
Key facts
- Built 2002
- Listed 29 days
Property features AI
Exterior
- Parking: No garage or carport
- Utilities: Septic tank sewer
- Home design: Residential property; Detached (not attached); Built in 2002; Other type of foundation
- Construction: Wood frame construction
- Exterior features: Metal roof
Interior
- Bedrooms: 1 bedroom
- Bathrooms: 1 full bathroom
- Interior features: One total room count not specified
Neighborhood map
What this means for you Summary
Snapshot
- This is a 1-bed/1.0-bath other listed at $45k.
Deal economics
- At list price, monthly cash flow is $649 ($8k/yr) — positive.
- The deal already cash-flows at list — no discount required.
- Meets the 1% rule at list price ($1k rent vs $45k).
- Recommended offer: $44k (1.5% below list) — sets the bar for market timing.
- Cap rate 23.6% vs local median 2.1% in Willow — top-decile yield for the area; either an underpriced asset or a hidden risk that comps aren't pricing in. Stress-test before assuming the spread holds.
Location & tenants
- Location reads 60/100 on livability (#86 in AK) — a middle-class / working-renter tenant base. Strengths: housing A+, cost of living B; Watch: health & safety C-, employment D, amenities F.
- Matanuska-Susitna Borough School District (town): math 42% / reading 50% proficiency, ranked #5 of 21 in AK (top 24%) — families likely to look elsewhere, expect single-tenant / working-renter base with shorter leases.
- Zoned schools: Willow Elementary (math 54% / reading 64%, grade B-, #22 of 156 statewide, top 14%, 135 students, 65% FRL); Houston Middle School (329 students, 0% FRL); Houston High School (math 22% / reading 31%, grade F, #41 of 61 statewide, top 67%, 358 students, 57% FRL).
- Market conditions: 215 active listings in the ZIP; 91 units permitted in Matanuska-Susitna Borough in 2024 (25 in 5+ unit buildings).
Forward outlook
- In year one you build about $185 of equity ($311 loan paydown + $-126 appreciation (-0.3% local appreciation)).
- Matanuska-Susitna County population projected at +50% by 2050 — long-run rental-demand tailwind backs the buy-and-hold thesis.
- At projected returns (-0.3% appreciation + 3.0% rent growth), your $13k cash investment doubles in ~2 years — after that, you're playing with house money.
Negotiation context
- It's been on market 29 days — a 2% lower offer ($44k) is reasonable based on typical stale-listing flexibility.
- 7 sale attempts since 25y ago with the ask held roughly flat each time — persistent listings suggest the price (not the market) is what's stuck; bring a comps-based counter.
Questions for the listing agent
- Is there a deadline driving the sale (1031 exchange, divorce, estate, relocation)? That informs how much negotiation room exists.
- What's the average days-on-market for RENTAL listings here right now (not sales)? A rising rental-DOM trend means longer vacancies and softer asking-rent achievability than the comps imply.
- What's the recent tenant-quality profile in this submarket — average credit score on applications, eviction rate, late-payment / NSF rate, and stable-employment percentage? A property-management company in the area should have these aggregated.
- How much new for-sale + rental construction is in the pipeline within 1–3 miles? Heavy new supply typically softens prices + rents 12–24 months out; constrained supply supports both.
Investment metrics
- 1% rule
- 2.68% ✓
- Cap rate
- 23.60%
- Cash-on-cash
- 61.82%
- DSCR
- 3.75
- GRM
- 3.1
CMA / ARV
No comps found within radius.
Projected returns pro-forma
-0.28% appreciation · 3.0% rent growth · sell at horizon
- IRR
- 63.4%
- Equity multiple
- 4.13×
- Total profit
- $39,449
- Equity at exit
- $12,438
- IRR
- 65.7%
- Equity multiple
- 8.37×
- Total profit
- $92,888
- Equity at exit
- $14,459
Cash invested: $12,600 (down + closing). Projections, not guarantees.
Landlord ↔ Tenant lean methodology
- Overall (STATE)
- 80 Strongly Landlord-Friendly
- State Alaska
- 80 Strongly Landlord-Friendly · R+8
- County
- — inherits STATE
- City
- — inherits STATE
ZIP-level market 99688
- Home prices YoY
- -0.2%
- Active inventory
- 215
- Price-to-rent
- 3.1×
Monthly cashflow live
- Estimated rent
- $1,208 medium interval (Pro) →
- Mortgage (P&I)
- −$236
- Tax from tax record
- −$50 /mo · $602/yr
- Insurance
- −$19
- HOA
- −$0
- Vacancy / Maint / Mgmt
- −$254
- Net cashflow
- $649
Break-even live
UW: 25.0% down · 7.5% · 30yr · 1.5% tax · 5.0% vac · 8.0% maint · 8.0% mgmt
Financing live
Cash to close
- Down payment
- $11,250
- Closing costs
- $1,350
- Reserves months
- —
- Total cash needed
- —
Loan-product check · same deal, 3 products live
Conventional
25% down · 7.5% · 30yr
- Down + closing
- —
- Monthly P&I
- —
- Monthly cashflow
- —
- DSCR
- —
- Eligible?
- —
Personal DTI + credit; lowest rate.
DSCR
20% down · 8.5% · 30yr
- Down + closing
- —
- Monthly P&I
- —
- Monthly cashflow
- —
- DSCR
- —
- Eligible?
- —
No personal income docs; deal must DSCR.
Hard money
10% down · 12.0% · 12mo
- Down + closing
- —
- Monthly P&I
- —
- Monthly cashflow
- —
- DSCR
- —
- Eligible?
- —
Short-term bridge; refi at stabilization.
Listing history 28 events
-
2026-06-18days on market $45,000 Active 29 DOM
-
2026-06-17days on market $45,000 Active 28 DOM
-
2026-06-16days on market $45,000 Active 27 DOM
-
2026-06-15days on market $45,000 Active 26 DOM
-
2026-06-14days on market $45,000 Active 24 DOM
-
2026-06-13days on market $45,000 Active 23 DOM
-
2026-06-10days on market $45,000 Active 21 DOM
-
2026-06-09days on market $45,000 Active 20 DOM
-
2026-06-08days on market $45,000 Active 19 DOM
-
2026-06-07days on market $45,000 Active 18 DOM
-
2026-06-03days on market $45,000 Active 14 DOM
-
2026-06-02days on market $45,000 Active 13 DOM
-
2026-06-01days on market $45,000 Active 12 DOM
-
2026-05-31days on market $45,000 Active 11 DOM
-
2026-05-30days on market $45,000 Active 10 DOM
-
2026-05-20$45,000 Active
-
2025-07-16price $70,000
-
2025-05-14$89,000 Active
-
2024-08-14price $129,900
-
2024-07-23price $132,000
-
2024-07-11price $138,000
-
2024-06-01$150,000 Active
-
2023-11-27soldstatus Closed
-
2023-11-13status Pending
-
2023-10-09$45,800 Active
-
2006-07-07$79,900
-
2005-11-03$100,000
-
2001-01-19$5,500
ⓘ Source: listings_history table (triggers on properties + properties_extension) + one-shot
backfill from property_details.listing_events for pre-trigger history.
Tax reassessment forecast AK · Partial reset (capped growth)
- Current annual tax
- $602 · $50/mo
- Projected year-2 tax
- $602 · $50/mo
- Expected delta
- $0/yr ($0/mo · 0.0%)
ⓘ Screening estimate from a state-policy table — verify with the county assessor before closing.
Climate risk First Street
- Flood 1/10 Low FEMA zone X (unshaded) · 0% chance over 30 yrs
- Air quality 1/10 Low
Nearby sold comps map
Loading sold comps map…
Walkable amenities ~0.75 mi
Loading nearby amenities…
Taxation est. · year 1
- Rental income
- $14,491
- − Mortgage interest
- −$2,521
- − Property taxes
- −$602
- − Insurance
- −$225
- − Repairs & maintenance
- −$1,159
- − Management
- −$1,159
- − Depreciation
- −$1,309
- Taxable income
- $7,516
- Est. tax owed @ 24.0%
- −$1,804
- After-tax cash flow
- $5,985/yr
For passive investors: Depreciation is non-cash, so a rental often shows a tax loss while cash-flowing — sheltering income. Rental losses are passive: they offset passive income freely, and up to $25,000/yr can offset ordinary (W-2) income if you actively participate and your MAGI is under $100k (phasing out to $0 by $150k); unused losses carry forward. On sale, claimed depreciation is recaptured at up to 25%, and gains may owe capital-gains tax (a 1031 exchange can defer both). Figures are a year-1 estimate at your 24.0% rate — not tax advice; consult a CPA.
Schools (NCES district)
- District
- Matanuska-Susitna Borough School District
- NCES district ID
- 0200510
- Math proficiency
- 42% ▲ 1.00%
- Reading proficiency
- 50% ▲ 5.00%
- Median HH income
- $70,325
- Composite
- 41.38/100
- National rank
- #3484
- State rank
- #5 of 21 in AK
Livability — Willow
- Score
- 60/100
- State rank
- #86
- US rank
- #19315
Category grades
Schools grade is shown separately in the Schools card above.
Census & demographics
- Census place
- Willow, AK
- City population
- 2,542
- Population (ZIP)
- 2,542
Population outlook (Matanuska-Susitna County) Hauer SSP2
- Today (2025)
- 126,730 people
- By 2030
- 139,641 · +10.2%
- By 2040
- 165,122 · +30.3%
- By 2050
- 189,697 · +49.7%
- By 2075
- 249,959 · +97.2%
- By 2100
- 288,077 · +127.3%
Race, ethnicity, and origin ACS 2023
- Neighborhood character
- Predominantly White (86%)
- Race & ethnicity
- White 86% Two or more races 9% Hispanic / Latino 3% Native American 3%
- Common ancestry
- Slovak 5% Portuguese 5% Romanian 5%
- Foreign-born
- 1% · China, Canada
- Languages at home
- 94% English-only · Spanish 2% German/W. Germanic 1% Chinese 0%
Political lean MEDSL · Matanuska-Susitna
- 2016 margin
- R (+15.2) · D 37.7% · R 52.9% · Other 9.4%
- All cycles
- 2016: R+15.2
Not yet ingested
- Civics
- —
Market trends
- HPI YoY
- ▼ -0.28%
- Current HPI
- 168.6582
- Rent YoY
- —
- Metro
- —
- State GDP YoY
- —
- F500 in state
- 0
Price history
+718.2% since first listed13 events — show timeline
- 2026-05-20 Listed $45,000 AKMLS
- 2025-07-16 Price Changed $70,000 AKMLS
- 2025-05-14 Listed $89,000 AKMLS
- 2024-08-14 Price Changed $129,900 AKMLS
- 2024-07-23 Price Changed $132,000 AKMLS
- 2024-07-11 Price Changed $138,000 AKMLS
- 2024-06-01 Listed $150,000 AKMLS
- 2023-11-27 Sold (MLS) — AKMLS
- 2023-11-13 Pending — AKMLS
- 2023-10-09 Listed $45,800 AKMLS
- 2006-07-07 Listed $79,900 AKMLS
- 2005-11-03 Listed $100,000 AKMLS
- 2001-01-19 Listed $5,500 AKMLS
Property tax history
+2.0%/yrLatest (2025): $602 · -0.4% YoY. Source: county tax records.
Cash-flow waterfall
monthlySold comps — $/sqft
last 12 mo · ≤1 miLoading sold comps…