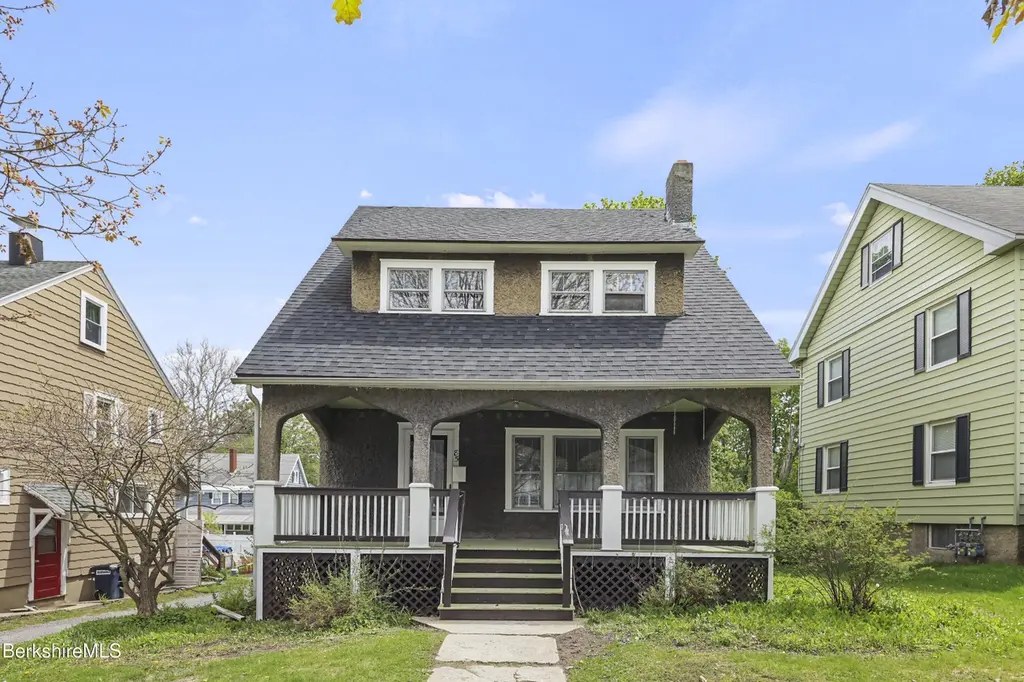
85 Edward Ave · Pittsfield, MA
Flood risk 1/10 · Minimal
- FEMA flood zone
- X
- Chance of flooding over 30 yrs
- 0.0%
- Est. flood insurance / yr
- $473 – $860
Fire risk 1/10 · Minimal
- Est. fire insurance / yr
- $915 – $1,699
Heat risk 3/10 · Minor
- Hot days now (above 90°F)
- 7 days/yr
- Hot days in 30 yrs
- 16 days/yr
Wind risk 4/10 · Minor
- Chance of severe wind over 30 yrs
- 10.0%
Air-quality risk 2/10 · Minimal
- Unhealthy air days now
- 1 days/yr
- Unhealthy air days in 30 yrs
- 1 days/yr
Risk factors via First Street. Map © Google.
Why this score? — see what drove the D grade
The composite is a weighted blend of 9 inputs, each scored 0–100. Each bar is that input's sub-score; the figure is the points it added to the 100-point composite (weight × sub-score).
- ARV discount +13.4/15.0
- Cash flow +10.9/30.0
- Rent growth +4.4/5.0
- Livability +3.8/5.0
- DSCR +3.2/10.0
- 1% rule +2.8/10.0
- Condition / age +2.5/5.0
- Schools +2.3/10.0
- Appreciation +0.0/10.0
$254,900
🖨 Deal sheet (PDF) 📄 Offer letter ✓ Due diligence
Listing remarks
This cherished family home is ready for it's next chapter. A welcoming front foyer opens to a spacious living room filled with natural light and featuring a classic wood-burning fireplace, seamlessly connected to a formal dining room ideal for entertaining. Beautiful hardwood floors, along with original wood molding and trim throughout add timeless character and warmth. The second floor offers four bedrooms with ample closet space, providing flexibility for family, guests or home office needs. Relax on the covered front porch that spans the length of the home -- the perfect setting for morning coffee or evening cocktails. Located in a great walking neighborhood less than two miles from down
Key facts
- Covered front porch
- Walking neighborhood
- Hardwood floors
Tags
Property features AI
Exterior
- Parking: Off-street parking
- Utilities: 100 amp electric service with circuit breakers; Public sewer
- Home design: Total building area approximately 1360
- Exterior features: Porch; Public trash service; Public transportation within 1/2 mile; Deciduous shade trees; Mature landscaping
Interior
- Kitchen: Dishwasher; Refrigerator
- Bedrooms: 7 total rooms (includes bedrooms and living spaces)
- Flooring: Wood flooring; Linoleum
- Bathrooms: 1 full bathroom
- Heating & cooling: Natural gas heating
- Interior features: Fireplace
- Laundry & utility: Washer; Dryer
Neighborhood map
What this means for you Summary
Snapshot
- This is a 4-bed/1.0-bath single-family listed at $255k.
Deal economics
- At list price, monthly cash flow is $-111 ($-1k/yr) — negative.
- To cash-flow at today's rent, offer at most $235k (7.7% below list).
- To meet the 1% rule (rent ≥ 1% of price), the offer needs to be $199k (22.0% below list).
- Recommended offer: $199k (22.0% below list) — sets the bar for 1% rule.
- Cap rate 5.8% vs local median 3.7% in Pittsfield — top-decile yield for the area; either an underpriced asset or a hidden risk that comps aren't pricing in. Stress-test before assuming the spread holds.
Location & tenants
- Location reads 75/100 on livability (#70 in MA, #3,820 nationally) — a middle-class / working-renter tenant base. Strengths: commute A+, housing A+, health & safety A+; Watch: employment C-, amenities D+, crime D.
- Pittsfield (urban): math 19% / reading 34% proficiency, ranked #272 of 302 in MA (top 90%) — low school quality limits family demand, transient renter base, plan for 1-2y turnover.
- Zoned schools: Egremont (math 37% / reading 52%, grade F, #421 of 938 statewide, top 48%, 382 students, 0% FRL); Theodore Herberg Middle (math 17% / reading 34%, grade F, #232 of 305 statewide, top 76%, 496 students, 0% FRL); Pittsfield High (math 32% / reading 57%, grade F, #203 of 343 statewide, top 60%, 651 students, 0% FRL) — zoned schools average 0% FRL vs 50% district-wide (50 pts lower); this property's tenant base skews higher-income than the district average.
- Market conditions: Rents rising fast (+7.7%/yr); 278 active listings in the ZIP; 3 comparable units currently listed for rent nearby; rentals lingering (median 46d on market — plan ~5-8 weeks vacancy on turnover, expect pricing pressure); 100% of comp listings sitting > 30 days — soft ceiling on asking rent; 130 units permitted in Berkshire County in 2024 (10 in 5+ unit buildings).
- This rent runs 34% of the median local income ($71k/yr) — at the standard rent-burdened threshold; future hikes will face affordability resistance.
Forward outlook
- Local home prices are declining (-3.0%/yr); year-one equity from $2k of loan paydown is wiped out by about $8k of value loss. Plan a longer hold.
- Berkshire County population projected at -24% by 2050 — secular population decline; favor cash flow + early exit over multi-decade hold.
Negotiation context
- It's been on market 37 days — a 3% lower offer ($247k) is reasonable based on typical stale-listing flexibility.
Risks & watch-outs
- Watch-outs: built in 1926 — expect roof / HVAC / electrical / plumbing capex.
Questions for the listing agent
- What do current leases actually rent for vs. the listed asking? Can we see a recent rent roll and the last 12 months of T-12 income?
- It's been on market 37 days. Have you received any prior offers? Is the seller open to a 22% concession, seller financing, or rate buy-down credit?
- Built in 1926 — when were the roof, HVAC, electrical panel, plumbing, and water heater last replaced?
- Is there a deadline driving the sale (1031 exchange, divorce, estate, relocation)? That informs how much negotiation room exists.
- Schools are D-rated, which usually means shorter tenancies and higher turnover. Who's the typical renter profile here, and what's been the actual vacancy rate?
- Crime grade is D in this area — have there been break-ins, vandalism, or insurance claims at this property in the last 3 years? What carrier currently insures it and at what premium?
- The area grade is low — what's the realistic commute time and amenity access for the typical tenant pool here? Any planned neighborhood developments (good or bad) we should know about?
- What's the average days-on-market for RENTAL listings here right now (not sales)? A rising rental-DOM trend means longer vacancies and softer asking-rent achievability than the comps imply.
- What's the recent tenant-quality profile in this submarket — average credit score on applications, eviction rate, late-payment / NSF rate, and stable-employment percentage? A property-management company in the area should have these aggregated.
- How much new for-sale + rental construction is in the pipeline within 1–3 miles? Heavy new supply typically softens prices + rents 12–24 months out; constrained supply supports both.
Investment metrics
- 1% rule
- 0.78% ✗
- Cap rate
- 5.77%
- Cash-on-cash
- -1.87%
- DSCR
- 0.92
- GRM
- 10.7
CMA / ARV
- ARV (median comp)
- $293,358
- List price
- $254,900
- Delta
- -13.11%
- Verdict
- UNDERPRICED
- Comps
- 20 within 1.0 mi
Show comp detail 12 sales within ~0.75 mi
| Address | Dist | Beds/Ba | Sqft | Sold | Price | $/sf | Match |
|---|---|---|---|---|---|---|---|
| 44 Strong Ave | 0.18mi | 3/2.0 (-1) | 1,339 (-2%) | 2mo | $362,000 | $270 | 78 |
| 66 Holmes Rd | 0.03mi | 3/1.0 (-1) | 1,257 (-8%) | 6mo | $223,275 | $178 | 76 |
| 17 Kenwood St | 0.38mi | 3/1.0 (-1) | 1,394 (+2%) | 4mo | $285,000 | $204 | 70 |
| 121 Edward Ave | 0.09mi | 3/1.0 (-1) | 1,552 (+14%) | 2mo | $285,000 | $184 | 66 |
| 18 Meadow Ln | 0.26mi | 3/1.0 (-1) | 1,187 (-13%) | 2mo | $244,000 | $206 | 60 |
| 10 Huron St | 0.52mi | 3/1.0 (-1) | 1,275 (-6%) | 1mo | $315,000 | $247 | 59 |
| 25 Ashley St | 0.43mi | 4/2.0 | 1,496 (+10%) | 3mo | $200,000 | $134 | 57 |
| 39 Lowden St | 0.66mi | 3/2.0 (-1) | 1,346 (-1%) | 3mo | $347,000 | $258 | 56 |
| 19 Preston Ave | 0.64mi | 4/2.0 | 1,508 (+11%) | 3mo | $356,000 | $236 | 46 |
| 106 Sampson Pkwy | 0.41mi | 3/1.5 (-1) | 1,561 (+15%) | 5mo | $360,000 | $231 | 45 |
| 461 Elm St | 0.63mi | 3/1.0 (-1) | 1,194 (-12%) | 2mo | $195,000 | $163 | 44 |
| 434 Williams St | 0.66mi | 3/1.5 (-1) | 1,562 (+15%) | 1mo | $520,000 | $333 | 37 |
Match score weights: distance 35% · size 25% · config 20% · recency 20%. Top-matched comps best support the ARV.
Projected returns pro-forma
-3.0% appreciation · 7.72% rent growth · sell at horizon
- IRR
- -14.5%
- Equity multiple
- 0.46×
- Total profit
- $-38,507
- Equity at exit
- $38,006
- IRR
- 0.3%
- Equity multiple
- 1.03×
- Total profit
- $2,034
- Equity at exit
- $22,039
Cash invested: $71,372 (down + closing). Projections, not guarantees.
Landlord ↔ Tenant lean methodology
- Overall (STATE)
- 20 Strongly Tenant-Friendly
- State Massachusetts
- 20 Strongly Tenant-Friendly · D+15
- County
- — inherits STATE
- City
- — inherits STATE
ZIP-level market 01201
- Rents YoY
- 7.7%
- Active inventory
- 278
- Price-to-rent
- 10.7×
Monthly cashflow live
- Estimated rent
- $1,988 medium interval (Pro) →
- Mortgage (P&I)
- −$1,337
- Tax from tax record
- −$239 /mo · $2,865/yr
- Insurance
- −$106
- HOA
- −$0
- Vacancy / Maint / Mgmt
- −$418
- Net cashflow
- $-111
Break-even live
Sensitivity live
| Price | -10% $33 | -5% $-39 | +0% $-111 | +5% $-183 | +10% $-255 |
|---|---|---|---|---|---|
| Rent | -10% $-268 | -5% $-190 | +0% $-111 | +5% $-33 | +10% $46 |
| Rate | -1.0pp $17 | -0.5pp $-46 | base $-111 | +0.5pp $-177 | +1.0pp $-244 |
UW: 25.0% down · 7.5% · 30yr · 1.5% tax · 5.0% vac · 8.0% maint · 8.0% mgmt
Financing live
Cash to close
- Down payment
- $63,725
- Closing costs
- $7,647
- Reserves months
- —
- Total cash needed
- —
Loan-product check · same deal, 3 products live
Conventional
25% down · 7.5% · 30yr
- Down + closing
- —
- Monthly P&I
- —
- Monthly cashflow
- —
- DSCR
- —
- Eligible?
- —
Personal DTI + credit; lowest rate.
DSCR
20% down · 8.5% · 30yr
- Down + closing
- —
- Monthly P&I
- —
- Monthly cashflow
- —
- DSCR
- —
- Eligible?
- —
No personal income docs; deal must DSCR.
Hard money
10% down · 12.0% · 12mo
- Down + closing
- —
- Monthly P&I
- —
- Monthly cashflow
- —
- DSCR
- —
- Eligible?
- —
Short-term bridge; refi at stabilization.
Rent comps 3 comps
| Address | Beds | Baths | Sqft | Rent | $/sqft | DOM | Units | Dist |
|---|---|---|---|---|---|---|---|---|
| 117 Lincoln St Unit 117 Pittsfield, MA | 4.0 | 2.0 | 1500 | $2,000 | $1.33 | 45d | 1 | 1.02mi |
| 19 Atwood Ave Pittsfield, MA | 3.0 | 1.0 | 1350 | $1,600 | $1.19 | 45d | 1 | 1.20mi |
| 76 Stoddard Ave Unit 78 Pittsfield, MA | 4.0 | 1.5 | 1560 | $2,000 | $1.28 | 45d | 1 | 1.29mi |
Listing history 17 events
-
2026-06-21days on market $254,900 Active 37 DOM
-
2026-06-19days on market $254,900 Active 35 DOM
-
2026-06-18days on market $254,900 Active 34 DOM
-
2026-06-17days on market $254,900 Active 33 DOM
-
2026-06-16days on market $254,900 Active 32 DOM
-
2026-06-15days on market $254,900 Active 31 DOM
-
2026-06-14days on market $254,900 Active 29 DOM
-
2026-06-12days on market $254,900 Active 28 DOM
-
2026-06-09days on market $254,900 Active 25 DOM
-
2026-06-08days on market $254,900 Active 24 DOM
-
2026-06-07days on market $254,900 Active 23 DOM
-
2026-06-05days on market $254,900 Active 20 DOM
-
2026-06-02days on market $254,900 Active 18 DOM
-
2026-06-01days on market $254,900 Active 17 DOM
-
2026-05-31days on market $254,900 Active 16 DOM
-
2026-05-30days on market $254,900 Active 15 DOM
-
2026-05-14$269,900 Active 799-char remark
ⓘ Source: listings_history table (triggers on properties + properties_extension) + one-shot
backfill from property_details.listing_events for pre-trigger history.
Tax reassessment forecast MA · Partial reset (capped growth)
- Current annual tax
- $2,865 · $239/mo
- Projected year-2 tax
- $3,000 · $250/mo
- Expected delta
- +$135/yr (+$11/mo · 4.7%)
ⓘ Screening estimate from a state-policy table — verify with the county assessor before closing.
Climate risk First Street
- Flood 1/10 Low FEMA zone X · 0% chance over 30 yrs
- Wildfire 1/10 Low
- Heat 3/10 Moderate 7 d/yr ≥90°F today · 16 d/yr by 30 yrs out
- Wind 4/10 Moderate 10% chance of damaging wind over 30 yrs
- Air quality 2/10 Low 1 unhealthy d/yr today · 1 by 30 yrs out
Nearby sold comps map
Loading sold comps map…
Walkable amenities ~0.75 mi
Loading nearby amenities…
Taxation est. · year 1
- Rental income
- $23,857
- − Mortgage interest
- −$14,278
- − Property taxes
- −$2,865
- − Insurance
- −$1,274
- − Repairs & maintenance
- −$1,909
- − Management
- −$1,909
- − Depreciation
- −$7,415
- Taxable loss
- −$5,793
- Est. tax savings @ 24.0%
- +$1,390
- After-tax cash flow
- $57/yr
For passive investors: Depreciation is non-cash, so a rental often shows a tax loss while cash-flowing — sheltering income. Rental losses are passive: they offset passive income freely, and up to $25,000/yr can offset ordinary (W-2) income if you actively participate and your MAGI is under $100k (phasing out to $0 by $150k); unused losses carry forward. On sale, claimed depreciation is recaptured at up to 25%, and gains may owe capital-gains tax (a 1031 exchange can defer both). Figures are a year-1 estimate at your 24.0% rate — not tax advice; consult a CPA.
Schools (NCES district)
- District
- Pittsfield
- NCES district ID
- 2509630
- Math proficiency
- 19% ▼ -10.00%
- Reading proficiency
- 34% ▼ -2.00%
- Median HH income
- $44,032
- Composite
- 22.67/100
- National rank
- #8046
- State rank
- #272 of 302 in MA
Livability — Pittsfield
- Score
- 75/100
- State rank
- #70
- US rank
- #3820
Category grades
Schools grade is shown separately in the Schools card above.
Census & demographics
- Census place
- Pittsfield, MA
- County
- Berkshire County · 44,848 people
- City population
- 44,848
- Metro
- Pittsfield, MA
- Population (ZIP)
- 44,848
- Household income
- $71,093
- Rent vs Own
- Severe rent burden
- 1580.0
Population outlook (Berkshire County) Hauer SSP2
- Today (2025)
- 119,723 people
- By 2030
- 114,608 · -4.3%
- By 2040
- 102,806 · -14.1%
- By 2050
- 91,305 · -23.7%
- By 2075
- 71,517 · -40.3%
- By 2100
- 57,988 · -51.6%
Race, ethnicity, and origin ACS 2023
- Neighborhood character
- Predominantly White (78%)
- Race & ethnicity
- White 78% Two or more races 10% Hispanic / Latino 9% Black 5% Asian 1%
- Hispanic origin (detail)
- Puerto Rican 3%
- Common ancestry
- Lithuanian 8% Romanian 6% Slovak 2%
- Foreign-born
- 7% · Canada, Jamaica
- Languages at home
- 90% English-only · Spanish 6% Other Indo-European 1% Russian/Polish/Slavic 1%
Political lean MEDSL · Berkshire
- 2024 margin
- Solid D (+39.9) · D 68.9% · R 29.0% · Other 2.1%
- 2008→2024 swing
- -12.5pp toward R · 2008: 52.4pp · 2024: 39.9pp
- All cycles
- 2024: D+39.9 2020: D+47.1 2016: D+41.5 2012: D+53.7 2008: D+52.4
Not yet ingested
- Civics
- —
Market trends
- HPI YoY
- ▼ -199.88%
- Current HPI
- 283.3421
- Rent YoY
- ▲ 7.72%
- Metro
- Pittsfield, MA
- State GDP YoY
- ▲ 2.28%
- F500 in state
- 38
Industry mix (Fortune 500 HQ in MA)
| Industry | F500 HQs | Revenue |
|---|---|---|
| Technology | 3 | $17B |
|
||
| Insurance | 2 | $84B |
|
||
| Retail | 2 | $76B |
|
||
| Life Sciences | 1 | $43B |
|
||
| Energy Technology | 1 | $31B |
|
||
| Aerospace / Defense | 1 | $18B |
|
||
Price history
-5.6% since first listed2 events — show timeline
- 2026-05-29 Price Changed $254,900 BCMLS
- 2026-05-14 Listed $269,900 BCMLS
Property tax history
+3.9%/yrLatest (2023): $2,865 · +9.5% YoY. Source: county tax records.
Cash-flow waterfall
monthlySold comps — $/sqft
last 12 mo · ≤1 miLoading sold comps…