1246 Davella Dr · Nashville-Davidson metropolitan government (balance), TN
Flood risk No data
- FEMA flood zone
- —
- Chance of flooding over 30 yrs
- —
- Est. flood insurance / yr
- —
Fire risk No data
- Est. fire insurance / yr
- —
Heat risk No data
- Hot days now (above threshold)
- —
- Hot days in 30 yrs
- —
Wind risk No data
- Chance of severe wind over 30 yrs
- —
Air-quality risk No data
- Unhealthy air days now
- —
- Unhealthy air days in 30 yrs
- —
Risk factors via First Street. Map © Google.
Why this score? — see what drove the B- grade
The composite is a weighted blend of 9 inputs, each scored 0–100. Each bar is that input's sub-score; the figure is the points it added to the 100-point composite (weight × sub-score).
- Cash flow +29.6/30.0
- DSCR +10.0/10.0
- 1% rule +8.3/10.0
- ARV discount +7.5/15.0
- Condition / age +4.0/5.0
- Rent growth +2.8/5.0
- Livability +2.5/5.0
- Schools +1.4/10.0
- Appreciation +0.0/10.0
$225,000
🖨 Deal sheet 📄 Offer letter ✓ Due diligence
Listing remarks
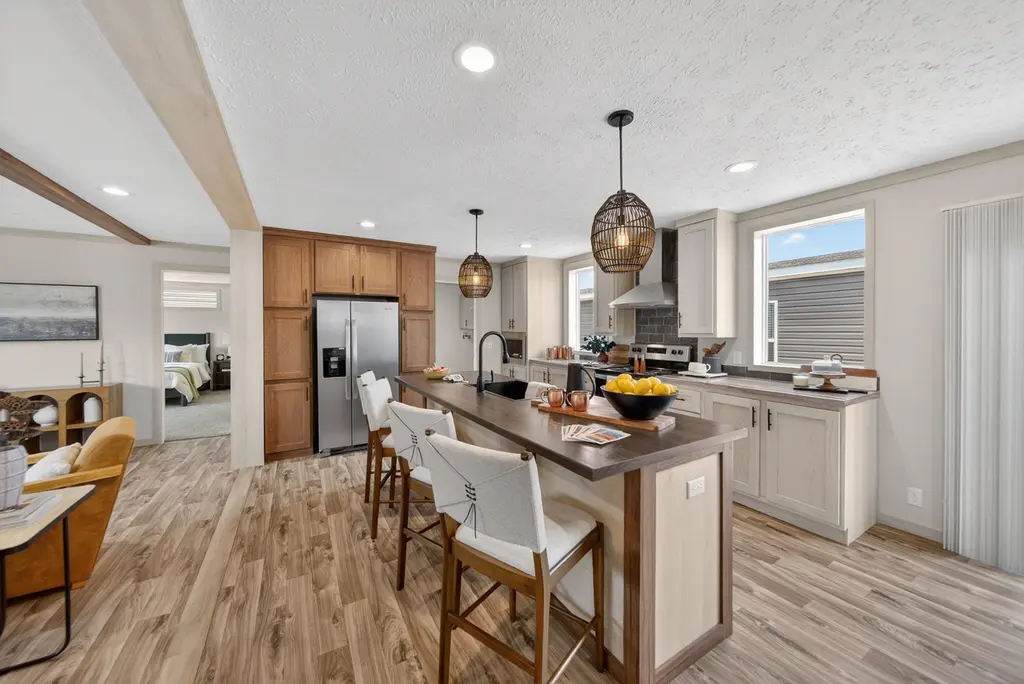
Holiday Village in Nashville, Tennessee is a peaceful, yet vibrant community, ideal for people dreaming of owning a home in a thriving area of Tennessee. Our 3-bedroom, 2-bathroom homes feature spacious open-concept floor plans, Energy-Star Certified appliances, and wood kitchen cabinets. Holiday Village, owned and operated by UMH Properties, is a gated community offering a wide variety of amenities, including bus shelters, and playgrounds. Additionally, this Nashville community offers exciting events such as resident appreciation nights, raffles, and seed and fertilizer handouts to jumpstart your landscaping. With our new expansion underway, we invite you to come choose your lot and custom
Key facts
- Built 2026
- Listed 21 days
Tags
Property features AI
Finance
- Other: Address: 1246 Davella Dr, Nashville TN 37207
- Financial info: List price $225,000
Exterior
- Utilities: Electric utilities; Central air
- Home design: Single-family property (spec new construction, Cavco U84 Holiday Village plan); Active listing
- Construction: Built for 2026 listing (plan: Cavco U84 Holiday Village)
- Exterior features: Shake roof
Interior
- Bedrooms: 3 bedrooms
- Bathrooms: 2 bathrooms (full)
- Heating & cooling: Electric heating; Central air conditioning; Ceiling fan(s)
- Interior features: Open living area (2016 sq ft living area reported)
Neighborhood map
What this means for you Summary
Snapshot
- This is a 3-bed/2.0-bath manufactured listed at $225k. Condition is rated good.
Deal economics
- At list price, monthly cash flow is $812 ($10k/yr) — positive.
- The deal already cash-flows at list — no discount required.
- Meets the 1% rule at list price ($3k rent vs $225k).
- Recommended offer: $222k (1.5% below list) — sets the bar for market timing.
- Cap rate 10.6% vs local median 2.9% in Nashville-Davidson metropolitan government (balance) — top-decile yield for the area; either an underpriced asset or a hidden risk that comps aren't pricing in. Stress-test before assuming the spread holds.
Location & tenants
- Location reads: area grade B — affects rentability + tenant quality, not the cash-flow math above.
- Davidson County (urban): math 12% / reading 19% proficiency, ranked #126 of 139 in TN (top 91%) — low school quality limits family demand, transient renter base, plan for 1-2y turnover; 66% free/reduced lunch — lower-income household profile, screen leases tightly.
- Market conditions: Rents rising (+1.3%/yr); 535 active listings in the ZIP; 40 comparable units currently listed for rent nearby; rentals at typical pace (median 24d on market — plan ~3-4 weeks tenant-placement turnaround); 6,873 units permitted in Davidson County in 2024 (4,138 in 5+ unit buildings).
- At $2,996/mo this rent would consume 58% of the median local household income ($62k/yr) (locally 1969% of renters already pay >50% of income on rent) — very limited rent-growth headroom before tenants either downsize or default.
Forward outlook
- Local home prices are declining (-3.0%/yr); year-one equity from $2k of loan paydown is wiped out by about $7k of value loss. Plan a longer hold.
- Davidson County population projected at +42% by 2050 — long-run rental-demand tailwind backs the buy-and-hold thesis.
- At projected returns (-3.0% appreciation + 1.3% rent growth), your $63k cash investment doubles in ~10 years — after that, you're playing with house money.
Negotiation context
- It's been on market 21 days — a 2% lower offer ($222k) is reasonable based on typical stale-listing flexibility.
Questions for the listing agent
- Is there a deadline driving the sale (1031 exchange, divorce, estate, relocation)? That informs how much negotiation room exists.
- What's the average days-on-market for RENTAL listings here right now (not sales)? A rising rental-DOM trend means longer vacancies and softer asking-rent achievability than the comps imply.
- What's the recent tenant-quality profile in this submarket — average credit score on applications, eviction rate, late-payment / NSF rate, and stable-employment percentage? A property-management company in the area should have these aggregated.
- How much new for-sale + rental construction is in the pipeline within 1–3 miles? Heavy new supply typically softens prices + rents 12–24 months out; constrained supply supports both.
Investment metrics
- 1% rule
- 1.33% ✓
- Cap rate
- 10.62%
- Cash-on-cash
- 15.46%
- DSCR
- 1.69
- GRM
- 6.3
CMA / ARV
No comps found within radius.
Projected returns pro-forma
-3.0% appreciation · 1.33% rent growth · sell at horizon
- IRR
- 4.3%
- Equity multiple
- 1.16×
- Total profit
- $10,325
- Equity at exit
- $33,548
- IRR
- 12.2%
- Equity multiple
- 1.89×
- Total profit
- $56,088
- Equity at exit
- $19,454
Cash invested: $63,000 (down + closing). Projections, not guarantees.
Landlord ↔ Tenant lean methodology
- Overall (STATE)
- 87 Strongly Landlord-Friendly
- State Tennessee
- 87 Strongly Landlord-Friendly · R+13
- County
- — inherits STATE
- City
- — inherits STATE
ZIP-level market 37207
- Home prices YoY
- -27.8%
- Rents YoY
- 1.3%
- Active inventory
- 535
- Price-to-rent
- 6.3×
Monthly cashflow live
- Estimated rent
- $2,996 high interval (Pro) →
- Mortgage (P&I)
- −$1,180
- Tax est. 1.5%
- −$281 /mo · $3,375/yr
- Insurance
- −$94
- HOA
- −$0
- Vacancy / Maint / Mgmt
- −$629
- Net cashflow
- $812
Break-even live
UW: 25.0% down · 7.5% · 30yr · 1.5% tax · 5.0% vac · 8.0% maint · 8.0% mgmt
Financing live
Cash to close
- Down payment
- $56,250
- Closing costs
- $6,750
- Reserves months
- —
- Total cash needed
- —
Loan-product check · same deal, 3 products live
Conventional
25% down · 7.5% · 30yr
- Down + closing
- —
- Monthly P&I
- —
- Monthly cashflow
- —
- DSCR
- —
- Eligible?
- —
Personal DTI + credit; lowest rate.
DSCR
20% down · 8.5% · 30yr
- Down + closing
- —
- Monthly P&I
- —
- Monthly cashflow
- —
- DSCR
- —
- Eligible?
- —
No personal income docs; deal must DSCR.
Hard money
10% down · 12.0% · 12mo
- Down + closing
- —
- Monthly P&I
- —
- Monthly cashflow
- —
- DSCR
- —
- Eligible?
- —
Short-term bridge; refi at stabilization.
Rent comps 40 comps
| Address | Beds | Baths | Sqft | Rent | $/sqft | DOM | Units | Dist |
|---|---|---|---|---|---|---|---|---|
| 105 Duke St #6 Nashville, TN | 2.0 | 2.5 | 1536 | $2,475 | $1.61 | 12d | 1 | 0.48mi |
| 105 Duke St #9 Nashville, TN | 3.0 | 2.5 | 1631 | $3,300 | $2.02 | 23d | 1 | 0.48mi |
| 109 Duke St Unit E Nashville, TN | 2.0 | 2.5 | 1400 | $2,200 | $1.57 | 23d | 1 | 0.50mi |
| 109 Duke St Unit B Nashville, TN | 2.0 | 2.5 | 1400 | $2,000 | $1.43 | 23d | 1 | 0.50mi |
| 1241 N Avondale Cir #121 Nashville, TN | 4.0 | 4.0 | 2540 | $2,999 | $1.18 | 7d | 1 | 0.57mi |
| 1241 N Avondale Cir #121 Nashville, TN | 4.0 | 4.0 | 2580 | $2,999 | $1.16 | 2d | 1 | 0.57mi |
| 1241 N Avondale Cir Nashville, TN | 4.0 | 4.0 | 2244 | $2,999 | $1.34 | 4d | 1 | 0.58mi |
| 128 Gordon Ter Nashville, TN | 3.0 | 2.0 | 1400 | $2,600 | $1.86 | 10d | 1 | 0.59mi |
| 229 Duke St Nashville, TN | 3.0 | 3.0 | 1751 | $3,150 | $1.80 | 23d | 1 | 0.62mi |
| 402B E Trinity Ln Nashville, TN | 3.0 | 2.5 | 2425 | $2,899 | $1.20 | 23d | 1 | 0.82mi |
| 1806 Lischey Ave #1 Nashville, TN | 3.0 | 3.0 | 1800 | $4,800 | $2.67 | 23d | 1 | 0.89mi |
| 1806 Lischey Ave #3 Nashville, TN | 3.0 | 3.0 | 1800 | $2,895 | $1.61 | 23d | 1 | 0.89mi |
| 105 Hart Ln Unit F Nashville, TN | 3.0 | 3.5 | 2408 | $2,900 | $1.20 | 23d | 1 | 0.90mi |
| 105 Hart Ln Unit B Nashville, TN | 3.0 | 3.5 | 1825 | $2,600 | $1.42 | 4d | 1 | 0.90mi |
| 105 Hart Ln Unit E Nashville, TN | 3.0 | 3.5 | 2256 | $2,850 | $1.26 | 23d | 1 | 0.90mi |
| 105 Hart Ln Unit D Nashville, TN | 3.0 | 3.5 | 2135 | $2,750 | $1.29 | 23d | 1 | 0.90mi |
| 1807 Liberia St Nashville, TN | 4.0 | 4.5 | 2100 | $3,050 | $1.45 | 4d | 1 | 0.91mi |
| 1100 Sunset Cir Nashville, TN | 1.0–3.0 | 1.0–2.5 | 1070 | $1,899 | $1.77 | 3d | 7 | 0.92mi |
| 1835 Glade St Nashville, TN | 4.0 | 4.0 | 1920 | $4,095 | $2.13 | 21d | 1 | 0.92mi |
| 303 Gatewood Ave Nashville, TN | 3.0 | 2.0 | 2160 | $2,999 | $1.39 | 23d | 1 | 0.98mi |
| 2628 Old Matthews Rd Nashville, TN | 4.0 | 1.5 | 1584 | $2,185 | $1.38 | 20d | 1 | 0.98mi |
| 1701 Lischey Ave Nashville, TN | 4.0 | 3.0 | 2385 | $3,950 | $1.66 | 23d | 1 | 0.98mi |
| 1699 Lischey Ave Nashville, TN | 4.0 | 3.0 | 2385 | $3,995 | $1.68 | 23d | 1 | 0.98mi |
| 514 Proximity Cir Nashville, TN | 3.0 | 3.5 | 2237 | $2,900 | $1.30 | 23d | 1 | 1.03mi |
| 2718 Oakwood Ave Nashville, TN | 4.0 | 2.0 | 1850 | $2,595 | $1.40 | 23d | 1 | 1.04mi |
| 518 Yokley Dr Nashville, TN | 3.0 | 2.5 | 2020 | $2,770 | $1.37 | 23d | 1 | 1.06mi |
| 504 Edwin St #18 Nashville, TN | 4.0 | 3.5 | 2002 | $3,495 | $1.75 | 23d | 1 | 1.08mi |
| 504 Edwin St #18 Nashville, TN | 4.0 | 3.5 | 2002 | $3,495 | $1.75 | 3d | 1 | 1.08mi |
| 2079 Oakwood Ave Nashville, TN | 2.0 | 2.5 | 1800 | $2,500 | $1.39 | 23d | 1 | 1.12mi |
| 121 Lucile St Nashville, TN | 4.0 | 4.5 | 2203 | $3,573 | $1.62 | 23d | 1 | 1.15mi |
| 513B Weakley Ave Nashville, TN | 3.0 | 2.5 | 2200 | $3,500 | $1.59 | 23d | 1 | 1.17mi |
| 117 Elmhurst Ave Nashville, TN | 4.0 | 3.5 | 2544 | $3,995 | $1.57 | 23d | 1 | 1.17mi |
| 117 Elmhurst Ave Nashville, TN | 4.0 | 3.5 | 2544 | $3,995 | $1.57 | 14d | 1 | 1.17mi |
| 206 Ben Allen Rd #5 Nashville, TN | 3.0 | 3.5 | 2015 | $3,400 | $1.69 | 23d | 1 | 1.17mi |
| 206 Ben Allen Rd #4 Nashville, TN | 3.0 | 3.5 | 1947 | $3,000 | $1.54 | 4d | 1 | 1.17mi |
| 115 Elmhurst Ave Nashville, TN | 4.0 | 3.0 | 2016 | $3,995 | $1.98 | 23d | 1 | 1.18mi |
| 115 Elmhurst Ave Nashville, TN | 4.0 | 3.0 | 2016 | $3,995 | $1.98 | 14d | 1 | 1.18mi |
| 519 Weakley Ave Unit B Nashville, TN | 3.0 | 4.0 | 2482 | $4,250 | $1.71 | 17d | 1 | 1.19mi |
| 99 Fern Ave Nashville, TN | 3.0 | 3.0 | 2033 | $3,450 | $1.70 | 14d | 1 | 1.19mi |
| 519B Weakley Ave Nashville, TN | 3.0 | 4.0 | 2482 | $4,250 | $1.71 | 4d | 1 | 1.20mi |
Listing history 14 events
-
2026-06-18days on market $225,000 Active 21 DOM
-
2026-06-17days on market $225,000 Active 20 DOM
-
2026-06-16days on market $225,000 Active 19 DOM
-
2026-06-15days on market $225,000 Active 18 DOM
-
2026-06-13days on market $225,000 Active 16 DOM
-
2026-06-13days on market $225,000 Active 15 DOM
-
2026-06-09days on market $225,000 Active 12 DOM
-
2026-06-08days on market $225,000 Active 11 DOM
-
2026-06-07days on market $225,000 Active 10 DOM
-
2026-06-05days on market $225,000 Active 7 DOM
-
2026-06-03days on market $225,000 Active 6 DOM
-
2026-06-02days on market $225,000 Active 5 DOM
-
2026-06-01days on market $225,000 Active 4 DOM
-
2026-05-31days on market $225,000 Active 3 DOM
ⓘ Source: listings_history table (triggers on properties + properties_extension) + one-shot
backfill from property_details.listing_events for pre-trigger history.
Nearby sold comps map
Loading sold comps map…
Walkable amenities ~0.75 mi
Loading nearby amenities…
Taxation est. · year 1
- Rental income
- $35,947
- − Mortgage interest
- −$12,603
- − Property taxes
- −$3,375
- − Insurance
- −$1,125
- − Repairs & maintenance
- −$2,876
- − Management
- −$2,876
- − Depreciation
- −$6,545
- Taxable income
- $6,547
- Est. tax owed @ 24.0%
- −$1,571
- After-tax cash flow
- $8,168/yr
For passive investors: Depreciation is non-cash, so a rental often shows a tax loss while cash-flowing — sheltering income. Rental losses are passive: they offset passive income freely, and up to $25,000/yr can offset ordinary (W-2) income if you actively participate and your MAGI is under $100k (phasing out to $0 by $150k); unused losses carry forward. On sale, claimed depreciation is recaptured at up to 25%, and gains may owe capital-gains tax (a 1031 exchange can defer both). Figures are a year-1 estimate at your 24.0% rate — not tax advice; consult a CPA.
Condition & rehab AI · 5 photos
This home is in good condition with a modern kitchen and bathrooms, hardwood floors, and well-maintained exterior. It is ready for a fresh coat of paint on the exterior siding and new light fixtures to enhance its curb appeal and rental value.
Value-add opportunities
- Resale Paint the exterior siding — Fresh paint can enhance curb appeal and property value
- Rental Replace the ceiling light fixtures — Modern light fixtures can improve the rental appeal and attract tenants
Renovation cost estimate screening
Value-add ROI direction
- Resale Paint the exterior siding — Fresh paint can enhance curb appeal and property value ↑
- Rental Replace the ceiling light fixtures — Modern light fixtures can improve the rental appeal and attract tenants ↑
ⓘ Cost ranges are severity-bucket heuristics (US national rule-of-thumb). Get contractor quotes + a written scope before underwriting a rehab budget.
Schools (NCES district)
- District
- Davidson County
- NCES district ID
- 4703180
- Math proficiency
- 12% ▼ -17.00%
- Reading proficiency
- 19% ▼ -7.00%
- Median HH income
- $48,667
- Composite
- 14.03/100
- National rank
- #9472
- State rank
- #126 of 139 in TN
Livability — Nashville-Davidson metropolitan government (balance)
No livability data for this city. (Only ~50 U.S. cities are tracked.)
Census & demographics
- Census place
- Nashville-Davidson metropolitan government (balance), TN
- County
- Davidson County · 680,067 people
- City population
- 677,595
- Metro
- Nashville-Davidson--Murfreesboro--Franklin, TN
- Population (ZIP)
- 41,366
- Household income
- $61,744
- Rent vs Own
- Severe rent burden
- 1969.0
Population outlook (Davidson County) Hauer SSP2
- Today (2025)
- 808,568 people
- By 2030
- 874,489 · +8.2%
- By 2040
- 1,009,046 · +24.8%
- By 2050
- 1,147,294 · +41.9%
- By 2075
- 1,475,439 · +82.5%
- By 2100
- 1,714,101 · +112.0%
Race, ethnicity, and origin ACS 2023
- Neighborhood character
- Diverse neighborhood (Simpson 0.60)
- Race & ethnicity
- Black 57% White 24% Hispanic / Latino 13% Two or more races 8%
- Hispanic origin (detail)
- Mexican 6%
- Common ancestry
- Slovak 2% Serbian 1% Romanian 1%
- Foreign-born
- 10% · Canada, Jamaica
- Languages at home
- 88% English-only · Spanish 10%
Political lean MEDSL · Davidson
- 2024 margin
- Strong D (+27.4) · D 62.7% · R 35.3% · Other 2.0%
- 2008→2024 swing
- +6.5pp toward D · 2008: 21.0pp · 2024: 27.4pp
- All cycles
- 2024: D+27.4 2020: D+32.1 2016: D+26.0 2012: D+18.7 2008: D+21.0
Not yet ingested
- Civics
- —
Market trends
- HPI YoY
- ▼ -135.21%
- Current HPI
- 351.9628
- Rent YoY
- ▲ 1.33%
- Metro
- Nashville-Davidson--Murfreesboro--Franklin, TN
- State GDP YoY
- ▲ 2.78%
- F500 in state
- 22
Industry mix (Fortune 500 HQ in TN)
| Industry | F500 HQs | Revenue |
|---|---|---|
| Healthcare | 3 | $91B |
|
||
| Retail | 3 | $72B |
|
||
| Transportation / Logistics | 1 | $88B |
|
||
| Paper / Packaging | 1 | $19B |
|
||
| Insurance | 1 | $13B |
|
||
| Energy | 1 | $12B |
|
||
Cash-flow waterfall
monthlySold comps — $/sqft
last 12 mo · ≤1 miLoading sold comps…