 Duplex
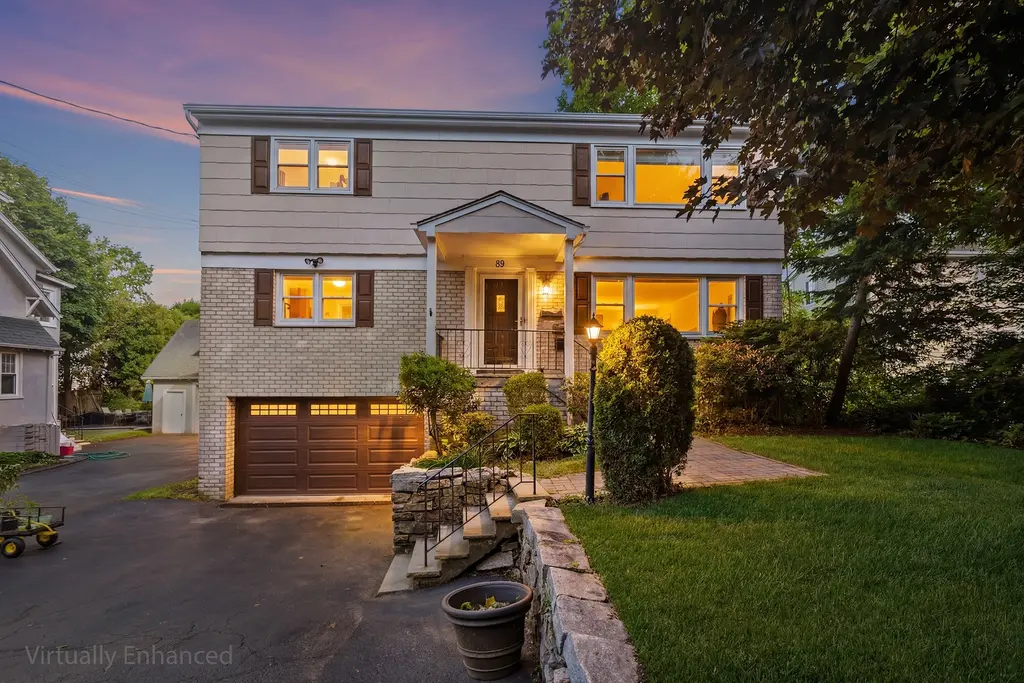
89 Frances Ave · Harrison, NY
Flood risk 7/10 · Major
- FEMA flood zone
- X (unshaded)
- Chance of flooding over 30 yrs
- 0.77%
- Est. flood insurance / yr
- $473 – $860
Fire risk 1/10 · Minimal
- Est. fire insurance / yr
- $691 – $1,283
Heat risk 6/10 · Moderate
- Hot days now (above 98°F)
- 7 days/yr
- Hot days in 30 yrs
- 16 days/yr
Wind risk 6/10 · Moderate
- Chance of severe wind over 30 yrs
- 27.0%
Air-quality risk 4/10 · Minor
- Unhealthy air days now
- 5 days/yr
- Unhealthy air days in 30 yrs
- 7 days/yr
Risk factors via First Street. Map © Google.
Why this score? — see what drove the D grade
The composite is a weighted blend of 9 inputs, each scored 0–100. Each bar is that input's sub-score; the figure is the points it added to the 100-point composite (weight × sub-score).
- Cash flow +11.3/30.0
- Schools +6.5/10.0
- ARV discount +5.9/15.0
- Rent growth +4.9/5.0
- Condition / age +3.8/5.0
- Livability +3.6/5.0
- 1% rule +3.3/10.0
- DSCR +3.3/10.0
- Appreciation +0.0/10.0
$1,299,000
🖨 Deal sheet (PDF) 📄 Offer letter ✓ Due diligence
Multi-family units
County records classify this as Multi-Family (2-4 Unit). Listing-text estimate: 2 units. confirmed
Listing remarks MLS
Great investment opportunity! Or live in one unit, while collecting rent in other unit. This well maintained 2 family home is within walking distance to Parsons Elementary School, Metro North Train Station, parks, bus stops, restaurants and shopping. First floor unit has hardwood floors throughout, eat in kitchen with sliding door to deck, dining & living rooms, 3 bedrooms and a 2 full baths! The above ground walk out basement is finished, laundry room, large party room with wet bar. The house includes an attached oversized one car garage. The driveway can fit up to 4 cars. The property has been owner occupied since built and has been well cared for. New roof & gutters installed 2024. 2 hot water heaters installed 2024. Freshly painted. Second floor is newly renovated and wall to wall carpet throughout. Taxes do not include STAR program discount of $990. Additional Information: Amenities:Storage,ParkingFeatures:1 Car Attached,
Key facts
- Eat-in kitchen
- Hardwood floors
- 4,792 sq ft lot
Tags
Property features AI
Exterior
- Parking: Driveway parking; Garage with door opener; Heated garage; Total parking for 5 vehicles; 1 garage space
- Utilities: Electricity connected (Con-Edison); Natural gas connected; Public water; Public sewer; Trash collection (public)
- Home design: Duplex; Raised foundation
- Construction: Brick and shingle siding construction
- Exterior features: Balcony; Garden; Partial fencing; Covered deck
Interior
- Kitchen: Granite counters; Kitchen island; Breakfast bar; Eat-in kitchen
- Bedrooms: Two 3-bedroom units (multi-unit property)
- Flooring: Hardwood; Carpet
- Bathrooms: Four full bathrooms
- Heating & cooling: Central air; Wall/window unit(s); Baseboard heating
- Interior features: First-floor bedroom; First-floor full bathroom; Breakfast bar; Ceiling fans; Eat-in kitchen; Entrance foyer; Granite countertops; Kitchen island; Storage space; Bay windows; Blinds; Covered deck / porch
- Laundry & utility: Washer hookup; Electric dryer hookup; Gas dryer hookup; Laundry in basement, in garage and in kitchen (multiple locations)
Neighborhood map
What this means for you Summary
Snapshot
- This is a 2 × 3-bed/2-bath units multifamily listed at $1.30M. Condition is rated good.
Deal economics
- At list price, monthly cash flow is $-524 ($-6k/yr) — negative. Per door: $-262/mo.
- To cash-flow at today's rent, offer at most $1.22M (5.8% below list).
- To meet the 1% rule (rent ≥ 1% of price), the offer needs to be $1.08M (17.1% below list).
- Recommended offer: $1.08M (17.1% below list) — sets the bar for 1% rule.
- Cap rate 5.9% vs local median 2.2% in Harrison — top-decile yield for the area; either an underpriced asset or a hidden risk that comps aren't pricing in. Stress-test before assuming the spread holds.
Location & tenants
- Location reads 72/100 on livability (#355 in NY) — a middle-class / working-renter tenant base. Strengths: commute A+, employment A+, crime A; Watch: housing C-, amenities F, cost of living F.
- Harrison Central School District (suburban): math 69% / reading 72% proficiency, ranked #92 of 590 in NY (top 16%) — strong family-tenant draw, lease renewals of 3-5y typical; only 10% free/reduced lunch — higher-income household profile.
- Zoned schools: Parsons Memorial School (math 71% / reading 62%, grade B+, #575 of 2,108 statewide, top 27%, 488 students, 24% FRL); Louis M Klein Middle School (math 51% / reading 71%, grade B+, #150 of 729 statewide, top 21%, 824 students, 22% FRL); Harrison High School (math 96%, 1,064 students, 21% FRL).
- Market conditions: Rents rising fast (+9.7%/yr); 63 active listings in the ZIP; 2 comparable units currently listed for rent nearby; high-income renter base; 954 units permitted in Westchester County in 2024 (649 in 5+ unit buildings).
- At $10,770/mo this rent would consume 84% of the median local household income ($154k/yr) (locally 461% of renters already pay >50% of income on rent) — very limited rent-growth headroom before tenants either downsize or default.
Forward outlook
- Local home prices are declining (-3.0%/yr); year-one equity from $9k of loan paydown is wiped out by about $39k of value loss. Plan a longer hold.
- Westchester County population projected at +10% by 2050 — modest demand growth; plan on rents tracking national, not racing it.
Negotiation context
- It's been on market 24 days — a 2% lower offer ($1.28M) is reasonable based on typical stale-listing flexibility.
- 2 sale attempts since 2y ago with the ask held roughly flat each time — persistent listings suggest the price (not the market) is what's stuck; bring a comps-based counter.
Risks & watch-outs
- Watch-outs: flood insurance adds $56/mo.
- Climate carrying-cost: major flood risk; major wind risk, 27% chance of damaging wind over 30y; extreme-heat days projected 7→16/yr by 2055 (HVAC capex compounding) — expect insurance premiums to compound above CPI over the hold.
Questions for the listing agent
- What do current leases actually rent for vs. the listed asking? Can we see a recent rent roll and the last 12 months of T-12 income?
- Can we see the unit-by-unit rent roll, current vacancy, and any below-market leases? What's the average tenancy length?
- What capital expenditures (roof, boiler, parking lot, exteriors) have been made in the last 5 years, and what's planned in the next 2?
- Built in 1974 — when were the roof, HVAC, electrical panel, plumbing, and water heater last replaced?
- What's the actual annual flood-insurance premium (NFIP or private), and is the property in a SFHA with mandatory coverage?
- Is there a deadline driving the sale (1031 exchange, divorce, estate, relocation)? That informs how much negotiation room exists.
- Schools are A-rated — typically a magnet for longer-tenancy family renters. What's the average tenant stay here, and is there a school-zone premium baked into asking?
- The area grade is low — what's the realistic commute time and amenity access for the typical tenant pool here? Any planned neighborhood developments (good or bad) we should know about?
- What's the average days-on-market for RENTAL listings here right now (not sales)? A rising rental-DOM trend means longer vacancies and softer asking-rent achievability than the comps imply.
- What's the recent tenant-quality profile in this submarket — average credit score on applications, eviction rate, late-payment / NSF rate, and stable-employment percentage? A property-management company in the area should have these aggregated.
- How much new apartment / multifamily construction is in the pipeline within 1–3 miles? Heavy new supply (>2% of stock underway) typically softens rents 12–24 months out; light construction supports rent growth.
Investment metrics
- 1% rule
- 0.83% ✗
- Cap rate
- 5.86%
- Cash-on-cash
- -1.55%
- DSCR
- 0.93
- GRM
- 10.1
CMA / ARV
- ARV (on-the-fly)
- $1,253,768
- Comps found
- 12
Show comp detail 12 sales within ~0.75 mi
| Address | Dist | Beds/Ba | Sqft | Sold | Price | $/sf | Match |
|---|---|---|---|---|---|---|---|
| 89 Frances Ave | 0.00mi | 6/4.0 | 2,957 (0%) | 17mo | $1,253,000 | $424 | 86 |
| 6-8 Marion Ave | 0.10mi | 6/6.0 | 2,840 (-4%) | 3mo | $1,355,000 | $477 | 78 |
| 1623 Rose Ave | 0.45mi | 5/3.0 (-1) | 2,960 (+0%) | 2mo | $1,120,000 | $378 | 69 |
| 158 Park Ave | 0.25mi | 5/3.0 (-1) | 3,085 (+4%) | 6mo | $1,200,000 | $389 | 68 |
| 41-43 Clifford Pl | 0.29mi | 5/4.0 (-1) | 3,038 (+3%) | 11mo | $1,250,000 | $411 | 67 |
| 56-58 Fremont St | 0.23mi | 6/5.0 | 3,358 (+14%) | 1mo | $1,300,000 | $387 | 62 |
| 115 Calvert St | 0.17mi | 6/2.0 | 2,612 (-12%) | 6mo | $1,275,000 | $488 | 60 |
| 135 Webster Ave | 0.31mi | 6/— | 2,678 (-9%) | 12mo | $999,000 | $373 | 60 |
| 183 Park Ave | 0.31mi | 5/3.0 (-1) | 2,549 (-14%) | 2mo | $1,125,000 | $441 | 52 |
| 7 Harris Ln | 0.41mi | 6/5.0 | 2,757 (-7%) | 17mo | $1,185,000 | $430 | 52 |
| 1416 Harrison Ave | 0.62mi | 6/6.0 | 2,976 (+1%) | 14mo | $1,375,000 | $462 | 50 |
| 195 Crotona Ave #193 | 0.64mi | 6/5.0 | 3,185 (+8%) | 20mo | $1,350,000 | $424 | 37 |
Match score weights: distance 35% · size 25% · config 20% · recency 20%. Top-matched comps best support the ARV.
Projected returns pro-forma
-3.0% appreciation · 8.0% rent growth · sell at horizon
- IRR
- -13.7%
- Equity multiple
- 0.49×
- Total profit
- $-186,776
- Equity at exit
- $193,685
- IRR
- 1.7%
- Equity multiple
- 1.15×
- Total profit
- $54,209
- Equity at exit
- $112,314
Cash invested: $363,720 (down + closing). Projections, not guarantees.
Landlord ↔ Tenant lean methodology
- Overall (STATE)
- 15 Strongly Tenant-Friendly
- State New York
- 15 Strongly Tenant-Friendly · D+10
- County
- — inherits STATE
- City
- — inherits STATE
ZIP-level market 10528
- Home prices YoY
- -18.4%
- Rents YoY
- 9.7%
- Active inventory
- 63
- Price-to-rent
- 20.1×
Monthly cashflow live
- Estimated rent
- $10,770 high interval (Pro) →
- Mortgage (P&I)
- −$6,812
- Tax est. 1.5%
- −$1,624 /mo · $19,485/yr
- Insurance
- −$541
- Flood insurance flood zone
- −$56 /mo · $666/yr
- HOA
- −$0
- Vacancy / Maint / Mgmt
- −$2,262
- Net cashflow
- $-524
Break-even live
Sensitivity live
| Price | -10% $373 | -5% $-75 | +0% $-524 | +5% $-973 | +10% $-1,422 |
|---|---|---|---|---|---|
| Rent | -10% $-1,375 | -5% $-950 | +0% $-524 | +5% $-99 | +10% $326 |
| Rate | -1.0pp $130 | -0.5pp $-194 | base $-524 | +0.5pp $-861 | +1.0pp $-1,203 |
2-unit breakdown (identical units grouped — click to expand)
| Units | Beds | Baths | Est. rent |
|---|---|---|---|
| 2× units | 3 | 2 | $10,770 |
| #1 | 3 | 2 | $5,385 |
| #2 | 3 | 2 | $5,385 |
| Total (2 units) | $10,770 | ||
UW: 25.0% down · 7.5% · 30yr · 1.5% tax · 5.0% vac · 8.0% maint · 8.0% mgmt
Financing live
Cash to close
- Down payment
- $324,750
- Closing costs
- $38,970
- Reserves months
- —
- Total cash needed
- —
Loan-product check · same deal, 3 products live
Conventional
25% down · 7.5% · 30yr
- Down + closing
- —
- Monthly P&I
- —
- Monthly cashflow
- —
- DSCR
- —
- Eligible?
- —
Personal DTI + credit; lowest rate.
DSCR
20% down · 8.5% · 30yr
- Down + closing
- —
- Monthly P&I
- —
- Monthly cashflow
- —
- DSCR
- —
- Eligible?
- —
No personal income docs; deal must DSCR.
Hard money
10% down · 12.0% · 12mo
- Down + closing
- —
- Monthly P&I
- —
- Monthly cashflow
- —
- DSCR
- —
- Eligible?
- —
Short-term bridge; refi at stabilization.
Rent comps 2 comps
| Address | Beds | Baths | Sqft | Rent | $/sqft | DOM | Units | Dist |
|---|---|---|---|---|---|---|---|---|
| 124 Nelson Ave Harrison, NY | 5.0 | 4.5 | 3392 | $12,500 | $3.69 | 18d | 1 | 0.59mi |
| 625 Lorraine St Mamaroneck, NY | 5.0 | 2.0 | 1926 | $6,300 | $3.27 | 0d | 1 | 0.66mi |
Listing history 15 events
-
2026-06-21days on market $1,299,000 Active 24 DOM
-
2026-06-18days on market $1,299,000 Active 21 DOM
-
2026-06-17days on market $1,299,000 Active 20 DOM
-
2026-06-16days on market $1,299,000 Active 19 DOM
-
2026-06-15days on market $1,299,000 Active 18 DOM
-
2026-06-13days on market $1,299,000 Active 16 DOM
-
2026-06-13days on market $1,299,000 Active 15 DOM
-
2026-06-09days on market $1,299,000 Active 12 DOM
-
2026-06-08days on market $1,299,000 Active 11 DOM
-
2026-06-07days on market $1,299,000 Active 10 DOM
-
2026-06-04days on market $1,299,000 Active 7 DOM
-
2026-06-03days on market $1,299,000 Active 6 DOM
-
2026-06-02days on market $1,299,000 Active 5 DOM
-
2026-06-01days on market $1,299,000 Active 4 DOM
-
2026-05-31days on market $1,299,000 Active 3 DOM
ⓘ Source: listings_history table (triggers on properties + properties_extension) + one-shot
backfill from property_details.listing_events for pre-trigger history.
Climate risk First Street
- Flood 7/10 Severe FEMA zone X (unshaded) · 77% chance over 30 yrs
- Wildfire 1/10 Low
- Heat 6/10 Major 7 d/yr ≥98°F today · 16 d/yr by 30 yrs out
- Wind 6/10 Major 27% chance of damaging wind over 30 yrs
- Air quality 4/10 Moderate 5 unhealthy d/yr today · 7 by 30 yrs out
Nearby sold comps map
Loading sold comps map…
Walkable amenities ~0.75 mi
Loading nearby amenities…
Taxation est. · year 1
- Rental income
- $129,240
- − Mortgage interest
- −$72,764
- − Property taxes
- −$19,485
- − Insurance
- −$7,162
- − Repairs & maintenance
- −$10,339
- − Management
- −$10,339
- − Depreciation
- −$37,789
- Taxable loss
- −$28,638
- Est. tax savings @ 24.0%
- +$6,873
- After-tax cash flow
- $581/yr
For passive investors: Depreciation is non-cash, so a rental often shows a tax loss while cash-flowing — sheltering income. Rental losses are passive: they offset passive income freely, and up to $25,000/yr can offset ordinary (W-2) income if you actively participate and your MAGI is under $100k (phasing out to $0 by $150k); unused losses carry forward. On sale, claimed depreciation is recaptured at up to 25%, and gains may owe capital-gains tax (a 1031 exchange can defer both). Figures are a year-1 estimate at your 24.0% rate — not tax advice; consult a CPA.
Condition & rehab AI · 12 photos
This multi-family home is in good condition with cosmetic updates needed. It offers a great investment opportunity with potential for rental or resale value increase.
Value-add opportunities
- Both Paint exterior — Enhances curb appeal and value
- Both Replace carpet with hardwood — Improves aesthetics and is easier to maintain
- Both Install smart home devices — Enhances convenience and marketability
Renovation cost estimate screening
Value-add ROI direction
- Both Paint exterior — Enhances curb appeal and value ↑
- Both Replace carpet with hardwood — Improves aesthetics and is easier to maintain ↑
- Both Install smart home devices — Enhances convenience and marketability ↑
ⓘ Cost ranges are severity-bucket heuristics (US national rule-of-thumb). Get contractor quotes + a written scope before underwriting a rehab budget.
Schools (NCES district)
- District
- Harrison Central School District
- NCES district ID
- 3613740
- Math proficiency
- 69% ▼ -6.00%
- Reading proficiency
- 72% ▲ 6.00%
- Median HH income
- $105,919
- Composite
- 65.12/100
- National rank
- #497
- State rank
- #92 of 590 in NY
Livability — Harrison
- Score
- 72/100
- State rank
- #355
- US rank
- #5963
Category grades
Schools grade is shown separately in the Schools card above.
Census & demographics
- Census place
- Harrison, NY
- County
- Westchester County · 709,332 people
- City population
- 14,091
- Metro
- New York-Newark-Jersey City, NY-NJ-PA
- Population (ZIP)
- 14,091
- Household income
- $154,416
- Rent vs Own
- Severe rent burden
- 461.0
Population outlook (Westchester County) Hauer SSP2
- Today (2025)
- 1,028,035 people
- By 2030
- 1,051,636 · +2.3%
- By 2040
- 1,098,520 · +6.9%
- By 2050
- 1,136,044 · +10.5%
- By 2075
- 1,196,925 · +16.4%
- By 2100
- 1,175,147 · +14.3%
Race, ethnicity, and origin ACS 2023
- Neighborhood character
- Predominantly White (68%)
- Race & ethnicity
- White 68% Hispanic / Latino 16% Asian 10% Two or more races 5% Black 3%
- Hispanic origin (detail)
- Puerto Rican 4% Salvadoran 1%
- Common ancestry
- Lithuanian 3% Romanian 2% Scotch-Irish 2%
- Foreign-born
- 23% · Canada, Dominican Republic, China
- Languages at home
- 70% English-only · Spanish 11% Other Indo-European 8% Other Asian/Pacific 7%
Political lean MEDSL · Westchester
- 2024 margin
- Strong D (+26.3) · D 63.1% · R 36.9%
- 2008→2024 swing
- -1.3pp toward R · 2008: 27.6pp · 2024: 26.3pp
- All cycles
- 2024: D+26.3 2020: D+36.3 2016: D+32.8 2012: D+22.2 2008: D+27.6
Not yet ingested
- Civics
- —
Market trends
- HPI YoY
- ▼ -66.61%
- Current HPI
- 296.3824
- Rent YoY
- ▲ 9.65%
- Metro
- New York-Newark-Jersey City, NY-NJ-PA
- State GDP YoY
- ▲ 2.60%
- F500 in state
- 92
Industry mix (Fortune 500 HQ in NY)
| Industry | F500 HQs | Revenue |
|---|---|---|
| Financial Services | 10 | $950B |
|
||
| Consumer Goods | 9 | $162B |
|
||
| Insurance | 4 | $225B |
|
||
| Telecommunications | 2 | $144B |
|
||
| Pharmaceuticals | 2 | $112B |
|
||
| Media / Entertainment | 2 | $69B |
|
||
Price history
+10.6% since first listed4 events — show timeline
- 2026-05-28 Listed $1,299,000 OneKey® MLS as Distributed by MLS Grid
- 2025-01-16 Sold (MLS) $1,253,000 OneKey® MLS as Distributed by MLS Grid
- 2024-11-08 Pending — OneKey® MLS as Distributed by MLS Grid
- 2024-10-23 Listed $1,175,000 OneKey® MLS as Distributed by MLS Grid
Cash-flow waterfall
monthlySold comps — $/sqft
last 12 mo · ≤1 miLoading sold comps…