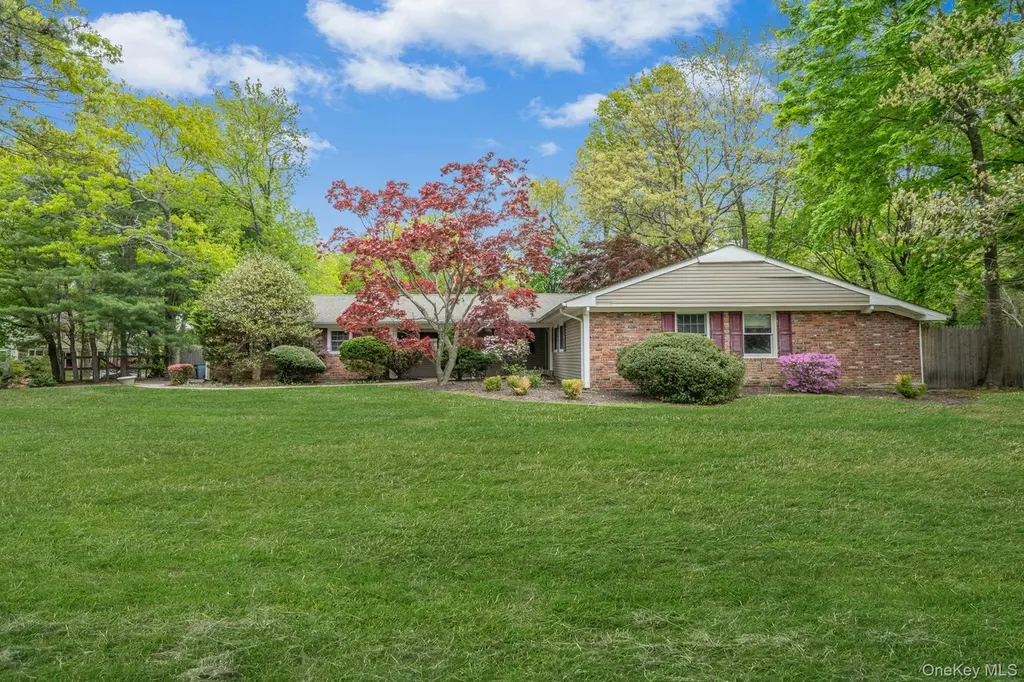
35 Pembrook Dr · Stony Brook, NY
Flood risk 1/10 · Minimal
- FEMA flood zone
- X (unshaded)
- Chance of flooding over 30 yrs
- 0.0%
- Est. flood insurance / yr
- $507 – $1,088
Fire risk 1/10 · Minimal
- Est. fire insurance / yr
- $691 – $1,283
Heat risk 5/10 · Moderate
- Hot days now (above 93°F)
- 7 days/yr
- Hot days in 30 yrs
- 16 days/yr
Wind risk 8/10 · Major
- Chance of severe wind over 30 yrs
- 80.0%
Air-quality risk 4/10 · Minor
- Unhealthy air days now
- 4 days/yr
- Unhealthy air days in 30 yrs
- 5 days/yr
Risk factors via First Street. Map © Google.
Why this score? — see what drove the D grade
The composite is a weighted blend of 9 inputs, each scored 0–100. Each bar is that input's sub-score; the figure is the points it added to the 100-point composite (weight × sub-score).
- Cash flow +10.7/30.0
- ARV discount +9.8/15.0
- Schools +7.6/10.0
- Livability +4.2/5.0
- DSCR +3.1/10.0
- Rent growth +2.5/5.0
- Condition / age +2.5/5.0
- 1% rule +2.4/10.0
- Appreciation +0.0/10.0
$750,000
🖨 Deal sheet (PDF) 📄 Offer letter ✓ Due diligence
Listing remarks
Great opportunity to make this 3-bedroom, 2-bath home your own! Featuring a primary bedroom with private bath, updated bathroom, spacious living room, dining room, and eat-in kitchen. The family room with fireplace offers a warm and inviting space for relaxing or entertaining. Additional features include a two-car garage and a functional layout with plenty of potential. With a little updating and personal touch, this home can truly shine.
Key facts
- 0.46 acre lot
- 2 garage spots
- Built 1965
Property features AI
Exterior
- Parking: Driveway; 2-car garage
- Utilities: Electric service by PSEG; Public sewer (connected)
- Home design: Single family residence; Living area based on plans
- Construction: Frame construction
- Exterior features: Frame construction; Not waterfront
Interior
- Kitchen: Cooktop; Dishwasher; Refrigerator; Eat-in kitchen; Open kitchen; Pantry
- Bedrooms: Master bedroom on the main level
- Bathrooms: 2 full bathrooms
- Heating & cooling: Baseboard heating; No central cooling
- Interior features: First-floor bedroom and full bath; Eat-in kitchen; Formal dining room; High ceilings; Open floorplan with open kitchen; Pantry; Primary bathroom; Master bedroom on the main level; Wood-burning fireplace
- Laundry & utility: No basement
Neighborhood map
What this means for you Summary
Snapshot
- This is a 3-bed/2.0-bath single-family listed at $750k.
Deal economics
- At list price, monthly cash flow is $-361 ($-4k/yr) — negative.
- To cash-flow at today's rent, offer at most $686k (8.5% below list).
- To meet the 1% rule (rent ≥ 1% of price), the offer needs to be $557k (25.7% below list).
- Recommended offer: $557k (25.7% below list) — sets the bar for 1% rule.
- Cap rate 5.7% vs local median 3.3% in Stony Brook — top-decile yield for the area; either an underpriced asset or a hidden risk that comps aren't pricing in. Stress-test before assuming the spread holds.
Location & tenants
- Location reads 85/100 on livability (#29 in NY, #515 nationally) — a professional / high-income tenant draw. Strengths: crime A+, commute A+, employment A+; Watch: cost of living F.
- Three Village Central School District (suburban): math 81% / reading 83% proficiency, ranked #31 of 590 in NY (top 5%) — strong family-tenant draw, lease renewals of 3-5y typical; only 5% free/reduced lunch — higher-income household profile.
- Zoned schools: William Sidney Mount Elementary School (math 67% / reading 67%, grade B+, #525 of 2,108 statewide, top 27%, 511 students, 17% FRL); Robert Cushman Murphy Junior High School (math 67% / reading 77%, grade A, #76 of 729 statewide, top 11%, 667 students, 18% FRL); Ward Melville Senior High School (math 97% / reading 92%, grade A+, #117 of 1,100 statewide, top 11%, 1,507 students, 15% FRL).
- Market conditions: 86 active listings in the ZIP; 2 comparable units currently listed for rent nearby; high-income renter base; 1,366 units permitted in Suffolk County in 2024 (216 in 5+ unit buildings).
- This rent runs 39% of the median local income ($171k/yr) — at the standard rent-burdened threshold; future hikes will face affordability resistance.
Forward outlook
- Local home prices are declining (-3.0%/yr); year-one equity from $5k of loan paydown is wiped out by about $22k of value loss. Plan a longer hold.
- Suffolk County population projected to shrink 5% by 2050 — rents likely to lag national; underwrite the cash flow, not the appreciation.
Negotiation context
- It's been on market 31 days — a 3% lower offer ($728k) is reasonable based on typical stale-listing flexibility.
Risks & watch-outs
- Climate carrying-cost: severe wind risk, 80% chance of damaging wind over 30y; extreme-heat days projected 7→16/yr by 2055 (HVAC capex compounding) — expect insurance premiums to compound above CPI over the hold.
Questions for the listing agent
- What do current leases actually rent for vs. the listed asking? Can we see a recent rent roll and the last 12 months of T-12 income?
- It's been on market 31 days. Have you received any prior offers? Is the seller open to a 26% concession, seller financing, or rate buy-down credit?
- Built in 1965 — when were the roof, HVAC, electrical panel, plumbing, and water heater last replaced?
- Is there a deadline driving the sale (1031 exchange, divorce, estate, relocation)? That informs how much negotiation room exists.
- Schools are A-rated — typically a magnet for longer-tenancy family renters. What's the average tenant stay here, and is there a school-zone premium baked into asking?
- The area grade is low — what's the realistic commute time and amenity access for the typical tenant pool here? Any planned neighborhood developments (good or bad) we should know about?
- What's the average days-on-market for RENTAL listings here right now (not sales)? A rising rental-DOM trend means longer vacancies and softer asking-rent achievability than the comps imply.
- What's the recent tenant-quality profile in this submarket — average credit score on applications, eviction rate, late-payment / NSF rate, and stable-employment percentage? A property-management company in the area should have these aggregated.
- How much new for-sale + rental construction is in the pipeline within 1–3 miles? Heavy new supply typically softens prices + rents 12–24 months out; constrained supply supports both.
Investment metrics
- 1% rule
- 0.74% ✗
- Cap rate
- 5.71%
- Cash-on-cash
- -2.06%
- DSCR
- 0.91
- GRM
- 11.2
CMA / ARV
- ARV (median comp)
- $790,073
- List price
- $750,000
- Delta
- -5.07%
- Verdict
- FAIR
- Comps
- 20 within 1.0 mi
Show comp detail 12 sales within ~0.75 mi
| Address | Dist | Beds/Ba | Sqft | Sold | Price | $/sf | Match |
|---|---|---|---|---|---|---|---|
| 22 Ballad Ln | 0.30mi | 3/2.0 | 1,907 (+3%) | 4mo | $635,000 | $333 | 78 |
| 363 Oxhead Rd | 0.41mi | 3/2.0 | 1,900 (+2%) | 0mo | $660,000 | $347 | 77 |
| 3 Bowen Pl | 0.31mi | 3/2.5 | 1,908 (+3%) | 5mo | $721,500 | $378 | 75 |
| 16 Barnwell Ln | 0.23mi | 4/2.0 (+1) | 1,800 (-3%) | 8mo | $690,000 | $383 | 73 |
| 19 Barnwell Ln | 0.24mi | 4/2.5 (+1) | 1,980 (+7%) | 4mo | $735,000 | $371 | 67 |
| 10 Pickwick Ct | 0.40mi | 4/2.0 (+1) | 1,771 (-4%) | 4mo | $780,000 | $440 | 66 |
| 11 Pembrook Dr | 0.21mi | 3/2.5 | 2,100 (+13%) | 3mo | $900,000 | $429 | 64 |
| 37 Malvern Ln | 0.62mi | 4/2.5 (+1) | 1,887 (+2%) | 5mo | $810,000 | $429 | 57 |
| 30 Oak Run | 0.36mi | 2/2.5 (-1) | 1,587 (-14%) | 1mo | $810,000 | $510 | 52 |
| 404 Oxhead Rd | 0.54mi | 4/2.5 (+1) | 2,000 (+8%) | 6mo | $785,000 | $393 | 50 |
| 6 Freshman Ln | 0.64mi | 3/2.0 | 2,100 (+13%) | 3mo | $680,000 | $324 | 46 |
| 28 Hargrove Dr | 0.69mi | 3/2.0 | 1,621 (-13%) | 4mo | $630,000 | $389 | 43 |
Match score weights: distance 35% · size 25% · config 20% · recency 20%. Top-matched comps best support the ARV.
Projected returns pro-forma
-3.0% appreciation · 3.0% rent growth · sell at horizon
- IRR
- -19.8%
- Equity multiple
- 0.31×
- Total profit
- $-144,719
- Equity at exit
- $111,827
- IRR
- -12.7%
- Equity multiple
- 0.26×
- Total profit
- $-156,354
- Equity at exit
- $64,846
Cash invested: $210,000 (down + closing). Projections, not guarantees.
Landlord ↔ Tenant lean methodology
- Overall (STATE)
- 15 Strongly Tenant-Friendly
- State New York
- 15 Strongly Tenant-Friendly · D+10
- County
- — inherits STATE
- City
- — inherits STATE
ZIP-level market 11790
- Active inventory
- 86
- Price-to-rent
- 11.2×
Monthly cashflow live
- Estimated rent
- $5,574 medium interval (Pro) →
- Mortgage (P&I)
- −$3,933
- Tax from tax record
- −$520 /mo · $6,235/yr
- Insurance
- −$312
- HOA
- −$0
- Vacancy / Maint / Mgmt
- −$1,171
- Net cashflow
- $-361
Break-even live
Sensitivity live
| Price | -10% $63 | -5% $-149 | +0% $-361 | +5% $-574 | +10% $-786 |
|---|---|---|---|---|---|
| Rent | -10% $-802 | -5% $-582 | +0% $-361 | +5% $-141 | +10% $79 |
| Rate | -1.0pp $16 | -0.5pp $-171 | base $-361 | +0.5pp $-556 | +1.0pp $-753 |
UW: 25.0% down · 7.5% · 30yr · 1.5% tax · 5.0% vac · 8.0% maint · 8.0% mgmt
Financing live
Cash to close
- Down payment
- $187,500
- Closing costs
- $22,500
- Reserves months
- —
- Total cash needed
- —
Loan-product check · same deal, 3 products live
Conventional
25% down · 7.5% · 30yr
- Down + closing
- —
- Monthly P&I
- —
- Monthly cashflow
- —
- DSCR
- —
- Eligible?
- —
Personal DTI + credit; lowest rate.
DSCR
20% down · 8.5% · 30yr
- Down + closing
- —
- Monthly P&I
- —
- Monthly cashflow
- —
- DSCR
- —
- Eligible?
- —
No personal income docs; deal must DSCR.
Hard money
10% down · 12.0% · 12mo
- Down + closing
- —
- Monthly P&I
- —
- Monthly cashflow
- —
- DSCR
- —
- Eligible?
- —
Short-term bridge; refi at stabilization.
Rent comps 2 comps
| Address | Beds | Baths | Sqft | Rent | $/sqft | DOM | Units | Dist |
|---|---|---|---|---|---|---|---|---|
| 103 Sunflower Ridge Rd South Setauket, NY | 3.0 | 4.0 | 2274 | $5,000 | $2.20 | 0d | 1 | 1.00mi |
| 63 Sunflower Ridge Rd South Setauket, NY | 4.0 | 2.5 | 2479 | $5,300 | $2.14 | 26d | 1 | 1.16mi |
Listing history 10 events
-
2026-06-13statusdays on market $750,000 Pending 31 DOM
-
2026-06-09days on market $750,000 Active 28 DOM
-
2026-06-08days on market $750,000 Active 27 DOM
-
2026-06-07days on market $750,000 Active 26 DOM
-
2026-06-04days on market $750,000 Active 23 DOM
-
2026-06-03days on market $750,000 Active 22 DOM
-
2026-06-02pricedays on market $750,000 Active 21 DOM
-
2026-06-01days on market $770,000 Active 20 DOM
-
2026-05-31days on market $770,000 Active 19 DOM
-
2026-05-11$770,000 Active 442-char remark
ⓘ Source: listings_history table (triggers on properties + properties_extension) + one-shot
backfill from property_details.listing_events for pre-trigger history.
Tax reassessment forecast NY · Partial reset (capped growth)
- Current annual tax
- $6,235 · $520/mo
- Projected year-2 tax
- $9,455 · $788/mo
- Expected delta
- +$3,220/yr (+$268/mo · 51.6%)
ⓘ Screening estimate from a state-policy table — verify with the county assessor before closing.
Climate risk First Street
- Flood 1/10 Low FEMA zone X (unshaded) · 0% chance over 30 yrs
- Wildfire 1/10 Low
- Heat 5/10 Major 7 d/yr ≥93°F today · 16 d/yr by 30 yrs out
- Wind 8/10 Severe 80% chance of damaging wind over 30 yrs
- Air quality 4/10 Moderate 4 unhealthy d/yr today · 5 by 30 yrs out
Nearby sold comps map
Loading sold comps map…
Walkable amenities ~0.75 mi
Loading nearby amenities…
Taxation est. · year 1
- Rental income
- $66,894
- − Mortgage interest
- −$42,012
- − Property taxes
- −$6,235
- − Insurance
- −$3,750
- − Repairs & maintenance
- −$5,352
- − Management
- −$5,352
- − Depreciation
- −$21,818
- Taxable loss
- −$17,624
- Est. tax savings @ 24.0%
- +$4,230
- After-tax cash flow
- $-106/yr
For passive investors: Depreciation is non-cash, so a rental often shows a tax loss while cash-flowing — sheltering income. Rental losses are passive: they offset passive income freely, and up to $25,000/yr can offset ordinary (W-2) income if you actively participate and your MAGI is under $100k (phasing out to $0 by $150k); unused losses carry forward. On sale, claimed depreciation is recaptured at up to 25%, and gains may owe capital-gains tax (a 1031 exchange can defer both). Figures are a year-1 estimate at your 24.0% rate — not tax advice; consult a CPA.
Schools (NCES district)
- District
- Three Village Central School District
- NCES district ID
- 3628200
- Math proficiency
- 81% ▼ -6.00%
- Reading proficiency
- 83% ▲ 2.00%
- Median HH income
- $121,671
- Composite
- 76.17/100
- National rank
- #113
- State rank
- #31 of 590 in NY
Livability — Stony Brook
- Score
- 85/100
- State rank
- #29
- US rank
- #515
Category grades
Schools grade is shown separately in the Schools card above.
Census & demographics
- Census place
- Stony Brook, NY
- County
- Suffolk County · 679,920 people
- City population
- 21,074
- Metro
- New York-Newark-Jersey City, NY-NJ-PA
- Population (ZIP)
- 21,074
- Household income
- $171,133
- Rent vs Own
- Severe rent burden
- 40.0
Population outlook (Suffolk County) Hauer SSP2
- Today (2025)
- 1,505,262 people
- By 2030
- 1,498,318 · -0.5%
- By 2040
- 1,471,101 · -2.3%
- By 2050
- 1,424,848 · -5.3%
- By 2075
- 1,337,157 · -11.2%
- By 2100
- 1,217,720 · -19.1%
Race, ethnicity, and origin ACS 2023
- Neighborhood character
- Diverse neighborhood (Simpson 0.57)
- Race & ethnicity
- White 60% Asian 25% Hispanic / Latino 9% Black 4% Two or more races 4%
- Hispanic origin (detail)
- Puerto Rican 2%
- Common ancestry
- Romanian 5% Scotch-Irish 2% Russian 1%
- Foreign-born
- 18% · China, Canada, South Korea
- Languages at home
- 68% English-only · Chinese 13% Other Indo-European 6% Spanish 5%
Political lean MEDSL · Suffolk
- 2024 margin
- Lean R (+10.0) · D 45.0% · R 55.0%
- 2008→2024 swing
- -16.0pp toward R · 2008: 6.0pp · 2024: -10.0pp
- All cycles
- 2024: R+10.0 2020: R+0.0 2016: R+8.2 2012: D+2.9 2008: D+6.0
Not yet ingested
- Civics
- —
Market trends
- HPI YoY
- ▼ -662.88%
- Current HPI
- 284.601
- Rent YoY
- —
- Metro
- New York-Newark-Jersey City, NY-NJ-PA
- State GDP YoY
- ▲ 2.60%
- F500 in state
- 92
Industry mix (Fortune 500 HQ in NY)
| Industry | F500 HQs | Revenue |
|---|---|---|
| Financial Services | 10 | $950B |
|
||
| Consumer Goods | 9 | $162B |
|
||
| Insurance | 4 | $225B |
|
||
| Telecommunications | 2 | $144B |
|
||
| Pharmaceuticals | 2 | $112B |
|
||
| Media / Entertainment | 2 | $69B |
|
||
Price history
-2.6% since first listed3 events — show timeline
- 2026-06-12 Pending — OneKey® MLS as Distributed by MLS Grid
- 2026-06-02 Price Changed $750,000 OneKey® MLS as Distributed by MLS Grid
- 2026-05-11 Listed $770,000 OneKey® MLS as Distributed by MLS Grid
Property tax history
-2.6%/yrLatest (2025): $6,235 · +0.0% YoY. Source: county tax records.
Cash-flow waterfall
monthlySold comps — $/sqft
last 12 mo · ≤1 miLoading sold comps…