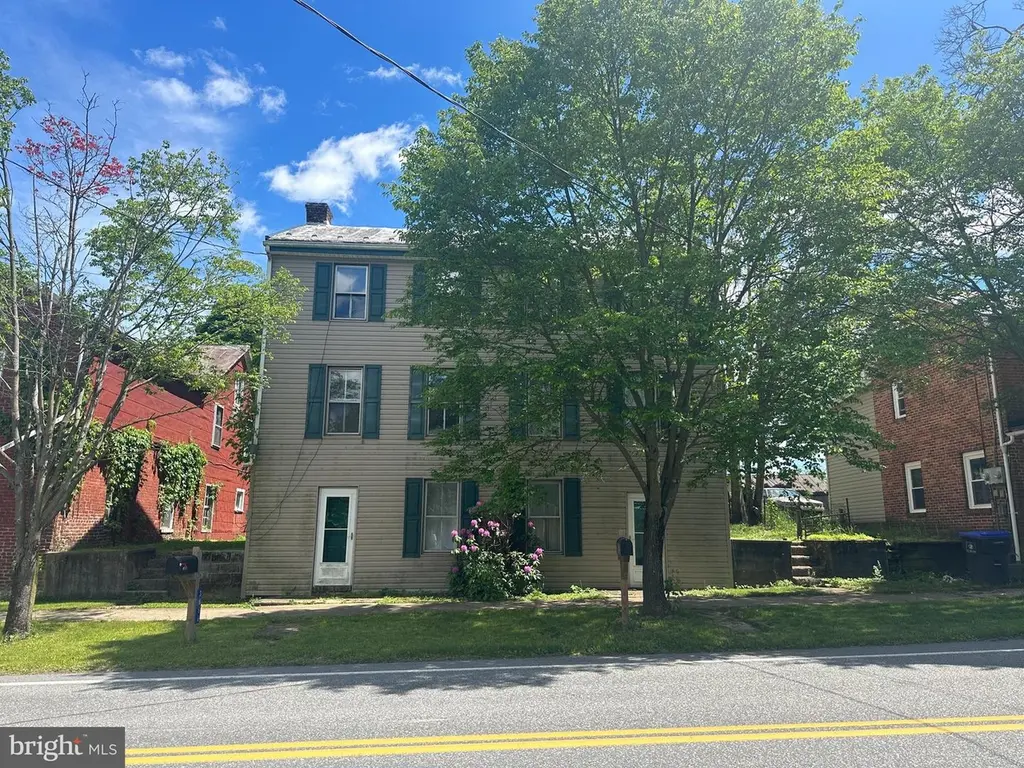
3666 Orrstown Rd · Orrstown, PA
Flood risk 1/10 · Minimal
- FEMA flood zone
- X (unshaded)
- Chance of flooding over 30 yrs
- 0.0%
- Est. flood insurance / yr
- $507 – $1,088
Fire risk 1/10 · Minimal
- Est. fire insurance / yr
- $511 – $949
Heat risk 4/10 · Minor
- Hot days now (above 100°F)
- 7 days/yr
- Hot days in 30 yrs
- 15 days/yr
Wind risk 2/10 · Minimal
- Chance of severe wind over 30 yrs
- 3.0%
Air-quality risk 2/10 · Minimal
- Unhealthy air days now
- 1 days/yr
- Unhealthy air days in 30 yrs
- 1 days/yr
Risk factors via First Street. Map © Google.
Why this score? — see what drove the C+ grade
The composite is a weighted blend of 9 inputs, each scored 0–100. Each bar is that input's sub-score; the figure is the points it added to the 100-point composite (weight × sub-score).
- Cash flow +22.2/30.0
- ARV discount +7.5/15.0
- Appreciation +7.2/10.0
- DSCR +7.1/10.0
- 1% rule +4.8/10.0
- Schools +3.5/10.0
- Livability +3.0/5.0
- Rent growth +2.5/5.0
- Condition / age +2.5/5.0
$145,000
🖨 Deal sheet 📄 Offer letter ✓ Due diligence
Listing remarks MLS
Great investment property, side by side Duplex each side offers 3 bedrooms, dining room, full bath, kitchen and many updates, why rent, live in one side, rent the other, great price,
Key facts
- Built 1900
- Listed 21 days
Property features AI
Exterior
- Parking: Off-street parking
- Utilities: Public water; Public sewer; Electric hot water
- Home design: Semi-detached home; Fee simple ownership; Estimated year built
- Construction: Vinyl siding; Permanent foundation
- Exterior features: Partially finished walkout basement with connecting stairway and front entrance; Shed on the property; No tidal water
Interior
- Bedrooms: 2 bedrooms on the upper level
- Flooring: Carpet flooring
- Bathrooms: 1 full bathroom
- Heating & cooling: Hot water heat; Oil-fired heating
- Interior features: Ceiling fan(s); Dining area; Tub with shower
Neighborhood map
What this means for you Summary
Snapshot
- This is a 2-bed/1.0-bath other listed at $145k.
Deal economics
- At list price, monthly cash flow is $237 ($3k/yr) — positive.
- The deal already cash-flows at list — no discount required.
- To meet the 1% rule (rent ≥ 1% of price), the offer needs to be $142k (2.0% below list).
- Recommended offer: $142k (2.0% below list) — sets the bar for 1% rule.
Location & tenants
- Location reads 60/100 on livability (#1,493 in PA) — a middle-class / working-renter tenant base. Strengths: cost of living A+, housing A; Watch: employment C-, schools F, amenities F.
- Shippensburg Area SD (town): math 31% / reading 52% proficiency, ranked #335 of 539 in PA (top 62%) — families likely to look elsewhere, expect single-tenant / working-renter base with shorter leases.
- Market conditions: 9 active listings in the ZIP; 633 units permitted in Franklin County in 2024 (112 in 5+ unit buildings).
Forward outlook
- In year one you build about $7k of equity ($1k loan paydown + $6k appreciation (4.3% local appreciation)).
- At projected returns (4.3% appreciation + 3.0% rent growth), your $41k cash investment doubles in ~4 years — after that, you're playing with house money.
- By year 5, paydown + projected appreciation supports a ~$31k cash-out refi (75% LTV) — recoverable capital for the next deal without selling this one.
Negotiation context
- It's been on market 21 days — a 2% lower offer ($143k) is reasonable based on typical stale-listing flexibility.
- 7 sale attempts since 16y ago with the ask held roughly flat each time — persistent listings suggest the price (not the market) is what's stuck; bring a comps-based counter.
- Current owner paid $88k; list at $145k implies a 65% gain — meaningful room to come down on a strong offer.
Risks & watch-outs
- Watch-outs: built in 1900 — expect roof / HVAC / electrical / plumbing capex.
Questions for the listing agent
- Built in 1900 — when were the roof, HVAC, electrical panel, plumbing, and water heater last replaced?
- Is there a deadline driving the sale (1031 exchange, divorce, estate, relocation)? That informs how much negotiation room exists.
- Schools are F-rated, which usually means shorter tenancies and higher turnover. Who's the typical renter profile here, and what's been the actual vacancy rate?
- What's the average days-on-market for RENTAL listings here right now (not sales)? A rising rental-DOM trend means longer vacancies and softer asking-rent achievability than the comps imply.
- What's the recent tenant-quality profile in this submarket — average credit score on applications, eviction rate, late-payment / NSF rate, and stable-employment percentage? A property-management company in the area should have these aggregated.
- How much new for-sale + rental construction is in the pipeline within 1–3 miles? Heavy new supply typically softens prices + rents 12–24 months out; constrained supply supports both.
Investment metrics
- 1% rule
- 0.98% ✗
- Cap rate
- 8.26%
- Cash-on-cash
- 7.01%
- DSCR
- 1.31
- GRM
- 8.5
CMA / ARV
No comps found within radius.
Projected returns pro-forma
4.31% appreciation · 3.0% rent growth · sell at horizon
- IRR
- 17.3%
- Equity multiple
- 2.06×
- Total profit
- $42,839
- Equity at exit
- $76,162
- IRR
- 17.8%
- Equity multiple
- 3.94×
- Total profit
- $119,259
- Equity at exit
- $126,728
Cash invested: $40,600 (down + closing). Projections, not guarantees.
Landlord ↔ Tenant lean methodology
- Overall (STATE)
- 62 Landlord-Friendly
- State Pennsylvania
- 62 Landlord-Friendly · EVEN
- County
- — inherits STATE
- City
- — inherits STATE
ZIP-level market 17244
- Home prices YoY
- 1.4%
- Active inventory
- 9
- Price-to-rent
- 8.5×
Monthly cashflow live
- Estimated rent
- $1,421 medium interval (Pro) →
- Mortgage (P&I)
- −$760
- Tax from tax record
- −$65 /mo · $776/yr
- Insurance
- −$60
- HOA
- −$0
- Vacancy / Maint / Mgmt
- −$298
- Net cashflow
- $237
Break-even live
UW: 25.0% down · 7.5% · 30yr · 1.5% tax · 5.0% vac · 8.0% maint · 8.0% mgmt
Financing live
Cash to close
- Down payment
- $36,250
- Closing costs
- $4,350
- Reserves months
- —
- Total cash needed
- —
Loan-product check · same deal, 3 products live
Conventional
25% down · 7.5% · 30yr
- Down + closing
- —
- Monthly P&I
- —
- Monthly cashflow
- —
- DSCR
- —
- Eligible?
- —
Personal DTI + credit; lowest rate.
DSCR
20% down · 8.5% · 30yr
- Down + closing
- —
- Monthly P&I
- —
- Monthly cashflow
- —
- DSCR
- —
- Eligible?
- —
No personal income docs; deal must DSCR.
Hard money
10% down · 12.0% · 12mo
- Down + closing
- —
- Monthly P&I
- —
- Monthly cashflow
- —
- DSCR
- —
- Eligible?
- —
Short-term bridge; refi at stabilization.
Listing history 32 events
-
2026-06-18days on market $145,000 Active 21 DOM
-
2026-06-17days on market $145,000 Active 20 DOM
-
2026-06-16days on market $145,000 Active 19 DOM
-
2026-06-15days on market $145,000 Active 18 DOM
-
2026-06-14days on market $145,000 Active 16 DOM
-
2026-06-13days on market $145,000 Active 15 DOM
-
2026-06-10days on market $145,000 Active 13 DOM
-
2026-06-09days on market $145,000 Active 12 DOM
-
2026-06-08days on market $145,000 Active 11 DOM
-
2026-06-07days on market $145,000 Active 10 DOM
-
2026-06-03days on market $145,000 Active 6 DOM
-
2026-06-02days on market $145,000 Active 5 DOM
-
2026-06-01days on market $145,000 Active 4 DOM
-
2026-05-31days on market $145,000 Active 3 DOM
-
2026-05-31days on market $145,000 Active 2 DOM
-
2026-05-16historical $145,000 722-char remark
-
2026-03-17soldstatus $88,000
-
2013-06-04soldstatus $86,750
-
2013-05-31soldstatus $86,750 182-char remark
Show marketing remark (182 chars)
Great investment property, side by side Duplex each side offers 3 bedrooms, dining room, full bath, kitchen and many updates, why rent, live in one side, rent the other, great price,
-
2013-05-31soldstatus $86,750
Show marketing remark (182 chars)
Great investment property, side by side Duplex each side offers 3 bedrooms, dining room, full bath, kitchen and many updates, why rent, live in one side, rent the other, great price,
-
2013-04-23historical 182-char remark
Show marketing remark (182 chars)
Great investment property, side by side Duplex each side offers 3 bedrooms, dining room, full bath, kitchen and many updates, why rent, live in one side, rent the other, great price,
-
2013-04-23historical
Show marketing remark (182 chars)
Great investment property, side by side Duplex each side offers 3 bedrooms, dining room, full bath, kitchen and many updates, why rent, live in one side, rent the other, great price,
-
2012-10-29$92,500 182-char remark
Show marketing remark (182 chars)
Great investment property, side by side Duplex each side offers 3 bedrooms, dining room, full bath, kitchen and many updates, why rent, live in one side, rent the other, great price,
-
2012-10-29$92,500
Show marketing remark (182 chars)
Great investment property, side by side Duplex each side offers 3 bedrooms, dining room, full bath, kitchen and many updates, why rent, live in one side, rent the other, great price,
-
2012-02-16historical
-
2012-02-16historical
-
2011-08-17$97,900
-
2011-08-17
-
2011-08-02historical
-
2011-08-02historical
-
2010-08-03
-
2010-08-03$99,000
ⓘ Source: listings_history table (triggers on properties + properties_extension) + one-shot
backfill from property_details.listing_events for pre-trigger history.
Tax reassessment forecast PA · Partial reset (capped growth)
- Current annual tax
- $776 · $65/mo
- Projected year-2 tax
- $1,533 · $128/mo
- Expected delta
- +$758/yr (+$63/mo · 97.7%)
ⓘ Screening estimate from a state-policy table — verify with the county assessor before closing.
Climate risk First Street
- Flood 1/10 Low FEMA zone X (unshaded) · 0% chance over 30 yrs
- Wildfire 1/10 Low
- Heat 4/10 Moderate 7 d/yr ≥100°F today · 15 d/yr by 30 yrs out
- Wind 2/10 Low 3% chance of damaging wind over 30 yrs
- Air quality 2/10 Low 1 unhealthy d/yr today · 1 by 30 yrs out
Nearby sold comps map
Loading sold comps map…
Walkable amenities ~0.75 mi
Loading nearby amenities…
Taxation est. · year 1
- Rental income
- $17,055
- − Mortgage interest
- −$8,122
- − Property taxes
- −$776
- − Insurance
- −$725
- − Repairs & maintenance
- −$1,364
- − Management
- −$1,364
- − Depreciation
- −$4,218
- Taxable income
- $485
- Est. tax owed @ 24.0%
- −$116
- After-tax cash flow
- $2,732/yr
For passive investors: Depreciation is non-cash, so a rental often shows a tax loss while cash-flowing — sheltering income. Rental losses are passive: they offset passive income freely, and up to $25,000/yr can offset ordinary (W-2) income if you actively participate and your MAGI is under $100k (phasing out to $0 by $150k); unused losses carry forward. On sale, claimed depreciation is recaptured at up to 25%, and gains may owe capital-gains tax (a 1031 exchange can defer both). Figures are a year-1 estimate at your 24.0% rate — not tax advice; consult a CPA.
Schools (NCES district)
- District
- Shippensburg Area SD
- NCES district ID
- 4221570
- Math proficiency
- 31% ▼ -21.00%
- Reading proficiency
- 52% ▼ -14.00%
- Median HH income
- $47,585
- Composite
- 35.42/100
- National rank
- #4938
- State rank
- #335 of 539 in PA
Livability — Orrstown
- Score
- 60/100
- State rank
- #1493
- US rank
- #19353
Category grades
Schools grade is shown separately in the Schools card above.
Census & demographics
- Census place
- Orrstown, PA
- Population (ZIP)
- 2,305
Population outlook (Franklin County) Hauer SSP2
- Today (2025)
- 157,827 people
- By 2030
- 158,933 · +0.7%
- By 2040
- 159,060 · +0.8%
- By 2050
- 155,132 · -1.7%
- By 2075
- 138,545 · -12.2%
- By 2100
- 112,321 · -28.8%
Race, ethnicity, and origin ACS 2023
- Neighborhood character
- Predominantly White (93%)
- Race & ethnicity
- White 93% Two or more races 2%
- Common ancestry
- Slovak 1% Romanian 1% Estonian 1%
- Foreign-born
- 0% · Canada
- Languages at home
- 81% English-only · German/W. Germanic 18% Other Indo-European 1%
Political lean MEDSL · Franklin
- 2024 margin
- Solid R (+43.0) · D 28.1% · R 71.1%
- 2008→2024 swing
- -10.4pp toward R · 2008: -32.6pp · 2024: -43.0pp
- All cycles
- 2024: R+43.0 2020: R+43.1 2016: R+46.5 2012: R+38.5 2008: R+32.6
Not yet ingested
- Civics
- —
Market trends
- HPI YoY
- ▲ 4.31%
- Current HPI
- 322.3009
- Rent YoY
- —
- Metro
- —
- State GDP YoY
- ▲ 1.68%
- F500 in state
- 34
Industry mix (Fortune 500 HQ in PA)
| Industry | F500 HQs | Revenue |
|---|---|---|
| Healthcare | 2 | $309B |
|
||
| Insurance | 2 | $27B |
|
||
| Telecommunications / Media | 1 | $124B |
|
||
| Industrial Distribution | 1 | $22B |
|
||
| Financial Services | 1 | $20B |
|
||
| Chemicals / Materials | 1 | $18B |
|
||
Price history
+46.5% since first listed18 events — show timeline
- 2026-05-29 Listed $145,000 BRIGHT MLS
- 2026-05-16 Coming Soon $145,000 BRIGHT MLS
- 2026-03-17 Sold (Public Records) $88,000 Public Records
- 2013-06-04 Sold (Public Records) $86,750 Public Records
- 2013-05-31 Sold (MLS) $86,750 BRIGHT MLS
- 2013-05-31 Sold (MLS) $86,750 MRIS
- 2013-04-23 Listing Removed — BRIGHT MLS
- 2013-04-23 Delisted — MRIS
- 2012-10-29 Listed $92,500 BRIGHT MLS
- 2012-10-29 Listed $92,500 MRIS
- 2012-02-16 Delisted — MRIS
- 2012-02-16 Listing Removed — BRIGHT MLS
- 2011-08-17 Listed — MRIS
- 2011-08-17 Listed $97,900 BRIGHT MLS
- 2011-08-02 Delisted — MRIS
- 2011-08-02 Listing Removed — BRIGHT MLS
- 2010-08-03 Listed — MRIS
- 2010-08-03 Listed $99,000 BRIGHT MLS
Property tax history
+15.2%/yrLatest (2026): $776 · +3.2% YoY. Source: county tax records.
Cash-flow waterfall
monthlySold comps — $/sqft
last 12 mo · ≤1 miLoading sold comps…