212 Town Branch Rd · Manchester, KY
Flood risk 10/10 · Severe
- FEMA flood zone
- X (unshaded)
- Chance of flooding over 30 yrs
- 0.99%
- Est. flood insurance / yr
- $507 – $1,088
Fire risk 7/10 · Major
- Est. fire insurance / yr
- $839 – $1,559
Heat risk 4/10 · Minor
- Hot days now (above 100°F)
- 7 days/yr
- Hot days in 30 yrs
- 20 days/yr
Wind risk 2/10 · Minimal
- Chance of severe wind over 30 yrs
- 3.0%
Air-quality risk 2/10 · Minimal
- Unhealthy air days now
- 1 days/yr
- Unhealthy air days in 30 yrs
- 1 days/yr
Risk factors via First Street. Map © Google.
Why this score? — see what drove the D+ grade
The composite is a weighted blend of 9 inputs, each scored 0–100. Each bar is that input's sub-score; the figure is the points it added to the 100-point composite (weight × sub-score).
- Cash flow +11.1/30.0
- ARV discount +10.8/15.0
- Appreciation +10.0/10.0
- DSCR +3.2/10.0
- Livability +3.2/5.0
- Rent growth +2.5/5.0
- Condition / age +2.5/5.0
- 1% rule +2.3/10.0
- Schools +2.3/10.0
$170,000
🖨 Deal sheet (PDF) 📄 Offer letter ✓ Due diligence
Listing remarks
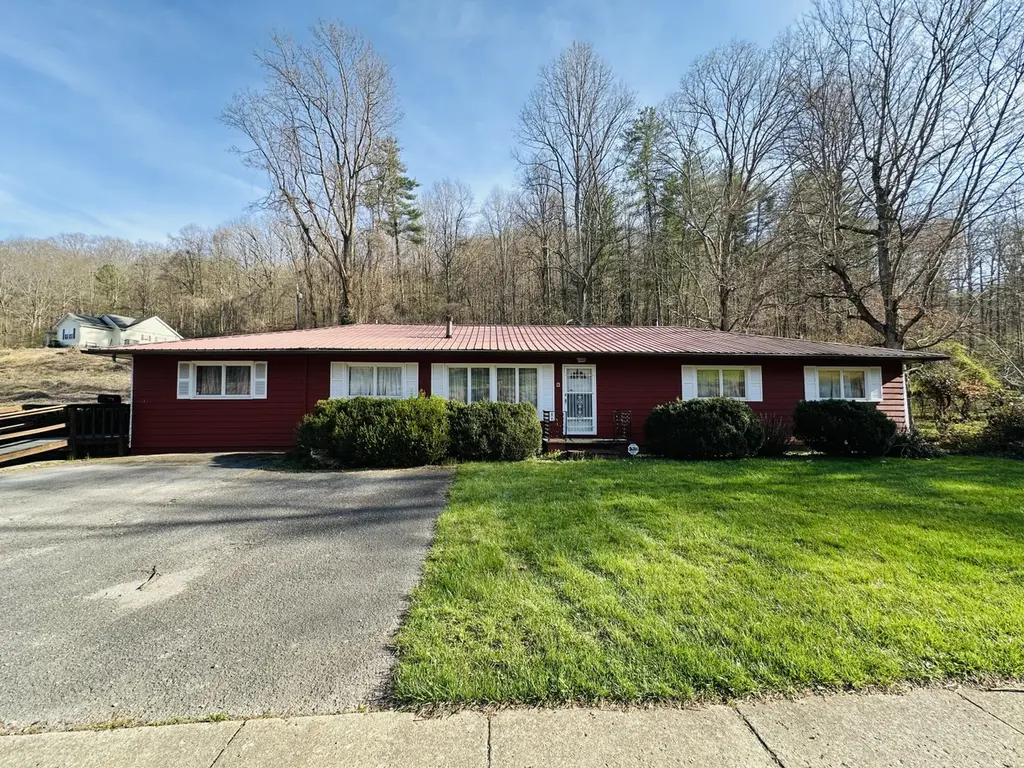
This charming 4 bed, 3 bath retro ranch home blends classic character with everyday functionality, all conveniently located within city limits. From the moment you arrive, you'll appreciate the home's timeless low-profile design, clean lines, and welcoming curb appeal. Inside, the layout offers a spacious, single-level living experience with a nod to vintage style—think warm wood accents, large picture windows, and a cozy yet open flow between living, dining, and kitchen areas. The kitchen maintains its retro charm while providing ample cabinet space and room for gathering, making it both stylish and practical. The primary suite features its own private bath, while three additional be
Key facts
- Vintage charm
- Urban homesteading
- Outdoor versatility
Tags
Property features AI
Finance
- Other: Lot about 0.875 acre (public records)
Exterior
- Parking: Driveway
- Utilities: Public water; Public sewer
- Home design: One-story house
- Construction: Wood siding construction; Block foundation; Metal roof; Built area approximately 2,384
- Exterior features: Chain link fencing; Other outbuildings/structures
Interior
- Flooring: Carpet; Ceramic tile; Laminate
- Bathrooms: 3 full bathrooms
- Heating & cooling: Natural gas heating; Electric cooling
- Interior features: Accessible entrance; Fireplace
Neighborhood map
What this means for you Summary
Snapshot
- This is a 3-bed/1.0-bath single-family listed at $170k.
Deal economics
- At list price, monthly cash flow is $-135 ($-2k/yr) — negative.
- To cash-flow at today's rent, offer at most $146k (14.0% below list).
- To meet the 1% rule (rent ≥ 1% of price), the offer needs to be $124k (27.0% below list).
- Recommended offer: $124k (27.0% below list) — sets the bar for 1% rule.
- Cap rate 5.8% vs local median 2.6% in Manchester — top-decile yield for the area; either an underpriced asset or a hidden risk that comps aren't pricing in. Stress-test before assuming the spread holds.
Location & tenants
- Location reads 64/100 on livability (#299 in KY) — a middle-class / working-renter tenant base. Strengths: cost of living A+, crime A-, health & safety A-; Watch: amenities F, commute F, employment F.
- Clay County (rural): math 21% / reading 37% proficiency, ranked #130 of 165 in KY (top 79%) — low school quality limits family demand, transient renter base, plan for 1-2y turnover; 66% free/reduced lunch — lower-income household profile, screen leases tightly.
- Zoned schools: Manchester Elementary School (math 36% / reading 40%, grade F, #242 of 676 statewide, top 37%, 388 students, 71% FRL); Clay County Middle School (math 21% / reading 38%, grade F, #151 of 217 statewide, top 71%, 407 students, 74% FRL); Clay County High School (math 17% / reading 27%, grade F, #202 of 254 statewide, top 82%, 717 students, 70% FRL).
- Market conditions: 85 active listings in the ZIP.
Forward outlook
- In year one you build about $18k of equity ($1k loan paydown + $17k appreciation (10.0% local appreciation)).
- Clay County population projected at -21% by 2050 — secular population decline; favor cash flow + early exit over multi-decade hold.
- By year 3, paydown + projected appreciation supports a ~$46k cash-out refi (75% LTV) — recoverable capital for the next deal without selling this one.
Negotiation context
- It's been on market 96 days — a 9% lower offer ($155k) is reasonable based on typical stale-listing flexibility.
Risks & watch-outs
- Watch-outs: flood insurance adds $66/mo.
- Climate carrying-cost: severe flood risk; major wildfire risk — expect insurance premiums to compound above CPI over the hold.
Questions for the listing agent
- What do current leases actually rent for vs. the listed asking? Can we see a recent rent roll and the last 12 months of T-12 income?
- It's been on market 96 days. Have you received any prior offers? Is the seller open to a 27% concession, seller financing, or rate buy-down credit?
- Built in 1961 — when were the roof, HVAC, electrical panel, plumbing, and water heater last replaced?
- What's the actual annual flood-insurance premium (NFIP or private), and is the property in a SFHA with mandatory coverage?
- Why hasn't it sold? Are there any deal-killer items the seller is aware of (foundation, flood, title, zoning, code violations)?
- Is there a deadline driving the sale (1031 exchange, divorce, estate, relocation)? That informs how much negotiation room exists.
- Schools are D-rated, which usually means shorter tenancies and higher turnover. Who's the typical renter profile here, and what's been the actual vacancy rate?
- The area grade is low — what's the realistic commute time and amenity access for the typical tenant pool here? Any planned neighborhood developments (good or bad) we should know about?
- What's the average days-on-market for RENTAL listings here right now (not sales)? A rising rental-DOM trend means longer vacancies and softer asking-rent achievability than the comps imply.
- What's the recent tenant-quality profile in this submarket — average credit score on applications, eviction rate, late-payment / NSF rate, and stable-employment percentage? A property-management company in the area should have these aggregated.
- How much new for-sale + rental construction is in the pipeline within 1–3 miles? Heavy new supply typically softens prices + rents 12–24 months out; constrained supply supports both.
Investment metrics
- 1% rule
- 0.73% ✗
- Cap rate
- 5.81%
- Cash-on-cash
- -1.73%
- DSCR
- 0.92
- GRM
- 11.4
CMA / ARV
- ARV (on-the-fly)
- $183,568
- Comps found
- 3
Show comp detail 3 sales within ~0.75 mi
| Address | Dist | Beds/Ba | Sqft | Sold | Price | $/sf | Match |
|---|---|---|---|---|---|---|---|
| 102 Locust St | 0.60mi | 3/2.0 | 2,200 (-8%) | 6mo | $262,000 | $119 | 50 |
| 307 River St | 0.68mi | 4/2.0 (+1) | 2,155 (-10%) | 5mo | $165,000 | $77 | 39 |
| 129 Hensley Lane Ln | 0.61mi | 4/2.0 (+1) | 2,120 (-11%) | 15mo | $160,000 | $75 | 32 |
Match score weights: distance 35% · size 25% · config 20% · recency 20%. Top-matched comps best support the ARV.
Projected returns pro-forma
10.0% appreciation · 3.0% rent growth · sell at horizon
- IRR
- 21.8%
- Equity multiple
- 2.76×
- Total profit
- $83,960
- Equity at exit
- $153,149
- IRR
- 19.7%
- Equity multiple
- 6.34×
- Total profit
- $253,982
- Equity at exit
- $330,273
Cash invested: $47,600 (down + closing). Projections, not guarantees.
Landlord ↔ Tenant lean methodology
- Overall (STATE)
- 83 Strongly Landlord-Friendly
- State Kentucky
- 83 Strongly Landlord-Friendly · R+16
- County
- — inherits STATE
- City
- — inherits STATE
ZIP-level market 40962
- Home prices YoY
- 21.0%
- Active inventory
- 85
- Price-to-rent
- 11.4×
Monthly cashflow live
- Estimated rent
- $1,241 medium interval (Pro) →
- Mortgage (P&I)
- −$891
- Tax from tax record
- −$87 /mo · $1,039/yr
- Insurance
- −$71
- Flood insurance flood zone
- −$66 /mo · $798/yr
- HOA
- −$0
- Vacancy / Maint / Mgmt
- −$261
- Net cashflow
- $-135
Break-even live
Sensitivity live
| Price | -10% $-39 | -5% $-87 | +0% $-135 | +5% $-183 | +10% $-231 |
|---|---|---|---|---|---|
| Rent | -10% $-233 | -5% $-184 | +0% $-135 | +5% $-86 | +10% $-37 |
| Rate | -1.0pp $-50 | -0.5pp $-92 | base $-135 | +0.5pp $-179 | +1.0pp $-224 |
UW: 25.0% down · 7.5% · 30yr · 1.5% tax · 5.0% vac · 8.0% maint · 8.0% mgmt
Financing live
Cash to close
- Down payment
- $42,500
- Closing costs
- $5,100
- Reserves months
- —
- Total cash needed
- —
Loan-product check · same deal, 3 products live
Conventional
25% down · 7.5% · 30yr
- Down + closing
- —
- Monthly P&I
- —
- Monthly cashflow
- —
- DSCR
- —
- Eligible?
- —
Personal DTI + credit; lowest rate.
DSCR
20% down · 8.5% · 30yr
- Down + closing
- —
- Monthly P&I
- —
- Monthly cashflow
- —
- DSCR
- —
- Eligible?
- —
No personal income docs; deal must DSCR.
Hard money
10% down · 12.0% · 12mo
- Down + closing
- —
- Monthly P&I
- —
- Monthly cashflow
- —
- DSCR
- —
- Eligible?
- —
Short-term bridge; refi at stabilization.
Listing history 20 events
-
2026-06-22days on market $170,000 Active 96 DOM
-
2026-06-21days on market $170,000 Active 95 DOM
-
2026-06-21days on market $170,000 Active 94 DOM
-
2026-06-18days on market $170,000 Active 92 DOM
-
2026-06-17days on market $170,000 Active 91 DOM
-
2026-06-16days on market $170,000 Active 90 DOM
-
2026-06-15days on market $170,000 Active 89 DOM
-
2026-06-13days on market $170,000 Active 87 DOM
-
2026-06-12days on market $170,000 Active 86 DOM
-
2026-06-09days on market $170,000 Active 83 DOM
-
2026-06-08days on market $170,000 Active 82 DOM
-
2026-06-07days on market $170,000 Active 81 DOM
-
2026-06-07days on market $170,000 Active 80 DOM
-
2026-06-04days on market $170,000 Active 77 DOM
-
2026-06-02days on market $170,000 Active 76 DOM
-
2026-06-01days on market $170,000 Active 75 DOM
-
2026-05-31days on market $170,000 Active 74 DOM
-
2026-05-31days on market $170,000 Active 73 DOM
-
2026-04-06price $170,000
-
2026-03-17$180,000 Active
ⓘ Source: listings_history table (triggers on properties + properties_extension) + one-shot
backfill from property_details.listing_events for pre-trigger history.
Tax reassessment forecast KY · Resets to sale price
- Current annual tax
- $1,039 · $87/mo
- Projected year-2 tax
- $1,462 · $122/mo
- Expected delta
- +$423/yr (+$35/mo · 40.7%)
ⓘ Screening estimate from a state-policy table — verify with the county assessor before closing.
Climate risk First Street
- Flood 10/10 Extreme FEMA zone X (unshaded) · 99% chance over 30 yrs
- Wildfire 7/10 Severe
- Heat 4/10 Moderate 7 d/yr ≥100°F today · 20 d/yr by 30 yrs out
- Wind 2/10 Low 3% chance of damaging wind over 30 yrs
- Air quality 2/10 Low 1 unhealthy d/yr today · 1 by 30 yrs out
Nearby sold comps map
Loading sold comps map…
Walkable amenities ~0.75 mi
Loading nearby amenities…
Taxation est. · year 1
- Rental income
- $14,889
- − Mortgage interest
- −$9,523
- − Property taxes
- −$1,039
- − Insurance
- −$1,648
- − Repairs & maintenance
- −$1,191
- − Management
- −$1,191
- − Depreciation
- −$4,945
- Taxable loss
- −$4,648
- Est. tax savings @ 24.0%
- +$1,115
- After-tax cash flow
- $-507/yr
For passive investors: Depreciation is non-cash, so a rental often shows a tax loss while cash-flowing — sheltering income. Rental losses are passive: they offset passive income freely, and up to $25,000/yr can offset ordinary (W-2) income if you actively participate and your MAGI is under $100k (phasing out to $0 by $150k); unused losses carry forward. On sale, claimed depreciation is recaptured at up to 25%, and gains may owe capital-gains tax (a 1031 exchange can defer both). Figures are a year-1 estimate at your 24.0% rate — not tax advice; consult a CPA.
Schools (NCES district)
- District
- Clay County
- NCES district ID
- 2101230
- Math proficiency
- 21% ▼ -30.00%
- Reading proficiency
- 37% ▼ -20.00%
- Median HH income
- $23,180
- Composite
- 22.75/100
- National rank
- #8031
- State rank
- #130 of 165 in KY
Livability — Manchester
- Score
- 64/100
- State rank
- #299
- US rank
- #14340
Category grades
Schools grade is shown separately in the Schools card above.
Census & demographics
- Census place
- Manchester, KY
- Population (ZIP)
- 17,390
Population outlook (Clay County) Hauer SSP2
- Today (2025)
- 20,004 people
- By 2030
- 19,285 · -3.6%
- By 2040
- 17,619 · -11.9%
- By 2050
- 15,782 · -21.1%
- By 2075
- 11,489 · -42.6%
- By 2100
- 7,949 · -60.3%
Race, ethnicity, and origin ACS 2023
- Neighborhood character
- Predominantly White (90%)
- Race & ethnicity
- White 90% Black 5% Two or more races 3% Hispanic / Latino 1%
- Common ancestry
- Slovak 2% Italian 1%
- Foreign-born
- 1% · Canada
- Languages at home
- 99% English-only · Spanish 1%
Political lean MEDSL · Clay
- 2024 margin
- Solid R (+80.3) · D 9.2% · R 89.5% · Other 1.3%
- 2008→2024 swing
- -23.9pp toward R · 2008: -56.5pp · 2024: -80.3pp
- All cycles
- 2024: R+80.3 2020: R+77.0 2016: R+75.6 2012: R+68.6 2008: R+56.5
Not yet ingested
- Civics
- —
Market trends
- HPI YoY
- ▲ 50.40%
- Current HPI
- 290.0025
- Rent YoY
- —
- Metro
- —
- State GDP YoY
- ▲ 1.81%
- F500 in state
- 4
Industry mix (Fortune 500 HQ in KY)
| Industry | F500 HQs | Revenue |
|---|---|---|
| Healthcare | 1 | $118B |
|
||
| Food / Beverage | 1 | $7B |
|
||
Price history
-5.6% since first listed2 events — show timeline
- 2026-04-06 Price Changed $170,000 ImagineMLS
- 2026-03-17 Listed $180,000 ImagineMLS
Property tax history
+8.7%/yrLatest (2025): $1,039 · -0.1% YoY. Source: county tax records.
Cash-flow waterfall
monthlySold comps — $/sqft
last 12 mo · ≤1 miLoading sold comps…