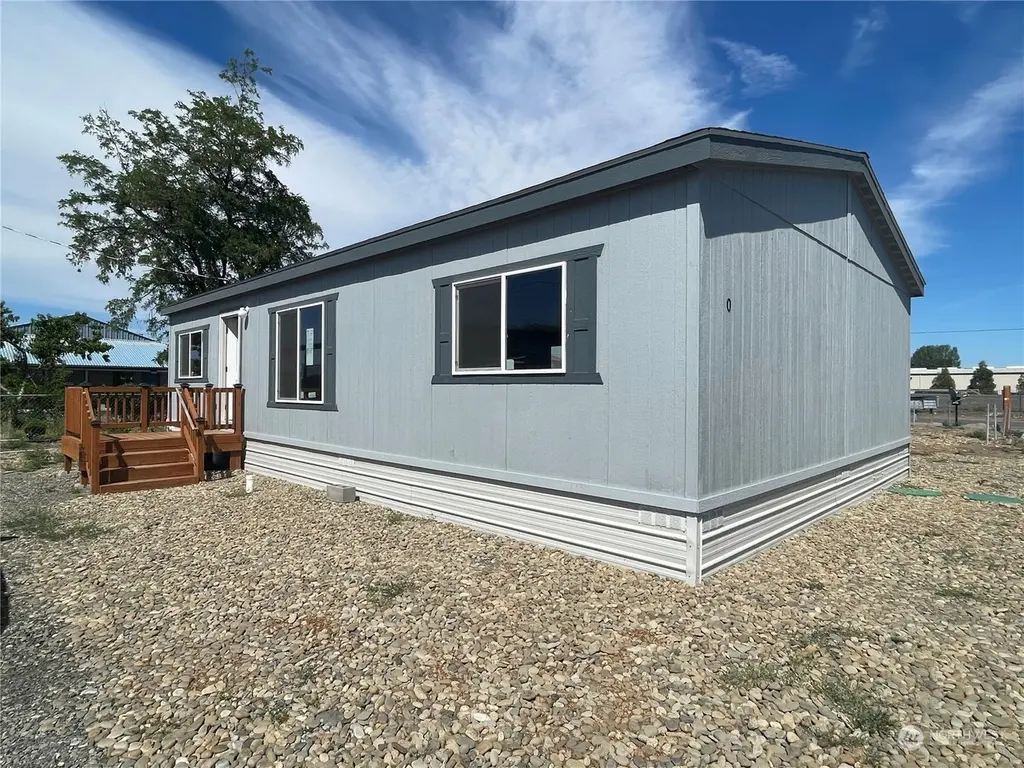
1710 Rudkin Rd #0 · Yakima, WA
Flood risk 3/10 · Minor
- FEMA flood zone
- X (unshaded)
- Chance of flooding over 30 yrs
- 0.07%
- Est. flood insurance / yr
- $507 – $1,088
Fire risk 6/10 · Moderate
- Est. fire insurance / yr
- $604 – $1,122
Heat risk 5/10 · Moderate
- Hot days now (above 97°F)
- 7 days/yr
- Hot days in 30 yrs
- 15 days/yr
Wind risk 1/10 · Minimal
- Chance of severe wind over 30 yrs
- —
Air-quality risk 9/10 · Severe
- Unhealthy air days now
- 16 days/yr
- Unhealthy air days in 30 yrs
- 19 days/yr
Risk factors via First Street. Map © Google.
Why this score? — see what drove the B grade
The composite is a weighted blend of 9 inputs, each scored 0–100. Each bar is that input's sub-score; the figure is the points it added to the 100-point composite (weight × sub-score).
- Cash flow +25.9/30.0
- ARV discount +15.0/15.0
- DSCR +8.7/10.0
- 1% rule +6.2/10.0
- Rent growth +4.8/5.0
- Livability +4.0/5.0
- Condition / age +4.0/5.0
- Schools +3.4/10.0
- Appreciation +0.0/10.0
$104,999
🖨 Deal sheet 📄 Offer letter ✓ Due diligence
Listing remarks
Take advantage of 2 months free lot rent with purchase!! Discover this charming new 3 bedroom, 2 bathroom double-wide park in an all-ages park! Enjoy a spacious, open concept living area perfect for gatherings. The modern kitchen features new appliances and ample cabinet space. Each of the 3 bedrooms, including a primary suite with a private bath, is filled with natural light. This home is close to schools, shopping, and parks for your convenience! Up to 2 pets per household subject to restriction- 40 lbs and under.
Key facts
- Parking
- Built 2023
- Listed 700 days
Tags
Neighborhood map
What this means for you Summary
Snapshot
- This is a 3-bed/2.0-bath single-family listed at $105k. Condition is rated good.
Deal economics
- At list price, monthly cash flow is $259 ($3k/yr) — positive.
- The deal already cash-flows at list — no discount required.
- Meets the 1% rule at list price ($1k rent vs $105k).
- Recommended offer: $92k (12.0% below list) — sets the bar for market timing.
- Cap rate 9.3% vs local median 3.4% in Yakima — top-decile yield for the area; either an underpriced asset or a hidden risk that comps aren't pricing in. Stress-test before assuming the spread holds.
Location & tenants
- Location reads 80/100 on livability (#98 in WA, #1,912 nationally) — a professional / high-income tenant draw. Strengths: amenities A+, commute A+, housing A+; Watch: employment D, crime F.
- Yakima School District (urban): math 34% / reading 42% proficiency, ranked #238 of 291 in WA (top 82%) — families likely to look elsewhere, expect single-tenant / working-renter base with shorter leases; 76% free/reduced lunch — lower-income household profile, screen leases tightly.
- Market conditions: Rents rising fast (+9.3%/yr); 168 active listings in the ZIP; 3 comparable units currently listed for rent nearby; rentals leasing fast (median 14d on market — plan ~1-2 weeks tenant-placement turnaround); 468 units permitted in Yakima County in 2024 (23 in 5+ unit buildings).
Forward outlook
- Local home prices are declining (-3.0%/yr); year-one equity from $726 of loan paydown is wiped out by about $3k of value loss. Plan a longer hold.
- Yakima County population projected at +6% by 2050 — modest demand growth; plan on rents tracking national, not racing it.
- At projected returns (-3.0% appreciation + 8.0% rent growth), your $29k cash investment doubles in ~8 years — after that, you're playing with house money.
Negotiation context
- It's been on market 701 days — a 12% lower offer ($92k) is reasonable based on typical stale-listing flexibility.
- 5 sale attempts since 2y ago; this cycle's ask is 11% above the opening price — seller raised mid-cycle; expect resistance to lowballs.
Risks & watch-outs
- Climate carrying-cost: major wildfire risk; extreme-heat days projected 7→15/yr by 2055 (HVAC capex compounding) — expect insurance premiums to compound above CPI over the hold.
Questions for the listing agent
- It's been on market 701 days. Have you received any prior offers? Is the seller open to a 12% concession, seller financing, or rate buy-down credit?
- Why hasn't it sold? Are there any deal-killer items the seller is aware of (foundation, flood, title, zoning, code violations)?
- Is there a deadline driving the sale (1031 exchange, divorce, estate, relocation)? That informs how much negotiation room exists.
- Crime grade is F in this area — have there been break-ins, vandalism, or insurance claims at this property in the last 3 years? What carrier currently insures it and at what premium?
- What's the average days-on-market for RENTAL listings here right now (not sales)? A rising rental-DOM trend means longer vacancies and softer asking-rent achievability than the comps imply.
- What's the recent tenant-quality profile in this submarket — average credit score on applications, eviction rate, late-payment / NSF rate, and stable-employment percentage? A property-management company in the area should have these aggregated.
- How much new for-sale + rental construction is in the pipeline within 1–3 miles? Heavy new supply typically softens prices + rents 12–24 months out; constrained supply supports both.
Investment metrics
- 1% rule
- 1.12% ✓
- Cap rate
- 9.26%
- Cash-on-cash
- 10.58%
- DSCR
- 1.47
- GRM
- 7.4
CMA / ARV
- ARV (median comp)
- $161,317
- List price
- $104,999
- Delta
- -34.91%
- Verdict
- UNDERPRICED
- Comps
- 5 within 1.0 mi
Show comp detail 3 sales within ~0.75 mi
| Address | Dist | Beds/Ba | Sqft | Sold | Price | $/sf | Match |
|---|---|---|---|---|---|---|---|
| 1622 S 14th St | 0.46mi | 3/2.0 | 1,170 (-2%) | 1mo | $300,000 | $256 | 75 |
| 1812 S 18th St | 0.26mi | 4/1.0 (+1) | 1,190 (+0%) | 8mo | $150,000 | $126 | 71 |
| 1706 S 18th St | 0.21mi | 2/1.0 (-1) | 1,312 (+10%) | 8mo | $220,000 | $168 | 57 |
Match score weights: distance 35% · size 25% · config 20% · recency 20%. Top-matched comps best support the ARV.
Projected returns pro-forma
-3.0% appreciation · 8.0% rent growth · sell at horizon
- IRR
- 4.8%
- Equity multiple
- 1.19×
- Total profit
- $5,717
- Equity at exit
- $15,656
- IRR
- 18.2%
- Equity multiple
- 2.86×
- Total profit
- $54,571
- Equity at exit
- $9,078
Cash invested: $29,400 (down + closing). Projections, not guarantees.
Landlord ↔ Tenant lean methodology
- Overall (STATE)
- 28 Tenant-Leaning
- State Washington
- 28 Tenant-Leaning · D+8
- County
- — inherits STATE
- City
- — inherits STATE
ZIP-level market 98901
- Home prices YoY
- -33.4%
- Rents YoY
- 9.3%
- Active inventory
- 168
- Price-to-rent
- 7.4×
Monthly cashflow live
- Estimated rent
- $1,180 medium interval (Pro) →
- Mortgage (P&I)
- −$551
- Tax from tax record
- −$79 /mo · $948/yr
- Insurance
- −$44
- HOA
- −$0
- Vacancy / Maint / Mgmt
- −$248
- Net cashflow
- $259
Break-even live
UW: 25.0% down · 7.5% · 30yr · 1.5% tax · 5.0% vac · 8.0% maint · 8.0% mgmt
Financing live
Cash to close
- Down payment
- $26,250
- Closing costs
- $3,150
- Reserves months
- —
- Total cash needed
- —
Loan-product check · same deal, 3 products live
Conventional
25% down · 7.5% · 30yr
- Down + closing
- —
- Monthly P&I
- —
- Monthly cashflow
- —
- DSCR
- —
- Eligible?
- —
Personal DTI + credit; lowest rate.
DSCR
20% down · 8.5% · 30yr
- Down + closing
- —
- Monthly P&I
- —
- Monthly cashflow
- —
- DSCR
- —
- Eligible?
- —
No personal income docs; deal must DSCR.
Hard money
10% down · 12.0% · 12mo
- Down + closing
- —
- Monthly P&I
- —
- Monthly cashflow
- —
- DSCR
- —
- Eligible?
- —
Short-term bridge; refi at stabilization.
Rent comps 3 comps
| Address | Beds | Baths | Sqft | Rent | $/sqft | DOM | Units | Dist |
|---|---|---|---|---|---|---|---|---|
| 1121 E Viola Ave Yakima, WA | 3.0–4.0 | 2.0 | 1168 | $1,200 | $1.03 | 13d | 1 | 0.63mi |
| 1618 E Beech St Yakima, WA | 3.0 | 2.0 | 1145 | $1,140 | $1.00 | 13d | 1 | 1.29mi |
| 616 S 7th St Unit 615 Yakima, WA | 2.0 | 1.0 | 850 | $995 | $1.17 | 21d | 1 | 1.47mi |
Listing history 26 events
-
2026-06-19days on market $104,999 Active 701 DOM
-
2026-06-18days on market $104,999 Active 700 DOM
-
2026-06-17days on market $104,999 Active 699 DOM
-
2026-06-16days on market $104,999 Active 698 DOM
-
2026-06-15days on market $104,999 Active 697 DOM
-
2026-06-14days on market $104,999 Active 695 DOM
-
2026-06-13days on market $104,999 Active 694 DOM
-
2026-06-10days on market $104,999 Active 692 DOM
-
2026-06-09days on market $104,999 Active 691 DOM
-
2026-06-08days on market $104,999 Active 690 DOM
-
2026-06-07days on market $104,999 Active 689 DOM
-
2026-06-05days on market $104,999 Active 686 DOM
-
2026-06-03days on market $104,999 Active 685 DOM
-
2026-06-02days on market $104,999 Active 684 DOM
-
2026-06-01days on market $104,999 Active 683 DOM
-
2026-05-31days on market $104,999 Active 682 DOM
-
2026-05-30days on market $104,999 Active 681 DOM
-
2026-01-20status Active
-
2025-07-09status Active
-
2025-06-23status Pending
-
2025-02-05status Active
-
2025-02-01historical
-
2024-11-02status Active
-
2024-10-02price $110,999
-
2024-08-31price $93,000
-
2024-06-07$95,000 Active
ⓘ Source: listings_history table (triggers on properties + properties_extension) + one-shot
backfill from property_details.listing_events for pre-trigger history.
Tax reassessment forecast WA · Resets to sale price
- Current annual tax
- $948 · $79/mo
- Projected year-2 tax
- $1,029 · $86/mo
- Expected delta
- +$81/yr (+$7/mo · 8.5%)
ⓘ Screening estimate from a state-policy table — verify with the county assessor before closing.
Climate risk First Street
- Flood 3/10 Moderate FEMA zone X (unshaded) · 7% chance over 30 yrs
- Wildfire 6/10 Major
- Heat 5/10 Major 7 d/yr ≥97°F today · 15 d/yr by 30 yrs out
- Wind 1/10 Low
- Air quality 9/10 Extreme 16 unhealthy d/yr today · 19 by 30 yrs out
Nearby sold comps map
Loading sold comps map…
Walkable amenities ~0.75 mi
Loading nearby amenities…
Taxation est. · year 1
- Rental income
- $14,166
- − Mortgage interest
- −$5,882
- − Property taxes
- −$948
- − Insurance
- −$525
- − Repairs & maintenance
- −$1,133
- − Management
- −$1,133
- − Depreciation
- −$3,055
- Taxable income
- $1,490
- Est. tax owed @ 24.0%
- −$358
- After-tax cash flow
- $2,753/yr
For passive investors: Depreciation is non-cash, so a rental often shows a tax loss while cash-flowing — sheltering income. Rental losses are passive: they offset passive income freely, and up to $25,000/yr can offset ordinary (W-2) income if you actively participate and your MAGI is under $100k (phasing out to $0 by $150k); unused losses carry forward. On sale, claimed depreciation is recaptured at up to 25%, and gains may owe capital-gains tax (a 1031 exchange can defer both). Figures are a year-1 estimate at your 24.0% rate — not tax advice; consult a CPA.
Condition & rehab AI · 9 photos
This well-maintained, modern single-family home is move-in ready with a good condition score and minimal repairs needed. It offers a spacious, open concept living area and two bathrooms, making it an attractive option for both resale and rental.
Value-add opportunities
- Both Paint exterior walls — Enhances curb appeal and value
- Both Replace carpet in living room — Improves comfort and appearance
- Both Clean and maintain HVAC system — Ensures comfort and energy efficiency
Renovation cost estimate screening
Value-add ROI direction
- Both Paint exterior walls — Enhances curb appeal and value ↑
- Both Replace carpet in living room — Improves comfort and appearance ↑
- Both Clean and maintain HVAC system — Ensures comfort and energy efficiency ↑
ⓘ Cost ranges are severity-bucket heuristics (US national rule-of-thumb). Get contractor quotes + a written scope before underwriting a rehab budget.
Schools (NCES district)
- District
- Yakima School District
- NCES district ID
- 5310110
- Math proficiency
- 34% ▼ -1.00%
- Reading proficiency
- 42% ▬ 0.00%
- Median HH income
- $36,538
- Composite
- 34.04/100
- National rank
- #10305
- State rank
- #238 of 291 in WA
Livability — Yakima
- Score
- 80/100
- State rank
- #98
- US rank
- #1912
Category grades
Schools grade is shown separately in the Schools card above.
Census & demographics
- Census place
- Yakima, WA
- County
- Yakima County · 134,789 people
- City population
- 115,918
- Metro
- Yakima, WA
- Population (ZIP)
- 31,366
- Household income
- $57,392
- Rent vs Own
- Severe rent burden
- 1317.0
Population outlook (Yakima County) Hauer SSP2
- Today (2025)
- 256,514 people
- By 2030
- 259,403 · +1.1%
- By 2040
- 265,677 · +3.6%
- By 2050
- 273,061 · +6.5%
- By 2075
- 296,991 · +15.8%
- By 2100
- 315,291 · +22.9%
Race, ethnicity, and origin ACS 2023
- Neighborhood character
- Majority Hispanic (54%)
- Race & ethnicity
- Hispanic / Latino 54% White 39% Two or more races 22% Native American 3% Black 1%
- Hispanic origin (detail)
- Mexican 49%
- Common ancestry
- Italian 3% Lithuanian 2% Scottish 1%
- Foreign-born
- 20% · Canada
- Languages at home
- 53% English-only · Spanish 46%
Political lean MEDSL · Yakima
- 2024 margin
- R (+14.3) · D 41.6% · R 55.9% · Other 2.5%
- 2008→2024 swing
- -3.8pp toward R · 2008: -10.6pp · 2024: -14.3pp
- All cycles
- 2024: R+14.3 2020: R+7.7 2016: R+15.4 2012: R+15.1 2008: R+10.6
Not yet ingested
- Civics
- —
Market trends
- HPI YoY
- ▼ -144.24%
- Current HPI
- 287.8283
- Rent YoY
- ▲ 9.31%
- Metro
- Yakima, WA
- State GDP YoY
- ▲ 4.65%
- F500 in state
- 22
Industry mix (Fortune 500 HQ in WA)
| Industry | F500 HQs | Revenue |
|---|---|---|
| Retail | 2 | $269B |
|
||
| Technology / Retail | 1 | $638B |
|
||
| Technology | 1 | $245B |
|
||
| Telecommunications | 1 | $38B |
|
||
| Food / Beverage | 1 | $36B |
|
||
| Automotive / Trucks | 1 | $34B |
|
||
Price history
+16.8% since first listed9 events — show timeline
- 2026-01-20 Relisted — NWMLS as Distributed by MLS Grid
- 2025-07-09 Relisted — NWMLS as Distributed by MLS Grid
- 2025-06-23 Pending — NWMLS as Distributed by MLS Grid
- 2025-02-05 Relisted — NWMLS as Distributed by MLS Grid
- 2025-02-01 Delisted — NWMLS as Distributed by MLS Grid
- 2024-11-02 Relisted — NWMLS as Distributed by MLS Grid
- 2024-10-02 Price Changed $110,999 NWMLS as Distributed by MLS Grid
- 2024-08-31 Price Changed $93,000 NWMLS as Distributed by MLS Grid
- 2024-06-07 Listed $95,000 NWMLS as Distributed by MLS Grid
Property tax history
+6.4%/yrLatest (2026): $948 · -5.9% YoY. Source: county tax records.
Cash-flow waterfall
monthlySold comps — $/sqft
last 12 mo · ≤1 miLoading sold comps…