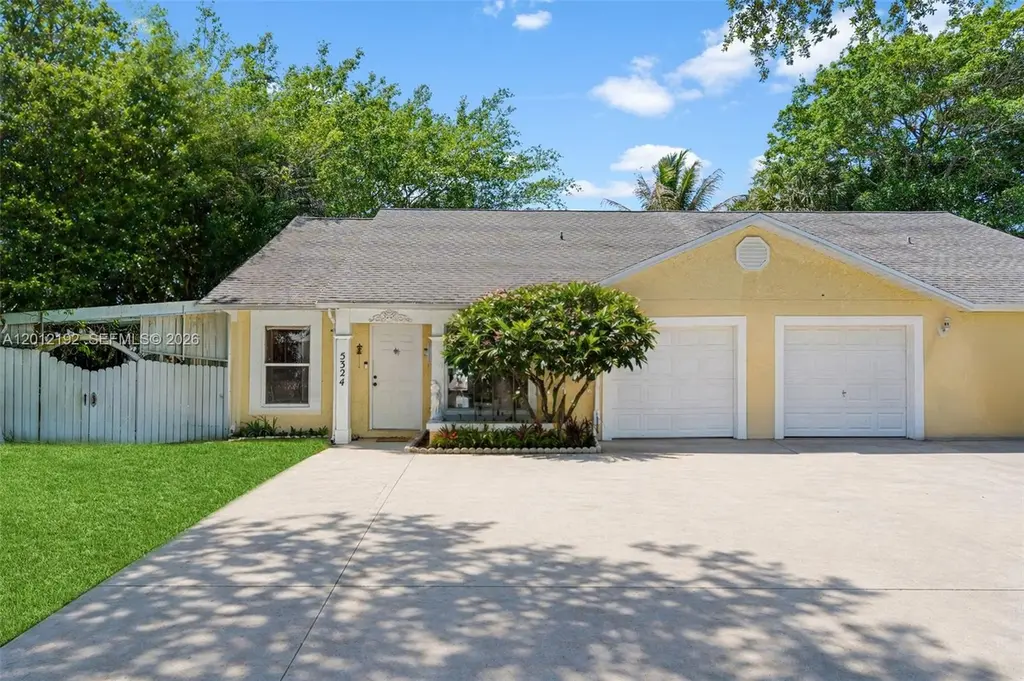
5324 Gray Fox Ct · Royal Palm Estates, FL
Flood risk 1/10 · Minimal
- FEMA flood zone
- X (unshaded)
- Chance of flooding over 30 yrs
- 0.0%
- Est. flood insurance / yr
- $507 – $1,088
Fire risk 1/10 · Minimal
- Est. fire insurance / yr
- $947 – $1,759
Heat risk 10/10 · Severe
- Hot days now (above 105°F)
- 7 days/yr
- Hot days in 30 yrs
- 26 days/yr
Wind risk 10/10 · Severe
- Chance of severe wind over 30 yrs
- 99.0%
Air-quality risk 2/10 · Minimal
- Unhealthy air days now
- 1 days/yr
- Unhealthy air days in 30 yrs
- 1 days/yr
Risk factors via First Street. Map © Google.
Why this score? — see what drove the D- grade
The composite is a weighted blend of 9 inputs, each scored 0–100. Each bar is that input's sub-score; the figure is the points it added to the 100-point composite (weight × sub-score).
- Cash flow +12.9/30.0
- ARV discount +7.5/15.0
- Schools +4.3/10.0
- DSCR +3.9/10.0
- Livability +3.7/5.0
- 1% rule +2.7/10.0
- Condition / age +2.5/5.0
- Rent growth +2.1/5.0
- Appreciation +0.0/10.0
$359,000
🖨 Deal sheet 📄 Offer letter ✓ Due diligence
Listing remarks MLS
''PROPERTY SOLD ''''AS-IS'''''' SELLING COMMISSION UP TO 5% FOR AVAILABILITY AND BIDDING GO ON THE INTERNET TO WWW. FIRSTPRESTON. COM
Key facts
- Additional room
- Fenced backyard
- Corner lot
Tags
Property features AI
Finance
- Financial info: Pets allowed with restrictions or conditions
- HOA & community: Monthly association fee of $100; Association amenities include pool(s)
Exterior
- Parking: Assigned parking; Two or more spaces
- Utilities: Has heating and cooling
- Home design: Attached property; Single-story; Entry level: 1
- Construction: Resale property
- Exterior features: Patio; Association pool
Interior
- Kitchen: Electric range; Microwave; Dishwasher; Refrigerator
- Bedrooms: Attic and den listed as room types
- Flooring: Tile
- Bathrooms: 2 full bathrooms
- Heating & cooling: Central heating; Central air conditioning
- Interior features: First-floor entry; Main living area on entry level; Living/dining room; Attic; Bedroom on main level
- Laundry & utility: Washer; Dryer
Neighborhood map
What this means for you Summary
Snapshot
- This is a 3-bed/2.0-bath townhouse listed at $359k.
Deal economics
- At list price, monthly cash flow is $-26 ($-315/yr) — negative.
- To cash-flow at today's rent, offer at most $354k (1.3% below list).
- To meet the 1% rule (rent ≥ 1% of price), the offer needs to be $277k (22.9% below list).
- Recommended offer: $277k (22.9% below list) — sets the bar for 1% rule.
Location & tenants
- Location reads 74/100 on livability (#290 in FL, #4,897 nationally) — a middle-class / working-renter tenant base. Strengths: crime A+, cost of living A+, housing A+; Watch: schools F, amenities F, commute F.
- Palm Beach (suburban): math 46% / reading 53% proficiency, ranked #34 of 73 in FL (top 47%) — families likely to look elsewhere, expect single-tenant / working-renter base with shorter leases.
- Market conditions: Rents soft (-1.6%/yr); 314 active listings in the ZIP; 13 comparable units currently listed for rent nearby; rentals at typical pace (median 25d on market — plan ~3-4 weeks tenant-placement turnaround); 3,974 units permitted in Palm Beach County in 2024 (1,012 in 5+ unit buildings).
- At $2,767/mo this rent would consume 54% of the median local household income ($61k/yr) (locally 2254% of renters already pay >50% of income on rent) — very limited rent-growth headroom before tenants either downsize or default.
Forward outlook
- Local home prices are declining (-3.0%/yr); year-one equity from $2k of loan paydown is wiped out by about $11k of value loss. Plan a longer hold.
- Palm Beach County population projected at +30% by 2050 — long-run rental-demand tailwind backs the buy-and-hold thesis.
Negotiation context
- It's been on market 45 days — a 3% lower offer ($348k) is reasonable based on typical stale-listing flexibility.
- 2 sale attempts since 27y ago; this cycle's ask has dropped $21k (6%) from the opening price — seller is motivated, your offer sets the floor, not the list.
- Current owner paid $67k; list at $359k implies a 434% gain — meaningful room to come down on a strong offer.
Risks & watch-outs
- Climate carrying-cost: severe wind risk, 99% chance of damaging wind over 30y; extreme-heat days projected 7→26/yr by 2055 (HVAC capex compounding) — expect insurance premiums to compound above CPI over the hold.
Questions for the listing agent
- What do current leases actually rent for vs. the listed asking? Can we see a recent rent roll and the last 12 months of T-12 income?
- It's been on market 45 days. Have you received any prior offers? Is the seller open to a 23% concession, seller financing, or rate buy-down credit?
- What does the HOA fee cover, when was the last increase, and are there any pending special assessments or reserve-fund shortfalls?
- Is there a deadline driving the sale (1031 exchange, divorce, estate, relocation)? That informs how much negotiation room exists.
- Schools are F-rated, which usually means shorter tenancies and higher turnover. Who's the typical renter profile here, and what's been the actual vacancy rate?
- The area grade is low — what's the realistic commute time and amenity access for the typical tenant pool here? Any planned neighborhood developments (good or bad) we should know about?
- What's the average days-on-market for RENTAL listings here right now (not sales)? A rising rental-DOM trend means longer vacancies and softer asking-rent achievability than the comps imply.
- What's the recent tenant-quality profile in this submarket — average credit score on applications, eviction rate, late-payment / NSF rate, and stable-employment percentage? A property-management company in the area should have these aggregated.
- How much new for-sale + rental construction is in the pipeline within 1–3 miles? Heavy new supply typically softens prices + rents 12–24 months out; constrained supply supports both.
Investment metrics
- 1% rule
- 0.77% ✗
- Cap rate
- 6.21%
- Cash-on-cash
- -0.31%
- DSCR
- 0.99
- GRM
- 10.8
CMA / ARV
No comps found within radius.
Projected returns pro-forma
-3.0% appreciation · 0.0% rent growth · sell at horizon
- IRR
- -19.9%
- Equity multiple
- 0.32×
- Total profit
- $-68,080
- Equity at exit
- $53,528
- IRR
- -20.0%
- Equity multiple
- 0.07×
- Total profit
- $-93,280
- Equity at exit
- $31,040
Cash invested: $100,520 (down + closing). Projections, not guarantees.
Landlord ↔ Tenant lean methodology
- Overall (STATE)
- 87 Strongly Landlord-Friendly
- State Florida
- 87 Strongly Landlord-Friendly · R+3
- County
- — inherits STATE
- City
- — inherits STATE
ZIP-level market 33415
- Rents YoY
- -1.6%
- Active inventory
- 314
- Price-to-rent
- 10.8×
Monthly cashflow live
- Estimated rent
- $2,767 high interval (Pro) →
- Mortgage (P&I)
- −$1,883
- Tax from tax record
- −$80 /mo · $964/yr
- Insurance
- −$150
- HOA
- −$100
- Vacancy / Maint / Mgmt
- −$581
- Net cashflow
- $-26
Break-even live
UW: 25.0% down · 7.5% · 30yr · 1.5% tax · 5.0% vac · 8.0% maint · 8.0% mgmt
Financing live
Cash to close
- Down payment
- $89,750
- Closing costs
- $10,770
- Reserves months
- —
- Total cash needed
- —
Loan-product check · same deal, 3 products live
Conventional
25% down · 7.5% · 30yr
- Down + closing
- —
- Monthly P&I
- —
- Monthly cashflow
- —
- DSCR
- —
- Eligible?
- —
Personal DTI + credit; lowest rate.
DSCR
20% down · 8.5% · 30yr
- Down + closing
- —
- Monthly P&I
- —
- Monthly cashflow
- —
- DSCR
- —
- Eligible?
- —
No personal income docs; deal must DSCR.
Hard money
10% down · 12.0% · 12mo
- Down + closing
- —
- Monthly P&I
- —
- Monthly cashflow
- —
- DSCR
- —
- Eligible?
- —
Short-term bridge; refi at stabilization.
Rent comps 13 comps
| Address | Beds | Baths | Sqft | Rent | $/sqft | DOM | Units | Dist |
|---|---|---|---|---|---|---|---|---|
| 1051 Summit Place Cir Unit D West Palm Beach, FL | 3.0 | 2.0 | 1332 | $2,600 | $1.95 | 24d | 1 | 0.85mi |
| 1148 Summit Trail Cir Unit D West Palm Beach, FL | 3.0 | 2.0 | 1332 | $3,100 | $2.33 | 15d | 1 | 0.85mi |
| 663 White Water Dr West Palm Beach, FL | 3.0 | 2.0 | 1400 | $2,800 | $2.00 | 24d | 1 | 0.90mi |
| 6200 Wallis Rd West Palm Beach, FL | 1.0–2.0 | 1.0–2.0 | 740 | $2,570 | $3.47 | 3d | 6 | 0.99mi |
| 759 Caroline Ave West Palm Beach, FL | 4.0 | 2.0 | 1337 | $3,000 | $2.24 | 24d | 1 | 1.05mi |
| 1364 Climbing Rose Ln West Palm Beach, FL | 3.0 | 2.0 | 1492 | $2,700 | $1.81 | 24d | 1 | 1.13mi |
| 938 Sarazen Dr West Palm Beach, FL | 3.0 | 2.0 | 1104 | $2,900 | $2.63 | 24d | 1 | 1.25mi |
| 5360 Kim Ct West Palm Beach, FL | 3.0 | 2.0 | 1407 | $3,100 | $2.20 | 24d | 1 | 1.25mi |
| 2004 Maplewood Dr Unit 2004 Greenacres, FL | 2.0 | 2.0 | 1220 | $2,500 | $2.05 | 24d | 1 | 1.36mi |
| 2004 Maplewood Dr Unit 2004 Greenacres, FL | 2.0 | 2.0 | 1220 | $2,500 | $2.05 | 1d | 1 | 1.36mi |
| 1070 Parkside Green Dr Unit A Greenacres, FL | 3.0 | 2.0 | 1375 | $3,000 | $2.18 | 15d | 1 | 1.39mi |
| 1120 Parkside Green Dr Unit C Greenacres, FL | 3.0 | 2.0 | 1212 | $2,800 | $2.31 | 24d | 1 | 1.41mi |
| 2306 Maplewood Dr Greenacres, FL | 2.0 | 2.0 | 1127 | $2,450 | $2.17 | 24d | 1 | 1.44mi |
HOA detail
- Monthly dues
- $100 · $1,200/yr
- Likely covers
- internet
Listing history 18 events
-
2026-06-18days on market $359,000 Active 45 DOM
-
2026-06-17days on market $359,000 Active 44 DOM
-
2026-06-16days on market $359,000 Active 43 DOM
-
2026-06-15pricedays on market $359,000 Active 42 DOM
-
2026-06-13days on market $380,000 Active 40 DOM
-
2026-06-09days on market $380,000 Active 36 DOM
-
2026-06-08days on market $380,000 Active 35 DOM
-
2026-06-07days on market $380,000 Active 34 DOM
-
2026-06-04days on market $380,000 Active 31 DOM
-
2026-06-03days on market $380,000 Active 30 DOM
-
2026-06-02days on market $380,000 Active 29 DOM
-
2026-06-01days on market $380,000 Active 28 DOM
-
2026-05-31days on market $380,000 Active 27 DOM
-
2026-05-04$380,000 Active
-
1999-10-07soldstatus $67,205 133-char remark
Show marketing remark (133 chars)
''PROPERTY SOLD ''''AS-IS'''''' SELLING COMMISSION UP TO 5% FOR AVAILABILITY AND BIDDING GO ON THE INTERNET TO WWW. FIRSTPRESTON. COM
-
1999-08-19historical 133-char remark
Show marketing remark (133 chars)
''PROPERTY SOLD ''''AS-IS'''''' SELLING COMMISSION UP TO 5% FOR AVAILABILITY AND BIDDING GO ON THE INTERNET TO WWW. FIRSTPRESTON. COM
-
1999-08-11$70,000 133-char remark
Show marketing remark (133 chars)
''PROPERTY SOLD ''''AS-IS'''''' SELLING COMMISSION UP TO 5% FOR AVAILABILITY AND BIDDING GO ON THE INTERNET TO WWW. FIRSTPRESTON. COM
-
1994-03-18soldstatus $70,300
ⓘ Source: listings_history table (triggers on properties + properties_extension) + one-shot
backfill from property_details.listing_events for pre-trigger history.
Tax reassessment forecast FL · Resets to sale price
- Current annual tax
- $964 · $80/mo
- Projected year-2 tax
- $2,980 · $248/mo
- Expected delta
- +$2,016/yr (+$168/mo · 209.2%)
ⓘ Screening estimate from a state-policy table — verify with the county assessor before closing.
Climate risk First Street
- Flood 1/10 Low FEMA zone X (unshaded) · 0% chance over 30 yrs
- Wildfire 1/10 Low
- Heat 10/10 Extreme 7 d/yr ≥105°F today · 26 d/yr by 30 yrs out
- Wind 10/10 Extreme 99% chance of damaging wind over 30 yrs
- Air quality 2/10 Low 1 unhealthy d/yr today · 1 by 30 yrs out
Nearby sold comps map
Loading sold comps map…
Walkable amenities ~0.75 mi
Loading nearby amenities…
Taxation est. · year 1
- Rental income
- $33,209
- − Mortgage interest
- −$20,110
- − Property taxes
- −$964
- − Insurance
- −$1,795
- − Repairs & maintenance
- −$2,657
- − Management
- −$2,657
- − HOA
- −$1,200
- − Depreciation
- −$10,444
- Taxable loss
- −$6,616
- Est. tax savings @ 24.0%
- +$1,588
- After-tax cash flow
- $1,273/yr
For passive investors: Depreciation is non-cash, so a rental often shows a tax loss while cash-flowing — sheltering income. Rental losses are passive: they offset passive income freely, and up to $25,000/yr can offset ordinary (W-2) income if you actively participate and your MAGI is under $100k (phasing out to $0 by $150k); unused losses carry forward. On sale, claimed depreciation is recaptured at up to 25%, and gains may owe capital-gains tax (a 1031 exchange can defer both). Figures are a year-1 estimate at your 24.0% rate — not tax advice; consult a CPA.
Schools (NCES district)
- District
- Palm Beach
- NCES district ID
- 1201500
- Math proficiency
- 46% ▼ -16.00%
- Reading proficiency
- 53% ▼ -4.00%
- Median HH income
- $53,943
- Composite
- 42.72/100
- National rank
- #3160
- State rank
- #34 of 73 in FL
Livability — Royal Palm Estates
- Score
- 74/100
- State rank
- #290
- US rank
- #4897
Category grades
Schools grade is shown separately in the Schools card above.
Census & demographics
- County
- Palm Beach County · 1,438,312 people
- Metro
- Miami-Fort Lauderdale-Pompano Beach, FL
- Population (ZIP)
- 54,581
- Household income
- $61,274
- Rent vs Own
- Severe rent burden
- 2254.0
Population outlook (Palm Beach County) Hauer SSP2
- Today (2025)
- 1,637,487 people
- By 2030
- 1,743,255 · +6.5%
- By 2040
- 1,948,712 · +19.0%
- By 2050
- 2,132,979 · +30.3%
- By 2075
- 2,530,027 · +54.5%
- By 2100
- 2,706,979 · +65.3%
Race, ethnicity, and origin ACS 2023
- Neighborhood character
- Diverse neighborhood (Simpson 0.63)
- Race & ethnicity
- Hispanic / Latino 53% Two or more races 26% White 21% Black 21% Asian 2%
- Hispanic origin (detail)
- Mexican 7% Puerto Rican 6% Cuban 14% Dominican 2% Salvadoran 1%
- Common ancestry
- Hispanic 9% Romanian 1% Lithuanian 1%
- Foreign-born
- 44% · Canada, Jamaica, Dominican Republic
- Languages at home
- 40% English-only · Spanish 49% French/Haitian/Cajun 8% Other Indo-European 1%
Political lean MEDSL · Palm Beach
- 2024 margin
- Toss-up / Even · D 50.0% · R 49.2%
- 2008→2024 swing
- -22.1pp toward R · 2008: 22.9pp · 2024: 0.8pp
- All cycles
- 2024: D+0.8 2020: D+12.8 2016: D+15.3 2012: D+17.0 2008: D+22.9
Not yet ingested
- Civics
- —
Market trends
- HPI YoY
- ▼ -400.29%
- Current HPI
- 413.9695
- Rent YoY
- ▼ -1.64%
- Metro
- Miami-Fort Lauderdale-Pompano Beach, FL
- State GDP YoY
- ▲ 3.28%
- F500 in state
- 36
Industry mix (Fortune 500 HQ in FL)
| Industry | F500 HQs | Revenue |
|---|---|---|
| Industrial Technology | 2 | $29B |
|
||
| Insurance | 2 | $17B |
|
||
| Retail | 1 | $60B |
|
||
| Technology Distribution | 1 | $58B |
|
||
| Homebuilding | 1 | $35B |
|
||
| Technology Manufacturing | 1 | $35B |
|
||
Price history
+440.5% since first listed5 events — show timeline
- 2026-05-04 Listed $380,000 MARMLS
- 1999-10-07 Sold (MLS) $67,205 Beaches MLS
- 1999-08-19 Listing Removed — Beaches MLS
- 1999-08-11 Listed $70,000 Beaches MLS
- 1994-03-18 Sold (Public Records) $70,300 Public Records
Property tax history
+0.8%/yrLatest (2025): $964 · +2.4% YoY. Source: county tax records.
Cash-flow waterfall
monthlySold comps — $/sqft
last 12 mo · ≤1 miLoading sold comps…