 Triplex
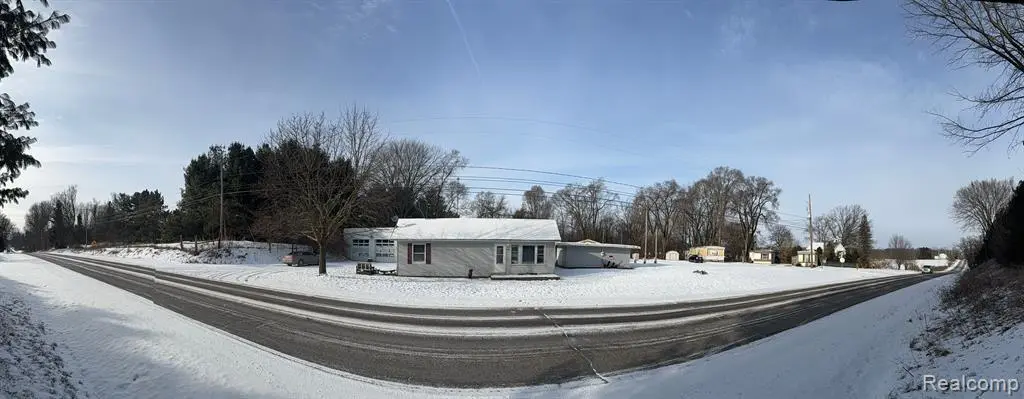
6934 Lansing Ave · Jackson, MI
Flood risk No data
- FEMA flood zone
- —
- Chance of flooding over 30 yrs
- —
- Est. flood insurance / yr
- —
Fire risk No data
- Est. fire insurance / yr
- —
Heat risk No data
- Hot days now (above threshold)
- —
- Hot days in 30 yrs
- —
Wind risk No data
- Chance of severe wind over 30 yrs
- —
Air-quality risk No data
- Unhealthy air days now
- —
- Unhealthy air days in 30 yrs
- —
Risk factors via First Street. Map © Google.
Why this score? — see what drove the C grade
The composite is a weighted blend of 9 inputs, each scored 0–100. Each bar is that input's sub-score; the figure is the points it added to the 100-point composite (weight × sub-score).
- Cash flow +24.2/30.0
- DSCR +7.8/10.0
- ARV discount +7.5/15.0
- 1% rule +6.3/10.0
- Rent growth +5.0/5.0
- Livability +3.7/5.0
- Schools +2.6/10.0
- Condition / age +2.5/5.0
- Appreciation +0.0/10.0
$279,900
🖨 Deal sheet 📄 Offer letter ✓ Due diligence
Multi-family units
County records classify this as Multi-Family (5+ Unit). Listing-text estimate: 3 units. estimate disagrees with records
5+ unit building — per-unit beds/baths from public records are typically unavailable; the breakdown below (if shown) is an estimate from the listing text.
Listing remarks MLS
Welcome to this wonderful rental, business opportunity in Jackson County. This is a mobile home park that currently has 4 mobile homes present. There are a total of 8 mobile homes that are able to occupy the property. There is a home that is also rented that sits on the front of the property. The gross income per year is currently 42,039. Operating expenses per year is 10K (Insurance 3K, Electric 1K, Property taxes 4K, Trash 800, Septic Maintenance 1200). The property has a 2 car garage that is on site. Please see listing for details.
Key facts
- 1.24 acre lot
- 5 parking spots
- Built 1960
Property features AI
Finance
- Financial info: Multiple rented units with current rents: $800, $520, $400 (furnished), $610, $630
Exterior
- Parking: Total of 5 parking spaces
- Utilities: Private well water; Septic tank sewer
- Home design: Residential income property; Multi-family building; One level
- Construction: Aluminum siding; Block construction; Vinyl siding
- Exterior features: Paved road access; Lot dimensions approximately 300 x 247 x 267 x 200; Lot is about 1.24 acres; Zoned commercial
Interior
- Bedrooms: Multiple 2-bedroom units (several units are 2-bedroom)
- Bathrooms: Five full bathrooms total across the property
- Heating & cooling: Baseboard heating; Electric heating; Natural gas heating; Wall unit cooling; Window unit cooling
- Interior features: Basement present; Pets allowed
Neighborhood map
What this means for you Summary
Snapshot
- This is a 3 × 3-bed/1.7-bath units multifamily listed at $280k.
Deal economics
- At list price, monthly cash flow is $560 ($7k/yr) — positive. Per door: $187/mo.
- The deal already cash-flows at list — no discount required.
- Meets the 1% rule at list price ($3k rent vs $280k).
- Recommended offer: $246k (12.0% below list) — sets the bar for market timing.
- Cap rate 8.7% vs local median 5.4% in Jackson — top-decile yield for the area; either an underpriced asset or a hidden risk that comps aren't pricing in. Stress-test before assuming the spread holds.
Location & tenants
- Location reads 74/100 on livability (#197 in MI, #4,970 nationally) — a middle-class / working-renter tenant base. Strengths: cost of living A+, housing A+, health & safety A+; Watch: schools D, crime F, employment F.
- Northwest Community Schools (suburban): math 19% / reading 41% proficiency, ranked #360 of 540 in MI (top 67%) — families likely to look elsewhere, expect single-tenant / working-renter base with shorter leases.
- Market conditions: Rents rising fast (+10.3%/yr); 362 active listings in the ZIP; 317 units permitted in Jackson County in 2024 (103 in 5+ unit buildings).
- At $3,158/mo this rent would consume 51% of the median local household income ($74k/yr) (locally 840% of renters already pay >50% of income on rent) — very limited rent-growth headroom before tenants either downsize or default.
Forward outlook
- Local home prices are declining (-3.0%/yr); year-one equity from $2k of loan paydown is wiped out by about $8k of value loss. Plan a longer hold.
- Jackson County population projected at -13% by 2050 — secular population decline; favor cash flow + early exit over multi-decade hold.
- At projected returns (-3.0% appreciation + 8.0% rent growth), your $78k cash investment doubles in ~8 years — after that, you're playing with house money.
Negotiation context
- It's been on market 123 days — a 12% lower offer ($246k) is reasonable based on typical stale-listing flexibility.
- 12 sale attempts since 11y ago with the ask held roughly flat each time — persistent listings suggest the price (not the market) is what's stuck; bring a comps-based counter.
- Current owner paid $240k; 17% above their basis — modest negotiation headroom, anchor on the comps not their cost.
Questions for the listing agent
- It's been on market 123 days. Have you received any prior offers? Is the seller open to a 12% concession, seller financing, or rate buy-down credit?
- Can we see the unit-by-unit rent roll, current vacancy, and any below-market leases? What's the average tenancy length?
- What capital expenditures (roof, boiler, parking lot, exteriors) have been made in the last 5 years, and what's planned in the next 2?
- Built in 1960 — when were the roof, HVAC, electrical panel, plumbing, and water heater last replaced?
- Why hasn't it sold? Are there any deal-killer items the seller is aware of (foundation, flood, title, zoning, code violations)?
- Is there a deadline driving the sale (1031 exchange, divorce, estate, relocation)? That informs how much negotiation room exists.
- Schools are D-rated, which usually means shorter tenancies and higher turnover. Who's the typical renter profile here, and what's been the actual vacancy rate?
- Crime grade is F in this area — have there been break-ins, vandalism, or insurance claims at this property in the last 3 years? What carrier currently insures it and at what premium?
- What's the average days-on-market for RENTAL listings here right now (not sales)? A rising rental-DOM trend means longer vacancies and softer asking-rent achievability than the comps imply.
- What's the recent tenant-quality profile in this submarket — average credit score on applications, eviction rate, late-payment / NSF rate, and stable-employment percentage? A property-management company in the area should have these aggregated.
- How much new apartment / multifamily construction is in the pipeline within 1–3 miles? Heavy new supply (>2% of stock underway) typically softens rents 12–24 months out; light construction supports rent growth.
Investment metrics
- 1% rule
- 1.13% ✓
- Cap rate
- 8.70%
- Cash-on-cash
- 8.58%
- DSCR
- 1.38
- GRM
- 7.4
CMA / ARV
No comps found within radius.
Projected returns pro-forma
-3.0% appreciation · 8.0% rent growth · sell at horizon
- IRR
- 2.2%
- Equity multiple
- 1.09×
- Total profit
- $7,079
- Equity at exit
- $41,734
- IRR
- 16.2%
- Equity multiple
- 2.64×
- Total profit
- $128,285
- Equity at exit
- $24,201
Cash invested: $78,372 (down + closing). Projections, not guarantees.
Landlord ↔ Tenant lean methodology
- Overall (STATE)
- 62 Landlord-Friendly
- State Michigan
- 62 Landlord-Friendly · EVEN
- County
- — inherits STATE
- City
- — inherits STATE
ZIP-level market 49201
- Rents YoY
- 10.3%
- Active inventory
- 362
- Price-to-rent
- 22.2×
Monthly cashflow live
- Estimated rent
- $3,158 medium interval (Pro) →
- Mortgage (P&I)
- −$1,468
- Tax est. 1.5%
- −$350 /mo · $4,198/yr
- Insurance
- −$117
- HOA
- −$0
- Vacancy / Maint / Mgmt
- −$663
- Net cashflow
- $560
Break-even live
3-unit breakdown (identical units grouped — click to expand)
| Units | Beds | Baths | Est. rent |
|---|---|---|---|
| 3× units | 3 | 1.7 | $3,159 |
| #1 | 3 | 1.7 | $1,053 |
| #2 | 3 | 1.7 | $1,053 |
| #3 | 3 | 1.7 | $1,053 |
| Total (3 units) | $3,158 | ||
UW: 25.0% down · 7.5% · 30yr · 1.5% tax · 5.0% vac · 8.0% maint · 8.0% mgmt
Financing live
Cash to close
- Down payment
- $69,975
- Closing costs
- $8,397
- Reserves months
- —
- Total cash needed
- —
Loan-product check · same deal, 3 products live
Conventional
25% down · 7.5% · 30yr
- Down + closing
- —
- Monthly P&I
- —
- Monthly cashflow
- —
- DSCR
- —
- Eligible?
- —
Personal DTI + credit; lowest rate.
DSCR
20% down · 8.5% · 30yr
- Down + closing
- —
- Monthly P&I
- —
- Monthly cashflow
- —
- DSCR
- —
- Eligible?
- —
No personal income docs; deal must DSCR.
Hard money
10% down · 12.0% · 12mo
- Down + closing
- —
- Monthly P&I
- —
- Monthly cashflow
- —
- DSCR
- —
- Eligible?
- —
Short-term bridge; refi at stabilization.
Listing history 45 events
-
2026-06-19days on market $279,900 Active 123 DOM
-
2026-06-18days on market $279,900 Active 122 DOM
-
2026-06-17days on market $279,900 Active 121 DOM
-
2026-06-16days on market $279,900 Active 120 DOM
-
2026-06-15days on market $279,900 Active 119 DOM
-
2026-06-14days on market $279,900 Active 117 DOM
-
2026-06-13days on market $279,900 Active 116 DOM
-
2026-06-10days on market $279,900 Active 114 DOM
-
2026-06-09days on market $279,900 Active 113 DOM
-
2026-06-08days on market $279,900 Active 112 DOM
-
2026-06-07days on market $279,900 Active 111 DOM
-
2026-06-05days on market $279,900 Active 108 DOM
-
2026-06-03days on market $279,900 Active 107 DOM
-
2026-06-02days on market $279,900 Active 106 DOM
-
2026-06-01days on market $279,900 Active 105 DOM
-
2026-05-31days on market $279,900 Active 104 DOM
-
2026-05-30days on market $279,900 Active 103 DOM
-
2026-02-16$279,900 Active
-
2026-02-15$279,900 Active 540-char remark
Show marketing remark (540 chars)
Welcome to this wonderful rental, business opportunity in Jackson County. This is a mobile home park that currently has 4 mobile homes present. There are a total of 8 mobile homes that are able to occupy the property. There is a home that is also rented that sits on the front of the property. The gross income per year is currently 42,039. Operating expenses per year is 10K (Insurance 3K, Electric 1K, Property taxes 4K, Trash 800, Septic Maintenance 1200). The property has a 2 car garage that is on site. Please see listing for details.
-
2026-01-31historical
-
2026-01-31historical
-
2025-10-16price $279,900
-
2025-10-16price $279,900
-
2025-08-19price $284,900
-
2025-08-19price $284,900
-
2025-01-31$290,000 Active
-
2025-01-30$290,000 Active
-
2023-08-31soldstatus $240,000 Closed
-
2023-08-31soldstatus $240,000
-
2023-05-22status Pending
-
2023-04-17$250,000 Active
-
2023-04-17$250,000
-
2017-09-19soldstatus $85,000
-
2017-09-19soldstatus $85,000
-
2017-09-19soldstatus $85,000 Closed
-
2017-07-29status Pending
-
2017-07-18status Active
-
2017-07-08status Pending
-
2017-07-04$84,900 Active
-
2017-07-03$84,900
-
2017-07-03$84,900
-
2015-10-20historical
-
2015-10-20historical
-
2015-07-20$84,500
-
2015-07-20$84,500
ⓘ Source: listings_history table (triggers on properties + properties_extension) + one-shot
backfill from property_details.listing_events for pre-trigger history.
Nearby sold comps map
Loading sold comps map…
Walkable amenities ~0.75 mi
Loading nearby amenities…
Taxation est. · year 1
- Rental income
- $37,896
- − Mortgage interest
- −$15,679
- − Property taxes
- −$4,198
- − Insurance
- −$1,400
- − Repairs & maintenance
- −$3,032
- − Management
- −$3,032
- − Depreciation
- −$8,143
- Taxable income
- $2,413
- Est. tax owed @ 24.0%
- −$579
- After-tax cash flow
- $6,147/yr
For passive investors: Depreciation is non-cash, so a rental often shows a tax loss while cash-flowing — sheltering income. Rental losses are passive: they offset passive income freely, and up to $25,000/yr can offset ordinary (W-2) income if you actively participate and your MAGI is under $100k (phasing out to $0 by $150k); unused losses carry forward. On sale, claimed depreciation is recaptured at up to 25%, and gains may owe capital-gains tax (a 1031 exchange can defer both). Figures are a year-1 estimate at your 24.0% rate — not tax advice; consult a CPA.
Schools (NCES district)
- District
- Northwest Community Schools
- NCES district ID
- 2626010
- Math proficiency
- 19% ▼ -8.00%
- Reading proficiency
- 41% ▼ -1.00%
- Median HH income
- $47,509
- Composite
- 25.88/100
- National rank
- #7342
- State rank
- #360 of 540 in MI
Livability — Jackson
- Score
- 74/100
- State rank
- #197
- US rank
- #4970
Category grades
Schools grade is shown separately in the Schools card above.
Census & demographics
- County
- Jackson County · 85,581 people
- City population
- 85,581
- Metro
- Jackson, MI
- Population (ZIP)
- 49,107
- Household income
- $74,484
- Rent vs Own
- Severe rent burden
- 840.0
Population outlook (Jackson County) Hauer SSP2
- Today (2025)
- 156,365 people
- By 2030
- 153,123 · -2.1%
- By 2040
- 144,981 · -7.3%
- By 2050
- 135,671 · -13.2%
- By 2075
- 113,833 · -27.2%
- By 2100
- 86,592 · -44.6%
Race, ethnicity, and origin ACS 2023
- Neighborhood character
- Predominantly White (80%)
- Race & ethnicity
- White 80% Black 9% Two or more races 6% Hispanic / Latino 5%
- Hispanic origin (detail)
- Mexican 4%
- Common ancestry
- Romanian 7% Lithuanian 3% Slovak 2%
- Foreign-born
- 3% · Canada
- Languages at home
- 96% English-only · Spanish 2% Other Indo-European 1% Russian/Polish/Slavic 1%
Political lean MEDSL · Jackson
- 2024 margin
- Strong R (+21.3) · D 38.6% · R 59.9% · Other 1.5%
- 2008→2024 swing
- -23.7pp toward R · 2008: 2.4pp · 2024: -21.3pp
- All cycles
- 2024: R+21.3 2020: R+19.0 2016: R+20.1 2012: R+5.8 2008: D+2.4
Not yet ingested
- Civics
- —
Market trends
- HPI YoY
- ▼ -198.89%
- Current HPI
- 185.3773
- Rent YoY
- ▲ 10.32%
- Metro
- Jackson, MI
- State GDP YoY
- ▲ 1.37%
- F500 in state
- 28
Industry mix (Fortune 500 HQ in MI)
| Industry | F500 HQs | Revenue |
|---|---|---|
| Automotive Parts | 3 | $48B |
|
||
| Automotive | 2 | $372B |
|
||
| Chemicals | 1 | $45B |
|
||
| Automotive Retail | 1 | $29B |
|
||
| Healthcare / Medical Devices | 1 | $23B |
|
||
| Automotive Technology | 1 | $20B |
|
||
Price history
+231.2% since first listed28 events — show timeline
- 2026-02-16 Listed $279,900 REALCOMP
- 2026-02-15 Listed $279,900 MiRealSource-MiMLS
- 2026-01-31 Listing Removed — REALCOMP
- 2026-01-31 Listing Removed — MiRealSource-MiMLS
- 2025-10-16 Price Changed $279,900 MiRealSource-MiMLS
- 2025-10-16 Price Changed $279,900 REALCOMP
- 2025-08-19 Price Changed $284,900 MiRealSource-MiMLS
- 2025-08-19 Price Changed $284,900 REALCOMP
- 2025-01-31 Listed $290,000 MiRealSource-MiMLS
- 2025-01-30 Listed $290,000 REALCOMP
- 2023-08-31 Sold (MLS) $240,000 REALCOMP
- 2023-08-31 Sold (MLS) $240,000 Greater Lansing AoR
- 2023-05-22 Pending — Greater Lansing AoR
- 2023-04-17 Listed $250,000 REALCOMP
- 2023-04-17 Listed $250,000 Greater Lansing AoR
- 2017-09-19 Sold (MLS) $85,000 MiRealSource-MiMLS
- 2017-09-19 Sold (MLS) $85,000 SW Michigan MLS
- 2017-09-19 Sold (MLS) $85,000 REALCOMP
- 2017-07-29 Pending — MiRealSource-MiMLS
- 2017-07-18 Relisted — MiRealSource-MiMLS
- 2017-07-08 Pending — MiRealSource-MiMLS
- 2017-07-04 Listed $84,900 MiRealSource-MiMLS
- 2017-07-03 Listed $84,900 SW Michigan MLS
- 2017-07-03 Listed $84,900 REALCOMP
- 2015-10-20 Listing Removed — MiRealSource-MiMLS
- 2015-10-20 Listing Removed — REALCOMP
- 2015-07-20 Listed $84,500 MiRealSource-MiMLS
- 2015-07-20 Listed $84,500 REALCOMP
Cash-flow waterfall
monthlySold comps — $/sqft
last 12 mo · ≤1 miLoading sold comps…