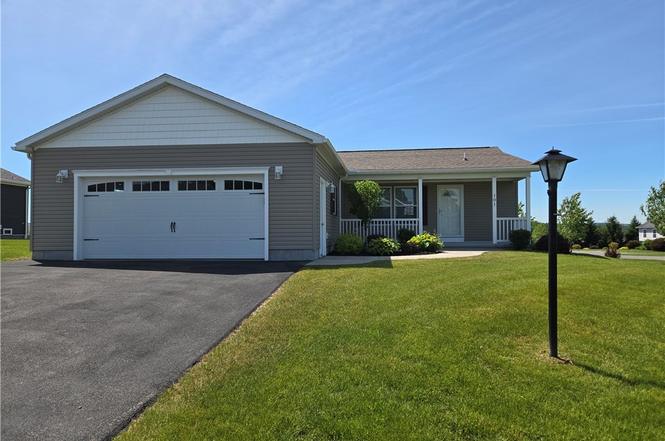
101 Woods Edge Dr · Clark Mills, NY
Flood risk 1/10 · Minimal
- FEMA flood zone
- X (unshaded)
- Chance of flooding over 30 yrs
- 0.0%
- Est. flood insurance / yr
- $473 – $860
Fire risk 3/10 · Minor
- Est. fire insurance / yr
- $691 – $1,283
Heat risk 3/10 · Minor
- Hot days now (above 95°F)
- 7 days/yr
- Hot days in 30 yrs
- 16 days/yr
Wind risk 1/10 · Minimal
- Chance of severe wind over 30 yrs
- 0.0%
Air-quality risk 2/10 · Minimal
- Unhealthy air days now
- 0 days/yr
- Unhealthy air days in 30 yrs
- 2 days/yr
Risk factors via First Street. Map © Google.
Why this score? — see what drove the D grade
The composite is a weighted blend of 9 inputs, each scored 0–100. Each bar is that input's sub-score; the figure is the points it added to the 100-point composite (weight × sub-score).
- Cash flow +10.3/30.0
- ARV discount +7.5/15.0
- Schools +6.1/10.0
- Condition / age +4.0/5.0
- Livability +3.6/5.0
- 1% rule +3.1/10.0
- DSCR +3.0/10.0
- Rent growth +2.5/5.0
- Appreciation +0.0/10.0
$290,000
🖨 Deal sheet (PDF) 📄 Offer letter ✓ Due diligence
Listing remarks
Welcome to your dream home in a vibrant 55+ community! This stunning single story residence offers the perfect blend of comfort and convenience, featuring an inviting open concept design that seamlessly flows from room to room. Step inside to find a bright and airy living space that is fully furnished and turn-key ready for you to move in and start living the easy, carefree lifestyle you've always desired. The spacious living area is perfect for entertaining friends or enjoying quiet evenings at home, while the modern kitchen boasts ample counter space, sleek appliances, and a cozy dining area. This lovely home includes two well-appointed bedrooms, each designed with comfort in mind. The p
Key facts
- 2 garage spots
- Built 2022
- Listed 6 days
Property features AI
Finance
- Financial info: Has land lease (monthly amount)
- HOA & community: Monthly association/land-lease fee
Exterior
- Parking: Attached garage with 2 spaces; Driveway; Garage door opener
- Utilities: Public water (connected); Sewer connected; Electric with circuit breakers; Gas water heater
- Home design: Single-story (1 story); Double wide mobile home (Champion/Brentwood); Existing construction
- Construction: Vinyl siding; Asphalt shingle roof; Poured foundation
- Exterior features: Blacktop driveway; Deck; Open porch
Interior
- Kitchen: Dishwasher; Gas oven; Gas range; Microwave; Refrigerator; Kitchen island; Breakfast bar
- Bedrooms: 2 main level bedrooms
- Flooring: Carpet; Vinyl; Varied flooring
- Bathrooms: 2 full bathrooms (both on main level)
- Heating & cooling: Gas forced air heating; Central air conditioning
- Interior features: Furnished; Breakfast bar; Ceiling fan(s); Entrance foyer; Separate/formal living room; Kitchen island; Living/dining room; Main level primary; Primary suite; See remarks
- Laundry & utility: Washer; Dryer; Main level laundry
Neighborhood map
What this means for you Summary
Snapshot
- This is a 2-bed/2.0-bath manufactured listed at $290k. Condition is rated good.
Deal economics
- At list price, monthly cash flow is $-158 ($-2k/yr) — negative.
- To cash-flow at today's rent, offer at most $267k (7.9% below list).
- To meet the 1% rule (rent ≥ 1% of price), the offer needs to be $234k (19.4% below list).
- Recommended offer: $234k (19.4% below list) — sets the bar for 1% rule.
Location & tenants
- Location reads 71/100 on livability (#383 in NY) — a middle-class / working-renter tenant base. Strengths: housing A+, health & safety A+, crime A; Watch: amenities F, commute F.
- New Hartford Central School District (suburban): math 65% / reading 76% proficiency, ranked #128 of 590 in NY (top 22%) — strong family-tenant draw, lease renewals of 3-5y typical; only 9% free/reduced lunch — higher-income household profile.
- Zoned schools: Perry Junior High School (math 52% / reading 72%, grade B+, #136 of 729 statewide, top 20%, 584 students, 21% FRL); New Hartford Senior High School (math 98% / reading 87%, grade A+, #158 of 1,100 statewide, top 15%, 645 students, 19% FRL).
- Market conditions: 41 active listings in the ZIP; 7 comparable units currently listed for rent nearby; rentals lingering (median 45d on market — plan ~5-8 weeks vacancy on turnover, expect pricing pressure); 100% of comp listings sitting > 30 days — soft ceiling on asking rent; 204 units permitted in Oneida County in 2024 (68 in 5+ unit buildings).
Forward outlook
- Local home prices are declining (-3.0%/yr); year-one equity from $2k of loan paydown is wiped out by about $9k of value loss. Plan a longer hold.
- Oneida County population projected at -12% by 2050 — secular population decline; favor cash flow + early exit over multi-decade hold.
Negotiation context
- Only 6 days on market — expect competitive offers; lowballing is unlikely to land.
Questions for the listing agent
- What do current leases actually rent for vs. the listed asking? Can we see a recent rent roll and the last 12 months of T-12 income?
- Is there a deadline driving the sale (1031 exchange, divorce, estate, relocation)? That informs how much negotiation room exists.
- Schools are D-rated, which usually means shorter tenancies and higher turnover. Who's the typical renter profile here, and what's been the actual vacancy rate?
- The area grade is low — what's the realistic commute time and amenity access for the typical tenant pool here? Any planned neighborhood developments (good or bad) we should know about?
- What's the average days-on-market for RENTAL listings here right now (not sales)? A rising rental-DOM trend means longer vacancies and softer asking-rent achievability than the comps imply.
- What's the recent tenant-quality profile in this submarket — average credit score on applications, eviction rate, late-payment / NSF rate, and stable-employment percentage? A property-management company in the area should have these aggregated.
- How much new for-sale + rental construction is in the pipeline within 1–3 miles? Heavy new supply typically softens prices + rents 12–24 months out; constrained supply supports both.
Investment metrics
- 1% rule
- 0.81% ✗
- Cap rate
- 5.64%
- Cash-on-cash
- -2.33%
- DSCR
- 0.90
- GRM
- 10.3
CMA / ARV
- ARV (on-the-fly)
- $112,000
- Comps found
- 12
Show comp detail 12 sales within ~0.75 mi
| Address | Dist | Beds/Ba | Sqft | Sold | Price | $/sf | Match |
|---|---|---|---|---|---|---|---|
| 19 Cherrywood | 0.16mi | 3/2.0 (+1) | 1,500 (+7%) | 8mo | $263,000 | $175 | 68 |
| 215 Brett Brae | 0.41mi | 2/2.0 | 1,270 (-9%) | 1mo | $90,000 | $71 | 64 |
| 134 Royal Meadows Dr | 0.34mi | 3/2.0 (+1) | 1,405 (+0%) | 18mo | $95,000 | $68 | 63 |
| 131 Royal Meadows Dr | 0.49mi | 3/2.0 (+1) | 1,404 (+0%) | 13mo | $93,000 | $66 | 61 |
| 313 Gracie Pl | 0.39mi | 2/2.0 | 1,568 (+12%) | 13mo | $239,900 | $153 | 51 |
| 2 Treestump Dr | 0.74mi | 3/2.0 (+1) | 1,344 (-4%) | 4mo | $67,000 | $50 | 50 |
| 512 Patricia Dr | 0.53mi | 3/2.0 (+1) | 1,536 (+10%) | 6mo | $100,000 | $65 | 49 |
| 26 Overland Dr | 0.20mi | 3/2.0 (+1) | 1,568 (+12%) | 22mo | $260,000 | $166 | 48 |
| 35 Overland Dr | 0.20mi | 3/2.0 (+1) | 1,589 (+14%) | 22mo | $285,000 | $179 | 45 |
| 248 Brett Brae | 0.54mi | 3/2.0 (+1) | 1,280 (-9%) | 15mo | $114,000 | $89 | 43 |
| 604 E Barbara Ave W | 0.65mi | 3/2.0 (+1) | 1,440 (+3%) | 23mo | $115,000 | $80 | 40 |
| 621 Barbara Ave | 0.70mi | 3/2.0 (+1) | 1,536 (+10%) | 10mo | $122,000 | $79 | 38 |
Match score weights: distance 35% · size 25% · config 20% · recency 20%. Top-matched comps best support the ARV.
Projected returns pro-forma
-3.0% appreciation · 3.0% rent growth · sell at horizon
- IRR
- -20.2%
- Equity multiple
- 0.30×
- Total profit
- $-57,011
- Equity at exit
- $43,240
- IRR
- -13.2%
- Equity multiple
- 0.23×
- Total profit
- $-62,447
- Equity at exit
- $25,074
Cash invested: $81,200 (down + closing). Projections, not guarantees.
Landlord ↔ Tenant lean methodology
- Overall (STATE)
- 15 Strongly Tenant-Friendly
- State New York
- 15 Strongly Tenant-Friendly · D+10
- County
- — inherits STATE
- City
- — inherits STATE
ZIP-level market 13323
- Home prices YoY
- -22.2%
- Active inventory
- 41
- Price-to-rent
- 10.3×
Monthly cashflow live
- Estimated rent
- $2,337 high interval (Pro) →
- Mortgage (P&I)
- −$1,521
- Tax est. 1.5%
- −$362 /mo · $4,350/yr
- Insurance
- −$121
- HOA
- −$0
- Vacancy / Maint / Mgmt
- −$491
- Net cashflow
- $-158
Break-even live
Sensitivity live
| Price | -10% $43 | -5% $-58 | +0% $-158 | +5% $-258 | +10% $-358 |
|---|---|---|---|---|---|
| Rent | -10% $-342 | -5% $-250 | +0% $-158 | +5% $-66 | +10% $27 |
| Rate | -1.0pp $-12 | -0.5pp $-84 | base $-158 | +0.5pp $-233 | +1.0pp $-309 |
UW: 25.0% down · 7.5% · 30yr · 1.5% tax · 5.0% vac · 8.0% maint · 8.0% mgmt
Financing live
Cash to close
- Down payment
- $72,500
- Closing costs
- $8,700
- Reserves months
- —
- Total cash needed
- —
Loan-product check · same deal, 3 products live
Conventional
25% down · 7.5% · 30yr
- Down + closing
- —
- Monthly P&I
- —
- Monthly cashflow
- —
- DSCR
- —
- Eligible?
- —
Personal DTI + credit; lowest rate.
DSCR
20% down · 8.5% · 30yr
- Down + closing
- —
- Monthly P&I
- —
- Monthly cashflow
- —
- DSCR
- —
- Eligible?
- —
No personal income docs; deal must DSCR.
Hard money
10% down · 12.0% · 12mo
- Down + closing
- —
- Monthly P&I
- —
- Monthly cashflow
- —
- DSCR
- —
- Eligible?
- —
Short-term bridge; refi at stabilization.
Rent comps 7 comps
| Address | Beds | Baths | Sqft | Rent | $/sqft | DOM | Units | Dist |
|---|---|---|---|---|---|---|---|---|
| 130 Pheasants Run Clinton, NY | 2.0 | 1.5 | 1200 | $2,250 | $1.88 | 45d | 1 | 0.77mi |
| 122 Pheasants Run Kirkland, NY | 2.0 | 2.0 | 1200 | $3,100 | $2.58 | 45d | 1 | 0.80mi |
| 135 Pheasants Run Clark Mills, NY | 2.0 | 1.5 | 1100 | $2,350 | $2.14 | 45d | 1 | 0.80mi |
| 105 Pheasants Run Clinton, NY | 2.0 | 1.5 | 1050 | $2,150 | $2.05 | 45d | 1 | 0.83mi |
| 2 Cambridge LN Kirkland, NY | 1.0–2.0 | 1.0 | 800 | $1,225 | $1.53 | 45d | 4 | 1.34mi |
| 167 Clinton Rd New Hartford, NY | 3.0 | 1.0–2.5 | 1063 | $2,433 | $2.29 | 45d | 15 | 1.39mi |
| 118 Copeland Ct Apt 205 New Hartford, NY | 2.0 | 2.0 | 1200 | $2,100 | $1.75 | 45d | 1 | 1.41mi |
Listing history 6 events
-
2026-06-22days on market $290,000 Active 6 DOM
-
2026-06-19days on market $290,000 Active 4 DOM
-
2026-06-18days on market $290,000 Active 3 DOM
-
2026-06-17days on market $290,000 Active 2 DOM
-
2026-06-15remarks 699-char remark
-
2026-06-15$290,000 Active 1 DOM
ⓘ Source: listings_history table (triggers on properties + properties_extension) + one-shot
backfill from property_details.listing_events for pre-trigger history.
Climate risk First Street
- Flood 1/10 Low FEMA zone X (unshaded) · 0% chance over 30 yrs
- Wildfire 3/10 Moderate
- Heat 3/10 Moderate 7 d/yr ≥95°F today · 16 d/yr by 30 yrs out
- Wind 1/10 Low 0% chance of damaging wind over 30 yrs
- Air quality 2/10 Low 0 unhealthy d/yr today · 2 by 30 yrs out
Nearby sold comps map
Loading sold comps map…
Walkable amenities ~0.75 mi
Loading nearby amenities…
Taxation est. · year 1
- Rental income
- $28,045
- − Mortgage interest
- −$16,245
- − Property taxes
- −$4,350
- − Insurance
- −$1,450
- − Repairs & maintenance
- −$2,244
- − Management
- −$2,244
- − Depreciation
- −$8,436
- Taxable loss
- −$6,923
- Est. tax savings @ 24.0%
- +$1,662
- After-tax cash flow
- $-233/yr
For passive investors: Depreciation is non-cash, so a rental often shows a tax loss while cash-flowing — sheltering income. Rental losses are passive: they offset passive income freely, and up to $25,000/yr can offset ordinary (W-2) income if you actively participate and your MAGI is under $100k (phasing out to $0 by $150k); unused losses carry forward. On sale, claimed depreciation is recaptured at up to 25%, and gains may owe capital-gains tax (a 1031 exchange can defer both). Figures are a year-1 estimate at your 24.0% rate — not tax advice; consult a CPA.
Condition & rehab AI · 12 photos
This move-in-ready manufactured home in a vibrant 55+ community offers a bright and airy living space with modern kitchen and two well-appointed bedrooms. It is in good condition with minimal maintenance required, and potential updates can significantly increase its value.
Value-add opportunities
- Both Painting the exterior and interior walls — Fresh paint can enhance curb appeal and interior aesthetics.
- Both Landscaping improvements — Enhanced landscaping can improve curb appeal and attract potential buyers/tenants.
- Both Updating flooring in living areas — Replacing carpet with hardwood or tile can increase both resale and rental value.
- Both Upgrading kitchen appliances — Modernizing the kitchen can attract more buyers/tenants and increase value.
- Both Adding smart home features — Smart home features can increase convenience and attract tech-savvy buyers/tenants.
- Both Upgrading lighting fixtures — Modern lighting can enhance the home's ambiance and increase its appeal.
- Both Adding a smart thermostat — A smart thermostat can improve energy efficiency and attract eco-conscious buyers/tenants.
Renovation cost estimate screening
Value-add ROI direction
- Both Painting the exterior and interior walls — Fresh paint can enhance curb appeal and interior aesthetics. ↑
- Both Landscaping improvements — Enhanced landscaping can improve curb appeal and attract potential buyers/tenants. ↑
- Both Updating flooring in living areas — Replacing carpet with hardwood or tile can increase both resale and rental value. ↑
- Both Upgrading kitchen appliances — Modernizing the kitchen can attract more buyers/tenants and increase value. ↑
- Both Adding smart home features — Smart home features can increase convenience and attract tech-savvy buyers/tenants. ↑
- Both Upgrading lighting fixtures — Modern lighting can enhance the home's ambiance and increase its appeal. ↑
- Both Adding a smart thermostat — A smart thermostat can improve energy efficiency and attract eco-conscious buyers/tenants. ↑
ⓘ Cost ranges are severity-bucket heuristics (US national rule-of-thumb). Get contractor quotes + a written scope before underwriting a rehab budget.
Schools (NCES district)
- District
- New Hartford Central School District
- NCES district ID
- 3620370
- Math proficiency
- 65% ▼ -7.00%
- Reading proficiency
- 76% ▲ 5.00%
- Median HH income
- $67,028
- Composite
- 61.37/100
- National rank
- #769
- State rank
- #128 of 590 in NY
Livability — Clark Mills
- Score
- 71/100
- State rank
- #383
- US rank
- #6606
Category grades
Schools grade is shown separately in the Schools card above.
Census & demographics
- City population
- 815
- Population (ZIP)
- 11,014
Population outlook (Oneida County) Hauer SSP2
- Today (2025)
- 225,223 people
- By 2030
- 220,384 · -2.1%
- By 2040
- 209,071 · -7.2%
- By 2050
- 197,920 · -12.1%
- By 2075
- 175,541 · -22.1%
- By 2100
- 148,491 · -34.1%
Race, ethnicity, and origin ACS 2023
- Neighborhood character
- Predominantly White (90%)
- Race & ethnicity
- White 90% Hispanic / Latino 4% Two or more races 3% Asian 2%
- Common ancestry
- Romanian 8% Lithuanian 3% Italian 2%
- Foreign-born
- 4% · Canada, China
- Languages at home
- 94% English-only · Spanish 2% Other Asian/Pacific 1% Other Indo-European 1%
Political lean MEDSL · Oneida
- 2024 margin
- Strong R (+21.3) · D 39.4% · R 60.6%
- 2008→2024 swing
- -15.2pp toward R · 2008: -6.1pp · 2024: -21.3pp
- All cycles
- 2024: R+21.3 2020: R+15.5 2016: R+21.1 2012: R+5.3 2008: R+6.1
Not yet ingested
- Civics
- —
Market trends
- HPI YoY
- ▼ -83.30%
- Current HPI
- 292.0471
- Rent YoY
- —
- Metro
- —
- State GDP YoY
- ▲ 2.60%
- F500 in state
- 92
Industry mix (Fortune 500 HQ in NY)
| Industry | F500 HQs | Revenue |
|---|---|---|
| Financial Services | 10 | $950B |
|
||
| Consumer Goods | 9 | $162B |
|
||
| Insurance | 4 | $225B |
|
||
| Telecommunications | 2 | $144B |
|
||
| Pharmaceuticals | 2 | $112B |
|
||
| Media / Entertainment | 2 | $69B |
|
||
Price history
1 event — show timeline
- 2026-06-15 Listed $290,000 CNYIS
Cash-flow waterfall
monthlySold comps — $/sqft
last 12 mo · ≤1 miLoading sold comps…