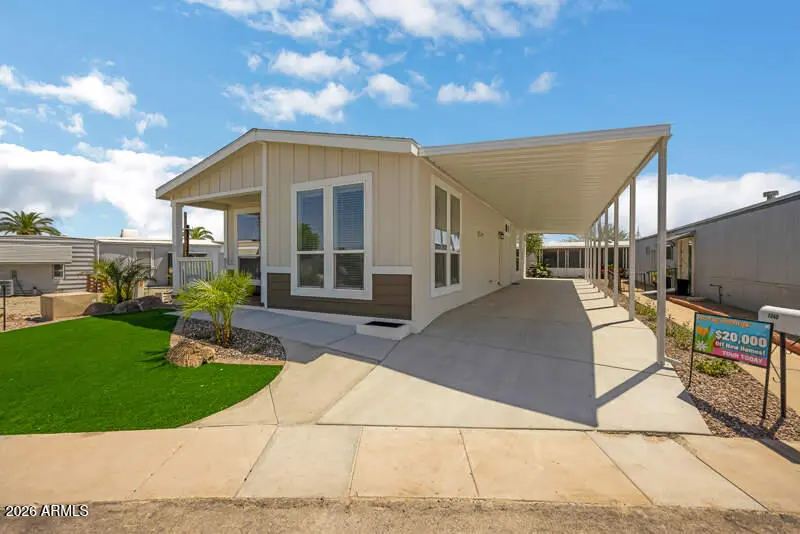
10201 N 99th Ave #104 · Peoria, AZ
Flood risk 1/10 · Minimal
- FEMA flood zone
- X (shaded)
- Chance of flooding over 30 yrs
- 0.0%
- Est. flood insurance / yr
- $507 – $1,088
Fire risk 1/10 · Minimal
- Est. fire insurance / yr
- $610 – $1,132
Heat risk 9/10 · Severe
- Hot days now (above 113°F)
- 6 days/yr
- Hot days in 30 yrs
- 16 days/yr
Wind risk 1/10 · Minimal
- Chance of severe wind over 30 yrs
- —
Air-quality risk 2/10 · Minimal
- Unhealthy air days now
- 1 days/yr
- Unhealthy air days in 30 yrs
- 1 days/yr
Risk factors via First Street. Map © Google.
Why this score? — see what drove the B+ grade
The composite is a weighted blend of 9 inputs, each scored 0–100. Each bar is that input's sub-score; the figure is the points it added to the 100-point composite (weight × sub-score).
- Cash flow +29.6/30.0
- ARV discount +15.0/15.0
- DSCR +10.0/10.0
- 1% rule +8.3/10.0
- Condition / age +4.0/5.0
- Livability +3.8/5.0
- Schools +3.5/10.0
- Rent growth +2.7/5.0
- Appreciation +0.0/10.0
$160,000
🖨 Deal sheet 📄 Offer letter ✓ Due diligence
Listing remarks MLS
ON LEASED LAND, This beautiful 2024-built manufactured home in a 55+ gated resort-style community! This 3-bedroom, 2-bath home features a modern open layout with a fenced in yard and covered patio. Enjoy amenities including a pool and spa, pickleball courts, and a dog park, with a new recreation center coming May 2026.
Key facts
- 2 parking spots
- Community pool
- Built 2024
Neighborhood map
What this means for you Summary
Snapshot
- This is a 3-bed/2.0-bath manufactured listed at $160k. Condition is rated good.
Deal economics
- At list price, monthly cash flow is $575 ($7k/yr) — positive.
- The deal already cash-flows at list — no discount required.
- Meets the 1% rule at list price ($2k rent vs $160k).
- Recommended offer: $155k (3.0% below list) — sets the bar for market timing.
- Cap rate 10.6% vs local median 3.3% in Peoria — top-decile yield for the area; either an underpriced asset or a hidden risk that comps aren't pricing in. Stress-test before assuming the spread holds.
Location & tenants
- Location reads 76/100 on livability (#14 in AZ, #3,603 nationally) — a middle-class / working-renter tenant base. Strengths: housing A+, commute A, employment A; Watch: cost of living C-, amenities D, health & safety F.
- Peoria Unified School District (4237) (suburban): math 36% / reading 42% proficiency, ranked #64 of 249 in AZ (top 26%) — families likely to look elsewhere, expect single-tenant / working-renter base with shorter leases.
- Market conditions: Rents flat; 333 active listings in the ZIP; 28 comparable units currently listed for rent nearby; rentals at typical pace (median 24d on market — plan ~3-4 weeks tenant-placement turnaround); 36,011 units permitted in Maricopa County in 2024 (12,801 in 5+ unit buildings).
- This rent runs 38% of the median local income ($67k/yr) — at the standard rent-burdened threshold; future hikes will face affordability resistance.
Forward outlook
- Local home prices are declining (-3.0%/yr); year-one equity from $1k of loan paydown is wiped out by about $5k of value loss. Plan a longer hold.
- Maricopa County population projected at +38% by 2050 — long-run rental-demand tailwind backs the buy-and-hold thesis.
Negotiation context
- It's been on market 45 days — a 3% lower offer ($155k) is reasonable based on typical stale-listing flexibility.
Risks & watch-outs
- Climate carrying-cost: extreme-heat days projected 6→16/yr by 2055 (HVAC capex compounding) — expect insurance premiums to compound above CPI over the hold.
Questions for the listing agent
- It's been on market 45 days. Have you received any prior offers? Is the seller open to a 3% concession, seller financing, or rate buy-down credit?
- Is there a deadline driving the sale (1031 exchange, divorce, estate, relocation)? That informs how much negotiation room exists.
- Schools are B-rated — typically a magnet for longer-tenancy family renters. What's the average tenant stay here, and is there a school-zone premium baked into asking?
- What's the average days-on-market for RENTAL listings here right now (not sales)? A rising rental-DOM trend means longer vacancies and softer asking-rent achievability than the comps imply.
- What's the recent tenant-quality profile in this submarket — average credit score on applications, eviction rate, late-payment / NSF rate, and stable-employment percentage? A property-management company in the area should have these aggregated.
- How much new for-sale + rental construction is in the pipeline within 1–3 miles? Heavy new supply typically softens prices + rents 12–24 months out; constrained supply supports both.
Investment metrics
- 1% rule
- 1.33% ✓
- Cap rate
- 10.61%
- Cash-on-cash
- 15.40%
- DSCR
- 1.69
- GRM
- 6.3
CMA / ARV
- ARV (median comp)
- $233,616
- List price
- $160,000
- Delta
- -31.51%
- Verdict
- UNDERPRICED
- Comps
- 12 within 1.0 mi
Show comp detail 12 sales within ~0.75 mi
| Address | Dist | Beds/Ba | Sqft | Sold | Price | $/sf | Match |
|---|---|---|---|---|---|---|---|
| 10701 N 99th Ave #61 | 0.46mi | 3/2.0 | 1,560 (-1%) | 14mo | $85,500 | $55 | 65 |
| 10701 N 99 Ave #209 | 0.49mi | 3/2.0 | 1,440 (-9%) | 1mo | $83,000 | $58 | 62 |
| 10701 N 99th Ave #22 | 0.51mi | 2/2.0 (-1) | 1,624 (+3%) | 7mo | $55,000 | $34 | 60 |
| 10701 N 99th Ave #186 | 0.46mi | 3/2.0 | 1,536 (-2%) | 18mo | $71,500 | $47 | 59 |
| 10701 N 99th Ave Lot 35 | 0.46mi | 3/2.0 | 1,620 (+3%) | 18mo | $111,000 | $69 | 59 |
| 11275 N 99th Ave #131 | 0.60mi | 3/2.0 | 1,746 (+11%) | 2mo | $270,000 | $155 | 52 |
| 11275 N 99th Ave #65 | 0.71mi | 3/2.0 | 1,696 (+8%) | 3mo | $265,000 | $156 | 51 |
| 11275 N 99th Ave #141 | 0.68mi | 3/1.8 | 1,570 (-0%) | 24mo | $325,000 | $207 | 47 |
| 11275 N 99th Ave #61 | 0.73mi | 3/2.0 | 1,402 (-11%) | 3mo | $268,500 | $192 | 46 |
| 11275 N 99th Ave #119 | 0.69mi | 3/2.0 | 1,392 (-12%) | 4mo | $265,000 | $190 | 45 |
| 11275 N 99th Ave #59 | 0.73mi | 3/2.0 | 1,681 (+7%) | 22mo | $306,000 | $182 | 37 |
| 11275 N 99th Ave #31 | 0.67mi | 3/2.0 | 1,345 (-15%) | 15mo | $281,000 | $209 | 32 |
Match score weights: distance 35% · size 25% · config 20% · recency 20%. Top-matched comps best support the ARV.
Projected returns pro-forma
-3.0% appreciation · 0.62% rent growth · sell at horizon
- IRR
- 3.4%
- Equity multiple
- 1.13×
- Total profit
- $5,757
- Equity at exit
- $23,857
- IRR
- 10.6%
- Equity multiple
- 1.73×
- Total profit
- $32,839
- Equity at exit
- $13,834
Cash invested: $44,800 (down + closing). Projections, not guarantees.
Landlord ↔ Tenant lean methodology
- Overall (STATE)
- 87 Strongly Landlord-Friendly
- State Arizona
- 87 Strongly Landlord-Friendly · R+3
- County
- — inherits STATE
- City
- — inherits STATE
ZIP-level market 85345
- Home prices YoY
- -19.8%
- Rents YoY
- 0.6%
- Active inventory
- 333
- Price-to-rent
- 6.3×
Monthly cashflow live
- Estimated rent
- $2,128 high interval (Pro) →
- Mortgage (P&I)
- −$839
- Tax est. 1.5%
- −$200 /mo · $2,400/yr
- Insurance
- −$67
- HOA
- −$0
- Vacancy / Maint / Mgmt
- −$447
- Net cashflow
- $575
Break-even live
UW: 25.0% down · 7.5% · 30yr · 1.5% tax · 5.0% vac · 8.0% maint · 8.0% mgmt
Financing live
Cash to close
- Down payment
- $40,000
- Closing costs
- $4,800
- Reserves months
- —
- Total cash needed
- —
Loan-product check · same deal, 3 products live
Conventional
25% down · 7.5% · 30yr
- Down + closing
- —
- Monthly P&I
- —
- Monthly cashflow
- —
- DSCR
- —
- Eligible?
- —
Personal DTI + credit; lowest rate.
DSCR
20% down · 8.5% · 30yr
- Down + closing
- —
- Monthly P&I
- —
- Monthly cashflow
- —
- DSCR
- —
- Eligible?
- —
No personal income docs; deal must DSCR.
Hard money
10% down · 12.0% · 12mo
- Down + closing
- —
- Monthly P&I
- —
- Monthly cashflow
- —
- DSCR
- —
- Eligible?
- —
Short-term bridge; refi at stabilization.
Rent comps 28 comps
| Address | Beds | Baths | Sqft | Rent | $/sqft | DOM | Units | Dist |
|---|---|---|---|---|---|---|---|---|
| 10104 N 96th Dr Unit A Peoria, AZ | 2.0 | 2.0 | 1072 | $1,750 | $1.63 | 24d | 1 | 0.36mi |
| 9626 W Mountain View Rd Unit A Peoria, AZ | 2.0 | 2.0 | 1156 | $1,500 | $1.30 | 43d | 1 | 0.41mi |
| 10316 N 94th Ln Peoria, AZ | 3.0 | 2.0 | 1352 | $2,000 | $1.48 | 24d | 1 | 0.50mi |
| 10022 W Lakeview Cir N Sun City, AZ | 2.0 | 2.0 | 1575 | $2,800 | $1.78 | 24d | 1 | 0.54mi |
| 9426 W Monroe St Peoria, AZ | 3.0 | 3.5 | 1405 | $1,800 | $1.28 | 16d | 1 | 0.55mi |
| 9427 W Ironwood Dr Peoria, AZ | 4.0 | 2.0 | 1591 | $1,944 | $1.22 | 10d | 1 | 0.59mi |
| 10350 W Camden Ave Sun City, AZ | 2.0 | 2.0 | 1413 | $2,850 | $2.02 | 24d | 1 | 0.66mi |
| 9323 W Ironwood Dr Peoria, AZ | 3.0 | 2.0 | 1306 | $2,085 | $1.60 | 43d | 1 | 0.69mi |
| 9323 W Ironwood Dr Peoria, AZ | 3.0 | 2.0 | 1306 | $1,985 | $1.52 | 23d | 1 | 0.69mi |
| 9096 N 97th Dr Peoria, AZ | 4.0 | 2.0 | 2151 | $2,195 | $1.02 | 23d | 1 | 0.69mi |
| 9311 W Carol Ave Peoria, AZ | 4.0 | 2.5 | 2178 | $2,195 | $1.01 | 43d | 1 | 0.81mi |
| 9625 W Olive Ave Peoria, AZ | 1.0–3.0 | 1.0–3.0 | 1485 | $2,674 | $1.80 | 5d | 7 | 0.89mi |
| 9221 W Gary Rd Peoria, AZ | 4.0 | 1.0 | 1300 | $2,000 | $1.54 | 43d | 1 | 1.06mi |
| 10101 N 91st Ave #109 Peoria, AZ | 2.0 | 2.5 | 1161 | $1,395 | $1.20 | 2d | 1 | 1.06mi |
| 9002 W Malapai Dr Peoria, AZ | 3.0 | 2.0 | 1270 | $2,040 | $1.61 | 20d | 1 | 1.10mi |
| 10421 W Puget Ave Peoria, AZ | 3.0 | 2.0 | 1424 | $1,750 | $1.23 | 24d | 1 | 1.13mi |
| 8930 W Monroe St Peoria, AZ | 3.0 | 2.0 | 1300 | $1,899 | $1.46 | 43d | 2 | 1.15mi |
| 8930 W Monroe St Peoria, AZ | 3.0 | 2.0 | 1300 | $2,099 | $1.61 | 23d | 1 | 1.15mi |
| 11411 N 91st Ave Unit 134 Peoria, AZ | 3.0 | 2.0 | 1310 | $1,599 | $1.22 | 43d | 1 | 1.27mi |
| 8940 W Olive Ave Peoria, AZ | 2.0 | 2.0 | 1446 | $1,600 | $1.11 | 43d | 1 | 1.30mi |
| 8834 W Purdue Ave Peoria, AZ | 3.0 | 2.0 | 1319 | $1,800 | $1.36 | 3d | 1 | 1.30mi |
| 10729 W Sun City Blvd Sun City, AZ | 3.0 | 2.0 | 1697 | $3,500 | $2.06 | 24d | 1 | 1.35mi |
| 9607 N 88th Dr Peoria, AZ | 4.0 | 2.0 | 1541 | $1,989 | $1.29 | 20d | 1 | 1.36mi |
| 8821 W Sahuaro Dr Peoria, AZ | 3.0 | 2.0 | 1074 | $1,595 | $1.49 | 2d | 1 | 1.38mi |
| 8821 W Sahuaro Dr Peoria, AZ | 3.0 | 2.0 | 1074 | $1,595 | $1.49 | 24d | 1 | 1.38mi |
| 10846 N 109th Ave Sun City, AZ | 3.0 | 2.0 | 1623 | $3,500 | $2.16 | 12d | 1 | 1.38mi |
| 10221 N 87th Ln Peoria, AZ | 3.0 | 2.0 | 1232 | $2,059 | $1.67 | 43d | 1 | 1.39mi |
| 9514 W El Caminito Dr Peoria, AZ | 3.0 | 2.0 | 1382 | $1,850 | $1.34 | 43d | 1 | 1.42mi |
Listing history 16 events
-
2026-06-18days on market $160,000 Active 45 DOM
-
2026-06-17days on market $160,000 Active 44 DOM
-
2026-06-16days on market $160,000 Active 43 DOM
-
2026-06-15days on market $160,000 Active 42 DOM
-
2026-06-13days on market $160,000 Active 40 DOM
-
2026-06-13days on market $160,000 Active 39 DOM
-
2026-06-09days on market $160,000 Active 36 DOM
-
2026-06-08days on market $160,000 Active 35 DOM
-
2026-06-07days on market $160,000 Active 34 DOM
-
2026-06-04days on market $160,000 Active 31 DOM
-
2026-06-03days on market $160,000 Active 30 DOM
-
2026-06-02days on market $160,000 Active 29 DOM
-
2026-06-01days on market $160,000 Active 28 DOM
-
2026-05-31days on market $160,000 Active 27 DOM
-
2026-05-05$160,000 Active 320-char remark
Show marketing remark (320 chars)
ON LEASED LAND, This beautiful 2024-built manufactured home in a 55+ gated resort-style community! This 3-bedroom, 2-bath home features a modern open layout with a fenced in yard and covered patio. Enjoy amenities including a pool and spa, pickleball courts, and a dog park, with a new recreation center coming May 2026.
-
2026-04-17price $160,000 320-char remark
Show marketing remark (320 chars)
ON LEASED LAND, This beautiful 2024-built manufactured home in a 55+ gated resort-style community! This 3-bedroom, 2-bath home features a modern open layout with a fenced in yard and covered patio. Enjoy amenities including a pool and spa, pickleball courts, and a dog park, with a new recreation center coming May 2026.
ⓘ Source: listings_history table (triggers on properties + properties_extension) + one-shot
backfill from property_details.listing_events for pre-trigger history.
Climate risk First Street
- Flood 1/10 Low FEMA zone X (shaded) · 0% chance over 30 yrs
- Wildfire 1/10 Low
- Heat 9/10 Extreme 6 d/yr ≥113°F today · 16 d/yr by 30 yrs out
- Wind 1/10 Low
- Air quality 2/10 Low 1 unhealthy d/yr today · 1 by 30 yrs out
Nearby sold comps map
Loading sold comps map…
Walkable amenities ~0.75 mi
Loading nearby amenities…
Taxation est. · year 1
- Rental income
- $25,532
- − Mortgage interest
- −$8,962
- − Property taxes
- −$2,400
- − Insurance
- −$800
- − Repairs & maintenance
- −$2,043
- − Management
- −$2,043
- − Depreciation
- −$4,655
- Taxable income
- $4,630
- Est. tax owed @ 24.0%
- −$1,111
- After-tax cash flow
- $5,790/yr
For passive investors: Depreciation is non-cash, so a rental often shows a tax loss while cash-flowing — sheltering income. Rental losses are passive: they offset passive income freely, and up to $25,000/yr can offset ordinary (W-2) income if you actively participate and your MAGI is under $100k (phasing out to $0 by $150k); unused losses carry forward. On sale, claimed depreciation is recaptured at up to 25%, and gains may owe capital-gains tax (a 1031 exchange can defer both). Figures are a year-1 estimate at your 24.0% rate — not tax advice; consult a CPA.
Condition & rehab AI · 12 photos
This 2024-built manufactured home in a 55+ gated community is in good condition with a modern kitchen and bathrooms. It has a fenced yard and a covered patio, making it a great option for those looking for a move-in-ready home.
Value-add opportunities
- Both Painting the exterior and interior walls — Fresh paint can enhance the curb appeal and interior aesthetics
- Both Landscaping improvements — Enhanced landscaping can increase curb appeal and attract more potential buyers
- Resale Upgrading the kitchen appliances — Modern appliances can make the kitchen more appealing to potential buyers
- Resale Upgrading the bathroom fixtures — Upgraded fixtures can make the bathroom more appealing to potential buyers
Renovation cost estimate screening
Value-add ROI direction
- Both Painting the exterior and interior walls — Fresh paint can enhance the curb appeal and interior aesthetics ↑
- Both Landscaping improvements — Enhanced landscaping can increase curb appeal and attract more potential buyers ↑
- Resale Upgrading the kitchen appliances — Modern appliances can make the kitchen more appealing to potential buyers ↑
- Resale Upgrading the bathroom fixtures — Upgraded fixtures can make the bathroom more appealing to potential buyers ↑
ⓘ Cost ranges are severity-bucket heuristics (US national rule-of-thumb). Get contractor quotes + a written scope before underwriting a rehab budget.
Schools (NCES district)
- District
- Peoria Unified School District (4237)
- NCES district ID
- 0406250
- Math proficiency
- 36% ▼ -14.00%
- Reading proficiency
- 42% ▼ -8.00%
- Median HH income
- $60,171
- Composite
- 34.62/100
- National rank
- #5152
- State rank
- #64 of 249 in AZ
Livability — Peoria
- Score
- 76/100
- State rank
- #14
- US rank
- #3603
Category grades
Schools grade is shown separately in the Schools card above.
Census & demographics
- Census place
- Peoria, AZ
- County
- Maricopa County · 4,537,380 people
- City population
- 206,687
- Metro
- Phoenix-Mesa-Chandler, AZ
- Population (ZIP)
- 60,918
- Household income
- $67,380
- Rent vs Own
- Severe rent burden
- 1879.0
Population outlook (Maricopa County) Hauer SSP2
- Today (2025)
- 4,979,203 people
- By 2030
- 5,378,229 · +8.0%
- By 2040
- 6,156,598 · +23.6%
- By 2050
- 6,872,376 · +38.0%
- By 2075
- 8,401,270 · +68.7%
- By 2100
- 9,247,439 · +85.7%
Race, ethnicity, and origin ACS 2023
- Neighborhood character
- Diverse neighborhood (Simpson 0.62)
- Race & ethnicity
- White 51% Hispanic / Latino 34% Two or more races 14% Black 5% Asian 4% Native American 2%
- Hispanic origin (detail)
- Mexican 29%
- Common ancestry
- Romanian 2% Italian 2% Slovak 1%
- Foreign-born
- 13% · Canada, Vietnam
- Languages at home
- 76% English-only · Spanish 18% Other Indo-European 1% Vietnamese 1%
Political lean MEDSL · Maricopa
- 2024 margin
- Toss-up / Even · D 47.7% · R 51.2% · Other 1.1%
- 2008→2024 swing
- +7.1pp toward D · 2008: -10.6pp · 2024: -3.5pp
- All cycles
- 2024: R+3.5 2020: D+2.2 2016: R+3.5 2012: R+12.0 2008: R+10.6
Not yet ingested
- Civics
- —
Market trends
- HPI YoY
- ▼ -80.77%
- Current HPI
- 328.1069
- Rent YoY
- ▲ 0.62%
- Metro
- Phoenix-Mesa-Chandler, AZ
- State GDP YoY
- ▲ 4.54%
- F500 in state
- 20
Industry mix (Fortune 500 HQ in AZ)
| Industry | F500 HQs | Revenue |
|---|---|---|
| Technology | 2 | $13B |
|
||
| Mining / Metals | 1 | $23B |
|
||
| Environmental Services | 1 | $16B |
|
||
| Metals / Steel | 1 | $14B |
|
||
| Technology Distribution | 1 | $9B |
|
||
| Homebuilding | 1 | $8B |
|
||
Price history
+0.0% since first listed2 events — show timeline
- 2026-05-05 Listed $160,000 ARMLS
- 2026-04-17 Price Changed $160,000 ARMLS
Cash-flow waterfall
monthlySold comps — $/sqft
last 12 mo · ≤1 miLoading sold comps…