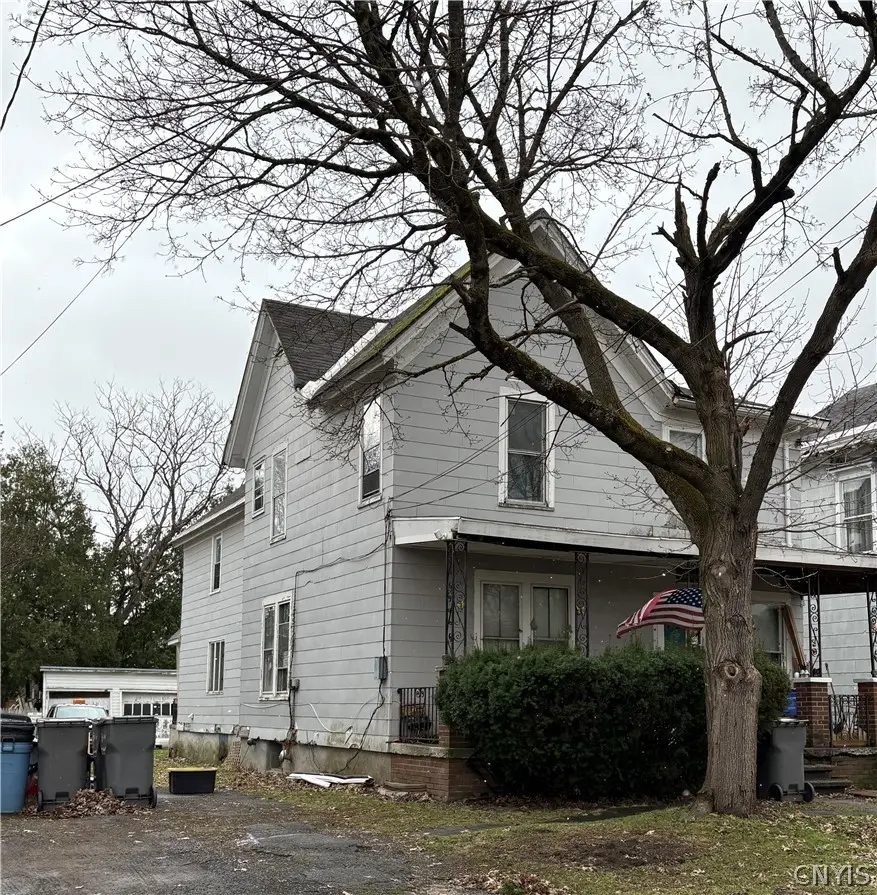
 Triplex
720 N Madison St · Rome, NY
Flood risk 5/10 · Moderate
- FEMA flood zone
- X (unshaded)
- Chance of flooding over 30 yrs
- 0.65%
- Est. flood insurance / yr
- $473 – $860
Fire risk 1/10 · Minimal
- Est. fire insurance / yr
- $691 – $1,283
Heat risk 3/10 · Minor
- Hot days now (above 94°F)
- 7 days/yr
- Hot days in 30 yrs
- 17 days/yr
Wind risk 1/10 · Minimal
- Chance of severe wind over 30 yrs
- —
Air-quality risk 2/10 · Minimal
- Unhealthy air days now
- 0 days/yr
- Unhealthy air days in 30 yrs
- 1 days/yr
Risk factors via First Street. Map © Google.
Why this score? — see what drove the B grade
The composite is a weighted blend of 9 inputs, each scored 0–100. Each bar is that input's sub-score; the figure is the points it added to the 100-point composite (weight × sub-score).
- Cash flow +30.0/30.0
- ARV discount +11.8/15.0
- 1% rule +10.0/10.0
- DSCR +10.0/10.0
- Schools +3.5/10.0
- Livability +3.2/5.0
- Rent growth +2.5/5.0
- Condition / age +2.5/5.0
- Appreciation +0.0/10.0
$107,000
🖨 Deal sheet (PDF) 📄 Offer letter ✓ Due diligence
Multi-family units
County records classify this as Multi-Family (2-4 Unit). Listing-text estimate: 3 units. confirmed
Listing remarks
Excellent investment opportunity featuring three units: a two-bedroom unit on first floor, along with one studio and one one-bedroom units on the upper level. Vacant. Property Sold As Is
Key facts
- 7,405 sq ft lot
- 4 garage spots
- Built 1930
Property features AI
Finance
- Financial info: Property contains three total units with separate gas and electric meters for each unit; Tenants pay all utilities; Operating expenses include insurance (see remarks)
Exterior
- Parking: Attached garage with 4 spaces
- Utilities: Public water connected; Sewer connected
- Home design: Two-story building; Resale property
- Construction: Vinyl siding; Asphalt roof
- Exterior features: Rectangular residential lot with 50 x 154 dimensions; City street frontage; Paved parking
Interior
- Kitchen: Eat-in kitchen in one unit
- Bedrooms: One 1-bedroom unit; One 2-bedroom unit
- Bathrooms: Three full bathrooms (total across property)
- Heating & cooling: Gas forced-air heating
- Interior features: Full basement
- Laundry & utility: Electric water heater
Neighborhood map
What this means for you Summary
Snapshot
- This is a 1×2bd/1.0ba + 2×1bd/1.0ba units multifamily listed at $107k.
Deal economics
- At list price, monthly cash flow is $1k ($13k/yr) — positive. Per door: $367/mo.
- The deal already cash-flows at list — no discount required.
- Meets the 1% rule at list price ($2k rent vs $107k).
- Recommended offer: $105k (1.5% below list) — sets the bar for market timing.
- Cap rate 18.6% vs local median 5.7% in Rome — top-decile yield for the area; either an underpriced asset or a hidden risk that comps aren't pricing in. Stress-test before assuming the spread holds.
Location & tenants
- Location reads 64/100 on livability (#722 in NY) — a middle-class / working-renter tenant base. Strengths: cost of living A+, housing A+; Watch: health & safety C-, schools F, amenities F.
- Rome City School District (town): math 35% / reading 46% proficiency, ranked #516 of 590 in NY (top 88%) — families likely to look elsewhere, expect single-tenant / working-renter base with shorter leases.
- Market conditions: 276 active listings in the ZIP; 1 comparable units currently listed for rent nearby; 204 units permitted in Oneida County in 2024 (68 in 5+ unit buildings).
Forward outlook
- Local home prices are declining (-3.0%/yr); year-one equity from $740 of loan paydown is wiped out by about $3k of value loss. Plan a longer hold.
- Oneida County population projected at -12% by 2050 — secular population decline; favor cash flow + early exit over multi-decade hold.
- At projected returns (-3.0% appreciation + 3.0% rent growth), your $30k cash investment doubles in ~3 years — after that, you're playing with house money.
Negotiation context
- It's been on market 29 days — a 2% lower offer ($105k) is reasonable based on typical stale-listing flexibility.
- 4 sale attempts since 22y ago with the ask held roughly flat each time — persistent listings suggest the price (not the market) is what's stuck; bring a comps-based counter.
- Current owner paid $50k; list at $107k implies a 114% gain — meaningful room to come down on a strong offer.
Risks & watch-outs
- Watch-outs: built in 1930 — expect roof / HVAC / electrical / plumbing capex.
- Climate carrying-cost: moderate flood risk — expect insurance premiums to compound above CPI over the hold.
Questions for the listing agent
- Can we see the unit-by-unit rent roll, current vacancy, and any below-market leases? What's the average tenancy length?
- What capital expenditures (roof, boiler, parking lot, exteriors) have been made in the last 5 years, and what's planned in the next 2?
- Built in 1930 — when were the roof, HVAC, electrical panel, plumbing, and water heater last replaced?
- Is there a deadline driving the sale (1031 exchange, divorce, estate, relocation)? That informs how much negotiation room exists.
- Schools are F-rated, which usually means shorter tenancies and higher turnover. Who's the typical renter profile here, and what's been the actual vacancy rate?
- What's the average days-on-market for RENTAL listings here right now (not sales)? A rising rental-DOM trend means longer vacancies and softer asking-rent achievability than the comps imply.
- What's the recent tenant-quality profile in this submarket — average credit score on applications, eviction rate, late-payment / NSF rate, and stable-employment percentage? A property-management company in the area should have these aggregated.
- How much new apartment / multifamily construction is in the pipeline within 1–3 miles? Heavy new supply (>2% of stock underway) typically softens rents 12–24 months out; light construction supports rent growth.
Investment metrics
- 1% rule
- 2.27% ✓
- Cap rate
- 18.63%
- Cash-on-cash
- 44.07%
- DSCR
- 2.96
- GRM
- 3.7
CMA / ARV
- ARV (on-the-fly)
- $118,188
- Comps found
- 12
Show comp detail 12 sales within ~0.75 mi
| Address | Dist | Beds/Ba | Sqft | Sold | Price | $/sf | Match |
|---|---|---|---|---|---|---|---|
| 408 N Madison St | 0.37mi | 4/2.0 | 2,412 (0%) | 2mo | $70,000 | $29 | 78 |
| 418 W Bloomfield St | 0.20mi | 5/2.0 (+1) | 2,378 (-1%) | 18mo | $144,000 | $61 | 64 |
| 413 W Thomas St | 0.35mi | 5/2.0 (+1) | 2,220 (-8%) | 8mo | $48,000 | $22 | 55 |
| 109 Stanwix St | 0.63mi | 3/2.0 (-1) | 2,511 (+4%) | 6mo | $122,000 | $49 | 50 |
| 504 N Washington St | 0.40mi | 4/2.0 | 2,262 (-6%) | 21mo | $60,000 | $27 | 50 |
| 419 W Thomas St | 0.35mi | 4/2.0 | 2,200 (-9%) | 20mo | $77,000 | $35 | 49 |
| 425 W Bloomfield St | 0.24mi | 4/2.0 | 2,106 (-13%) | 20mo | $218,000 | $104 | 47 |
| 103 Stanwix St | 0.61mi | 5/2.0 (+1) | 2,569 (+6%) | 8mo | $92,700 | $36 | 45 |
| 106 E Embargo St | 0.59mi | 4/2.0 | 2,102 (-13%) | 6mo | $74,000 | $35 | 42 |
| 619 W Thomas St | 0.49mi | 5/2.0 (+1) | 2,154 (-11%) | 11mo | $140,000 | $65 | 41 |
| 504 Floyd Ave | 0.70mi | 5/2.0 (+1) | 2,366 (-2%) | 18mo | $169,950 | $72 | 40 |
| 223 E Bloomfield St | 0.64mi | 5/2.0 (+1) | 2,265 (-6%) | 19mo | $142,994 | $63 | 35 |
Match score weights: distance 35% · size 25% · config 20% · recency 20%. Top-matched comps best support the ARV.
Projected returns pro-forma
-3.0% appreciation · 3.0% rent growth · sell at horizon
- IRR
- 41.1%
- Equity multiple
- 2.76×
- Total profit
- $52,825
- Equity at exit
- $15,954
- IRR
- 47.3%
- Equity multiple
- 5.56×
- Total profit
- $136,587
- Equity at exit
- $9,251
Cash invested: $29,960 (down + closing). Projections, not guarantees.
Landlord ↔ Tenant lean methodology
- Overall (STATE)
- 15 Strongly Tenant-Friendly
- State New York
- 15 Strongly Tenant-Friendly · D+10
- County
- — inherits STATE
- City
- — inherits STATE
ZIP-level market 13440
- Home prices YoY
- -8.0%
- Active inventory
- 276
- Price-to-rent
- 9.9×
Monthly cashflow live
- Estimated rent
- $2,432 medium interval (Pro) →
- Mortgage (P&I)
- −$561
- Tax from tax record
- −$215 /mo · $2,584/yr
- Insurance
- −$45
- HOA
- −$0
- Vacancy / Maint / Mgmt
- −$511
- Net cashflow
- $1,100
Break-even live
Sensitivity live
| Price | -10% $1,161 | -5% $1,131 | +0% $1,100 | +5% $1,070 | +10% $1,040 |
|---|---|---|---|---|---|
| Rent | -10% $908 | -5% $1,004 | +0% $1,100 | +5% $1,196 | +10% $1,292 |
| Rate | -1.0pp $1,154 | -0.5pp $1,127 | base $1,100 | +0.5pp $1,073 | +1.0pp $1,044 |
3-unit breakdown (identical units grouped — click to expand)
| Units | Beds | Baths | Est. rent |
|---|---|---|---|
| 1× unit | 2 | 1 | $904 |
| 2× units | 1 | 1 | $1,528 |
| #2 | 1 | 1 | $764 |
| #3 | 1 | 1 | $764 |
| Total (3 units) | $2,432 | ||
UW: 25.0% down · 7.5% · 30yr · 1.5% tax · 5.0% vac · 8.0% maint · 8.0% mgmt
Financing live
Cash to close
- Down payment
- $26,750
- Closing costs
- $3,210
- Reserves months
- —
- Total cash needed
- —
Loan-product check · same deal, 3 products live
Conventional
25% down · 7.5% · 30yr
- Down + closing
- —
- Monthly P&I
- —
- Monthly cashflow
- —
- DSCR
- —
- Eligible?
- —
Personal DTI + credit; lowest rate.
DSCR
20% down · 8.5% · 30yr
- Down + closing
- —
- Monthly P&I
- —
- Monthly cashflow
- —
- DSCR
- —
- Eligible?
- —
No personal income docs; deal must DSCR.
Hard money
10% down · 12.0% · 12mo
- Down + closing
- —
- Monthly P&I
- —
- Monthly cashflow
- —
- DSCR
- —
- Eligible?
- —
Short-term bridge; refi at stabilization.
Rent comps 1 comps
| Address | Beds | Baths | Sqft | Rent | $/sqft | DOM | Units | Dist |
|---|---|---|---|---|---|---|---|---|
| 251 Liam Ln Unit 251 Rome, NY | 3.0 | 2.0 | 1577 | $2,750 | $1.74 | 44d | 1 | 1.20mi |
Listing history 10 events
-
2026-05-05status Pending
-
2026-04-06$107,000 Active
-
2015-02-17soldstatus $50,000
-
2014-09-20historical
-
2014-03-20$50,000
-
2014-03-03historical
-
2013-09-12$59,900
-
2006-04-04soldstatus $58,500
-
2006-03-28soldstatus $62,010
-
2004-12-31$64,900
ⓘ Source: listings_history table (triggers on properties + properties_extension) + one-shot
backfill from property_details.listing_events for pre-trigger history.
Tax reassessment forecast NY · Partial reset (capped growth)
- Current annual tax
- $2,584 · $215/mo
- Projected year-2 tax
- $2,584 · $215/mo
- Expected delta
- $0/yr ($0/mo · 0.0%)
ⓘ Screening estimate from a state-policy table — verify with the county assessor before closing.
Climate risk First Street
- Flood 5/10 Major FEMA zone X (unshaded) · 65% chance over 30 yrs
- Wildfire 1/10 Low
- Heat 3/10 Moderate 7 d/yr ≥94°F today · 17 d/yr by 30 yrs out
- Wind 1/10 Low
- Air quality 2/10 Low 0 unhealthy d/yr today · 1 by 30 yrs out
Nearby sold comps map
Loading sold comps map…
Walkable amenities ~0.75 mi
Loading nearby amenities…
Taxation est. · year 1
- Rental income
- $29,184
- − Mortgage interest
- −$5,994
- − Property taxes
- −$2,584
- − Insurance
- −$535
- − Repairs & maintenance
- −$2,335
- − Management
- −$2,335
- − Depreciation
- −$3,113
- Taxable income
- $12,289
- Est. tax owed @ 24.0%
- −$2,949
- After-tax cash flow
- $10,254/yr
For passive investors: Depreciation is non-cash, so a rental often shows a tax loss while cash-flowing — sheltering income. Rental losses are passive: they offset passive income freely, and up to $25,000/yr can offset ordinary (W-2) income if you actively participate and your MAGI is under $100k (phasing out to $0 by $150k); unused losses carry forward. On sale, claimed depreciation is recaptured at up to 25%, and gains may owe capital-gains tax (a 1031 exchange can defer both). Figures are a year-1 estimate at your 24.0% rate — not tax advice; consult a CPA.
Schools (NCES district)
- District
- Rome City School District
- NCES district ID
- 3624900
- Math proficiency
- 35% ▼ -4.00%
- Reading proficiency
- 46% ▲ 10.00%
- Median HH income
- $46,406
- Composite
- 34.52/100
- National rank
- #5178
- State rank
- #516 of 590 in NY
Livability — Rome
- Score
- 64/100
- State rank
- #722
- US rank
- #13676
Category grades
Schools grade is shown separately in the Schools card above.
Census & demographics
- Census place
- Rome, NY
- City population
- 41,418
- Population (ZIP)
- 41,273
Population outlook (Oneida County) Hauer SSP2
- Today (2025)
- 225,223 people
- By 2030
- 220,384 · -2.1%
- By 2040
- 209,071 · -7.2%
- By 2050
- 197,920 · -12.1%
- By 2075
- 175,541 · -22.1%
- By 2100
- 148,491 · -34.1%
Race, ethnicity, and origin ACS 2023
- Neighborhood character
- Predominantly White (82%)
- Race & ethnicity
- White 82% Hispanic / Latino 7% Two or more races 6% Black 4% Asian 1%
- Hispanic origin (detail)
- Mexican 1% Puerto Rican 4%
- Common ancestry
- Romanian 9% Lithuanian 4% Slovak 1%
- Foreign-born
- 3% · Canada, China
- Languages at home
- 94% English-only · Spanish 3% Other Indo-European 1%
Political lean MEDSL · Oneida
- 2024 margin
- Strong R (+21.3) · D 39.4% · R 60.6%
- 2008→2024 swing
- -15.2pp toward R · 2008: -6.1pp · 2024: -21.3pp
- All cycles
- 2024: R+21.3 2020: R+15.5 2016: R+21.1 2012: R+5.3 2008: R+6.1
Not yet ingested
- Civics
- —
Market trends
- HPI YoY
- ▼ -29.58%
- Current HPI
- 339.3589
- Rent YoY
- —
- Metro
- —
- State GDP YoY
- ▲ 2.60%
- F500 in state
- 92
Industry mix (Fortune 500 HQ in NY)
| Industry | F500 HQs | Revenue |
|---|---|---|
| Financial Services | 10 | $950B |
|
||
| Consumer Goods | 9 | $162B |
|
||
| Insurance | 4 | $225B |
|
||
| Telecommunications | 2 | $144B |
|
||
| Pharmaceuticals | 2 | $112B |
|
||
| Media / Entertainment | 2 | $69B |
|
||
Price history
+64.9% since first listed10 events — show timeline
- 2026-05-05 Pending — CNYIS
- 2026-04-06 Listed $107,000 CNYIS
- 2015-02-17 Sold (Public Records) $50,000 Public Records
- 2014-09-20 Listing Removed — CNYIS
- 2014-03-20 Listed $50,000 CNYIS
- 2014-03-03 Listing Removed — CNYIS
- 2013-09-12 Listed $59,900 CNYIS
- 2006-04-04 Sold (MLS) $58,500 CNYIS
- 2006-03-28 Sold (Public Records) $62,010 Public Records
- 2004-12-31 Listed $64,900 CNYIS
Property tax history
+1.7%/yrLatest (2025): $2,584 · +0.3% YoY. Source: county tax records.
Cash-flow waterfall
monthlySold comps — $/sqft
last 12 mo · ≤1 miLoading sold comps…