1279 Guelbreth Ln #207 · Creve Coeur, MO
Flood risk 1/10 · Minimal
- FEMA flood zone
- X (unshaded)
- Chance of flooding over 30 yrs
- 0.0%
- Est. flood insurance / yr
- $507 – $1,088
Fire risk 1/10 · Minimal
- Est. fire insurance / yr
- $1,054 – $1,958
Heat risk 5/10 · Moderate
- Hot days now (above 106°F)
- 7 days/yr
- Hot days in 30 yrs
- 21 days/yr
Wind risk 2/10 · Minimal
- Chance of severe wind over 30 yrs
- 1.0%
Air-quality risk 2/10 · Minimal
- Unhealthy air days now
- 1 days/yr
- Unhealthy air days in 30 yrs
- 3 days/yr
Risk factors via First Street. Map © Google.
Why this score? — see what drove the D grade
The composite is a weighted blend of 9 inputs, each scored 0–100. Each bar is that input's sub-score; the figure is the points it added to the 100-point composite (weight × sub-score).
- ARV discount +10.1/15.0
- Appreciation +10.0/10.0
- 1% rule +4.9/10.0
- Cash flow +4.0/30.0
- Livability +4.0/5.0
- Schools +3.4/10.0
- Condition / age +2.5/5.0
- Rent growth +1.8/5.0
- DSCR +0.0/10.0
$129,900
🖨 Deal sheet 📄 Offer letter ✓ Due diligence
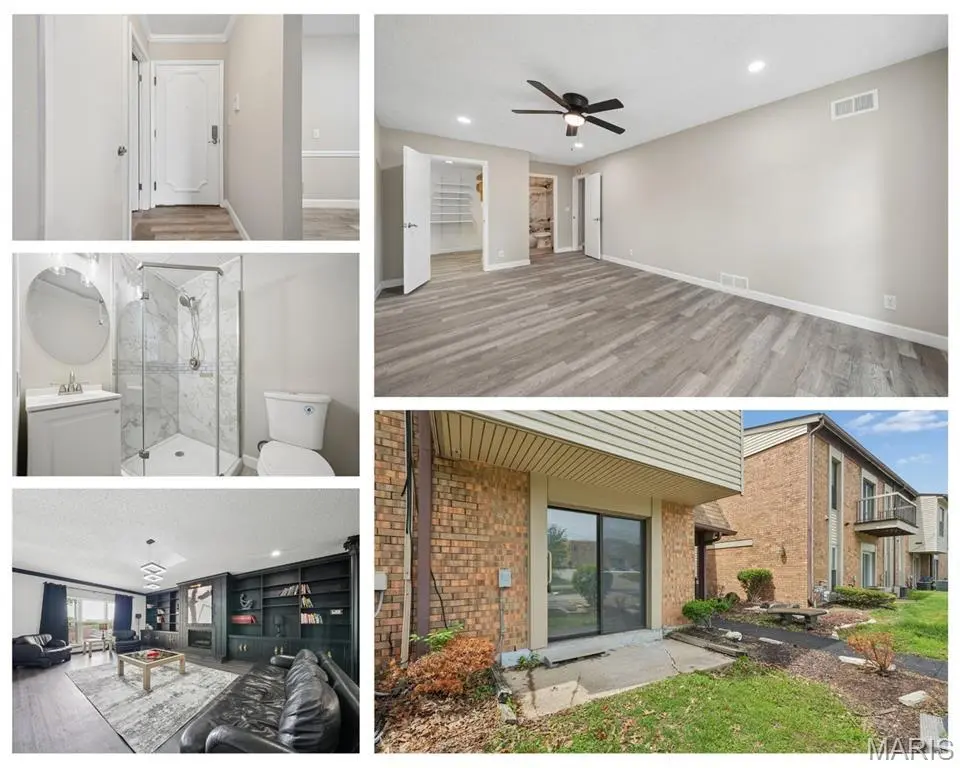
Listing remarks
Welcome home to this beautifully updated 2-bedroom, 2-bath condo. Perfectly situated near the JCC, which offers a full fitness center, aquatics, and community programming. Key amenities include a full fitness center, indoor/outdoor pools, 150+ weekly group exercise classes (Yoga, Zumba, Spin), a Pilates studio, sauna/steam rooms, youth sports, early childhood education, and summer day camps! Just minutes from everything West County and Creve Coeur have to offer. Step inside to find brand-new flooring throughout and a completely renovated and gorgeous kitchen featuring all-new stainless steel appliances, including a refrigerator, microwave, electric glass-top range/stove, and dishwasher. The
Key facts
- $551 HOA
- Built 1970
- Listed 50 days
Property features AI
Finance
- Financial info: Lease not considered
- HOA & community: The Doral Manor Association; Monthly HOA fee; HOA amenities: elevator(s), game room, laundry, meeting room, parking, party room; HOA covers grounds maintenance, sewer, trash, and water
Exterior
- Parking: Community parking (association provides parking)
- Utilities: Public water; Public sewer; Electric service by Ameren; Cable available
- Home design: Residential condominium; One level
- Construction: Brick and shingle siding exterior
- Exterior features: Level lot
Interior
- Kitchen: Stainless steel appliances
- Bedrooms: 2 bedrooms (both on the main level)
- Bathrooms: 2 full bathrooms (main level)
- Heating & cooling: Electric heating; Central air conditioning
- Interior features: Stainless steel appliances; Fire alarm; Lighting; Patio; Storage; Full basement
- Laundry & utility: Laundry in basement
Neighborhood map
What this means for you Summary
Snapshot
- This is a 1-bed/1.0-bath condo listed at $130k.
Deal economics
- At list price, monthly cash flow is $-363 ($-4k/yr) — negative.
- To cash-flow at today's rent, offer at most $66k (49.4% below list).
- To meet the 1% rule (rent ≥ 1% of price), the offer needs to be $128k (1.1% below list).
- Recommended offer: $66k (49.4% below list) — sets the bar for cash-flow.
Location & tenants
- Location reads 81/100 on livability (#16 in MO, #1,519 nationally) — a professional / high-income tenant draw. Strengths: employment A+, housing A+, commute A-; Watch: amenities C-, cost of living F.
- Pattonville R-III (suburban): math 32% / reading 46% proficiency, ranked #147 of 324 in MO (top 45%) — families likely to look elsewhere, expect single-tenant / working-renter base with shorter leases.
- Zoned schools: Willow Brook Elem. (math 42% / reading 47%, grade F, #413 of 1,115 statewide, top 42%, 470 students, 40% FRL); Pattonville Sr. High (math 33% / reading 64%, grade D, #147 of 521 statewide, top 29%, 1,893 students, 39% FRL) — zoned schools at 40% FRL track the district average.
- Market conditions: Rents soft (-3.0%/yr); 170 active listings in the ZIP; 12 comparable units currently listed for rent nearby; rentals lingering (median 44d on market — plan ~5-8 weeks vacancy on turnover, expect pricing pressure); 50% of comp listings sitting > 30 days — soft ceiling on asking rent; solid renter incomes; 920 units permitted in St. Louis County in 2024 (250 in 5+ unit buildings).
Forward outlook
- In year one you build about $14k of equity ($898 loan paydown + $13k appreciation (10.0% local appreciation)).
- By year 3, paydown + projected appreciation supports a ~$35k cash-out refi (75% LTV) — recoverable capital for the next deal without selling this one.
Negotiation context
- It's been on market 51 days — a 3% lower offer ($126k) is reasonable based on typical stale-listing flexibility.
- Current owner paid $69k; list at $130k implies a 88% gain — meaningful room to come down on a strong offer.
Risks & watch-outs
- Watch-outs: HOA is 43% of rent.
- Climate carrying-cost: extreme-heat days projected 7→21/yr by 2055 (HVAC capex compounding) — expect insurance premiums to compound above CPI over the hold.
Questions for the listing agent
- What do current leases actually rent for vs. the listed asking? Can we see a recent rent roll and the last 12 months of T-12 income?
- It's been on market 51 days. Have you received any prior offers? Is the seller open to a 49% concession, seller financing, or rate buy-down credit?
- Built in 1970 — when were the roof, HVAC, electrical panel, plumbing, and water heater last replaced?
- What does the HOA fee cover, when was the last increase, and are there any pending special assessments or reserve-fund shortfalls?
- Any open or pending special assessments — roof, HVAC, plumbing, elevator, façade? What's the per-unit balance and payoff schedule, and is the seller paying it off at close or rolling it to the buyer?
- Is there a deadline driving the sale (1031 exchange, divorce, estate, relocation)? That informs how much negotiation room exists.
- Schools are A-rated — typically a magnet for longer-tenancy family renters. What's the average tenant stay here, and is there a school-zone premium baked into asking?
- The area grade is low — what's the realistic commute time and amenity access for the typical tenant pool here? Any planned neighborhood developments (good or bad) we should know about?
- What's the average days-on-market for RENTAL listings here right now (not sales)? A rising rental-DOM trend means longer vacancies and softer asking-rent achievability than the comps imply.
- What's the recent tenant-quality profile in this submarket — average credit score on applications, eviction rate, late-payment / NSF rate, and stable-employment percentage? A property-management company in the area should have these aggregated.
- How much new apartment / multifamily construction is in the pipeline within 1–3 miles? Heavy new supply (>2% of stock underway) typically softens rents 12–24 months out; light construction supports rent growth.
Investment metrics
- 1% rule
- 0.99% ✗
- Cap rate
- 2.94%
- Cash-on-cash
- -11.98%
- DSCR
- 0.47
- GRM
- 8.4
CMA / ARV
- ARV (median comp)
- $137,895
- List price
- $129,900
- Delta
- -5.80%
- Verdict
- FAIR
- Comps
- 20 within 1.0 mi
Projected returns pro-forma
10.0% appreciation · 0.0% rent growth · sell at horizon
- IRR
- 14.9%
- Equity multiple
- 2.21×
- Total profit
- $44,179
- Equity at exit
- $117,024
- IRR
- 13.9%
- Equity multiple
- 4.91×
- Total profit
- $142,168
- Equity at exit
- $252,367
Cash invested: $36,372 (down + closing). Projections, not guarantees.
Landlord ↔ Tenant lean methodology
- Overall (STATE)
- 81 Strongly Landlord-Friendly
- State Missouri
- 81 Strongly Landlord-Friendly · R+10
- County
- — inherits STATE
- City
- — inherits STATE
ZIP-level market 63146
- Home prices YoY
- 4.9%
- Rents YoY
- -3.0%
- Active inventory
- 170
- Price-to-rent
- 8.4×
Monthly cashflow live
- Estimated rent
- $1,284 high interval (Pro) →
- Mortgage (P&I)
- −$681
- Tax from tax record
- −$91 /mo · $1,093/yr
- Insurance
- −$54
- HOA
- −$551
- Vacancy / Maint / Mgmt
- −$270
- Net cashflow
- $-363
Break-even live
UW: 25.0% down · 7.5% · 30yr · 1.5% tax · 5.0% vac · 8.0% maint · 8.0% mgmt
Financing live
Cash to close
- Down payment
- $32,475
- Closing costs
- $3,897
- Reserves months
- —
- Total cash needed
- —
Loan-product check · same deal, 3 products live
Conventional
25% down · 7.5% · 30yr
- Down + closing
- —
- Monthly P&I
- —
- Monthly cashflow
- —
- DSCR
- —
- Eligible?
- —
Personal DTI + credit; lowest rate.
DSCR
20% down · 8.5% · 30yr
- Down + closing
- —
- Monthly P&I
- —
- Monthly cashflow
- —
- DSCR
- —
- Eligible?
- —
No personal income docs; deal must DSCR.
Hard money
10% down · 12.0% · 12mo
- Down + closing
- —
- Monthly P&I
- —
- Monthly cashflow
- —
- DSCR
- —
- Eligible?
- —
Short-term bridge; refi at stabilization.
Rent comps 12 comps
| Address | Beds | Baths | Sqft | Rent | $/sqft | DOM | Units | Dist |
|---|---|---|---|---|---|---|---|---|
| 1434 Willow Brook Cove Ct St. Louis, MO | 2.0 | 1.5 | 910 | $1,395 | $1.53 | 43d | 1 | 0.26mi |
| 10304 Oxford Hill Dr St. Louis, MO | 1.0–3.0 | 1.0–2.0 | 925 | $1,089 | $1.18 | 2d | 47 | 0.27mi |
| 1380 Willow Brook Cove Ct St. Louis, MO | 2.0 | 1.5 | 910 | $1,550 | $1.70 | 14d | 1 | 0.28mi |
| 10368 Forest Brook Ln Unit F Saint Louis, MO | 2.0 | 2.0 | 1053 | $1,350 | $1.28 | 43d | 1 | 0.32mi |
| 10364 Forest Brook Ln Saint Louis, MO | 2.0 | 2.0 | 1053 | $1,400 | $1.33 | 43d | 1 | 0.33mi |
| 10900 Oak Forest Pkwy Dr St. Louis, MO | 1.0–2.0 | 1.0 | 800 | $1,025 | $1.28 | 3d | 6 | 0.46mi |
| 10427 Briarbend Dr #8 Saint Louis, MO | 2.0 | 1.5 | 858 | $1,350 | $1.57 | 23d | 1 | 0.49mi |
| 9814 Greenery Ln Unit D Saint Louis, MO | 2.0 | 1.0 | 875 | $1,250 | $1.43 | 23d | 1 | 0.91mi |
| 9814 Greenery Ln Saint Louis, MO | 2.0 | 1.0 | 900 | $1,475 | $1.64 | 43d | 1 | 0.91mi |
| 9882 Greenery Ln Saint Louis, MO | 2.0 | 1.0 | 900 | $1,400 | $1.56 | 43d | 1 | 0.91mi |
| 9826 Greenery Ln Saint Louis, MO | 2.0 | 1.0 | 900 | $1,275 | $1.42 | 43d | 1 | 0.91mi |
| 1836 Morven Ave Saint Louis, MO | 2.0 | 1.5 | 1496 | $1,670 | $1.12 | 14d | 1 | 1.30mi |
HOA detail condo
- Monthly dues
- $551 · $6,612/yr
- Likely covers
- electricpoolgym
- Assessments
- None detected in remarks — confirm with the listing agent.
Listing history 17 events
-
2026-06-18days on market $129,900 Active 51 DOM
-
2026-06-17days on market $129,900 Active 50 DOM
-
2026-06-16days on market $129,900 Active 49 DOM
-
2026-06-15days on market $129,900 Active 48 DOM
-
2026-06-13days on market $129,900 Active 46 DOM
-
2026-06-13days on market $129,900 Active 45 DOM
-
2026-06-09days on market $129,900 Active 42 DOM
-
2026-06-08days on market $129,900 Active 41 DOM
-
2026-06-07pricedays on market $129,900 Active 40 DOM
-
2026-06-03days on market $135,000 Active 36 DOM
-
2026-06-02days on market $135,000 Active 35 DOM
-
2026-06-01days on market $135,000 Active 34 DOM
-
2026-05-31days on market $135,000 Active 33 DOM
-
2026-05-08price $135,000 1522-char remark
-
2026-04-29$140,000 Active 1522-char remark
-
2026-04-27historical $140,000 1522-char remark
-
2000-10-19soldstatus $69,000
ⓘ Source: listings_history table (triggers on properties + properties_extension) + one-shot
backfill from property_details.listing_events for pre-trigger history.
Tax reassessment forecast MO · Resets to sale price
- Current annual tax
- $1,093 · $91/mo
- Projected year-2 tax
- $1,260 · $105/mo
- Expected delta
- +$167/yr (+$14/mo · 15.3%)
ⓘ Screening estimate from a state-policy table — verify with the county assessor before closing.
Climate risk First Street
- Flood 1/10 Low FEMA zone X (unshaded) · 0% chance over 30 yrs
- Wildfire 1/10 Low
- Heat 5/10 Major 7 d/yr ≥106°F today · 21 d/yr by 30 yrs out
- Wind 2/10 Low 100% chance of damaging wind over 30 yrs
- Air quality 2/10 Low 1 unhealthy d/yr today · 3 by 30 yrs out
Nearby sold comps map
Loading sold comps map…
Walkable amenities ~0.75 mi
Loading nearby amenities…
Taxation est. · year 1
- Rental income
- $15,409
- − Mortgage interest
- −$7,276
- − Property taxes
- −$1,093
- − Insurance
- −$650
- − Repairs & maintenance
- −$1,233
- − Management
- −$1,233
- − HOA
- −$6,612
- − Depreciation
- −$3,779
- Taxable loss
- −$6,466
- Est. tax savings @ 24.0%
- +$1,552
- After-tax cash flow
- $-2,804/yr
For passive investors: Depreciation is non-cash, so a rental often shows a tax loss while cash-flowing — sheltering income. Rental losses are passive: they offset passive income freely, and up to $25,000/yr can offset ordinary (W-2) income if you actively participate and your MAGI is under $100k (phasing out to $0 by $150k); unused losses carry forward. On sale, claimed depreciation is recaptured at up to 25%, and gains may owe capital-gains tax (a 1031 exchange can defer both). Figures are a year-1 estimate at your 24.0% rate — not tax advice; consult a CPA.
Schools (NCES district)
- District
- Pattonville R-III
- NCES district ID
- 2923700
- Math proficiency
- 32% ▼ -11.00%
- Reading proficiency
- 46% ▼ -5.00%
- Median HH income
- $50,786
- Composite
- 33.69/100
- National rank
- #5383
- State rank
- #147 of 324 in MO
Livability — Creve Coeur
- Score
- 81/100
- State rank
- #16
- US rank
- #1519
Category grades
Schools grade is shown separately in the Schools card above.
Census & demographics
- County
- Saint Louis County · 888,823 people
- City population
- 21,924
- Metro
- St. Louis, MO-IL
- Population (ZIP)
- 30,678
- Household income
- $84,756
- Rent vs Own
- Severe rent burden
- 1156.0
Population outlook (St. Louis County) Hauer SSP2
- Today (2025)
- 1,025,227 people
- By 2030
- 1,028,023 · +0.3%
- By 2040
- 1,020,940 · -0.4%
- By 2050
- 1,007,280 · -1.8%
- By 2075
- 987,277 · -3.7%
- By 2100
- 921,984 · -10.1%
Race, ethnicity, and origin ACS 2023
- Neighborhood character
- Diverse neighborhood (Simpson 0.56)
- Race & ethnicity
- White 63% Asian 17% Black 13% Two or more races 4% Hispanic / Latino 3%
- Common ancestry
- Scotch-Irish 3% Romanian 3% Italian 2%
- Foreign-born
- 19% · China, South Korea, Canada
- Languages at home
- 79% English-only · Other Asian/Pacific 7% Other Indo-European 4% Chinese 3%
Political lean MEDSL · St. Louis
- 2024 margin
- Strong D (+23.4) · D 60.8% · R 37.4% · Other 1.7%
- 2008→2024 swing
- +3.5pp toward D · 2008: 19.9pp · 2024: 23.4pp
- All cycles
- 2024: D+23.4 2020: D+24.0 2016: D+16.2 2012: D+13.7 2008: D+19.9
Not yet ingested
- Civics
- —
Market trends
- HPI YoY
- ▲ 33.10%
- Current HPI
- 711.49
- Rent YoY
- ▼ -2.96%
- Metro
- St. Louis, MO-IL
- State GDP YoY
- ▲ 1.84%
- F500 in state
- 20
Industry mix (Fortune 500 HQ in MO)
| Industry | F500 HQs | Revenue |
|---|---|---|
| Healthcare | 1 | $163B |
|
||
| Insurance | 1 | $21B |
|
||
| Industrial Technology | 1 | $17B |
|
||
| Retail | 1 | $16B |
|
||
| Industrial Distribution | 1 | $10B |
|
||
| Utilities | 1 | $9B |
|
||
Price history
+88.3% since first listed5 events — show timeline
- 2026-06-04 Price Changed $129,900 MARIS as Distributed by MLS Grid
- 2026-05-08 Price Changed $135,000 MARIS as Distributed by MLS Grid
- 2026-04-29 Listed $140,000 MARIS as Distributed by MLS Grid
- 2026-04-27 Coming Soon $140,000 MARIS as Distributed by MLS Grid
- 2000-10-19 Sold (Public Records) $69,000 Public Records
Property tax history
+3.0%/yrLatest (2022): $1,093 · +0.5% YoY. Source: county tax records.
Cash-flow waterfall
monthlySold comps — $/sqft
last 12 mo · ≤1 miLoading sold comps…