 Duplex
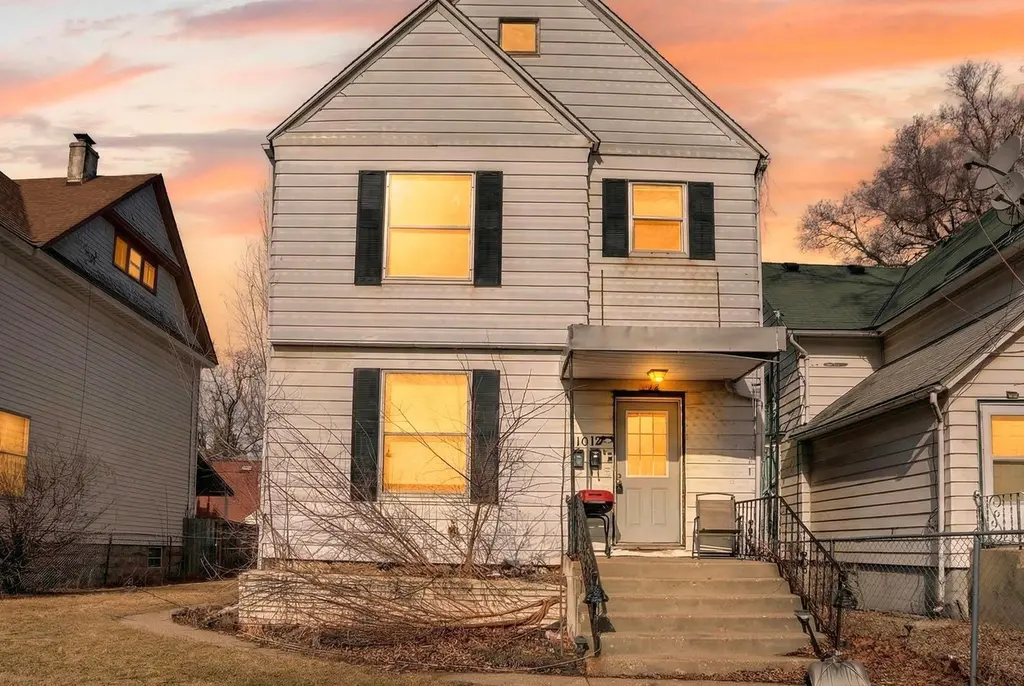
1012 N Court St · Rockford, IL
Flood risk 1/10 · Minimal
- FEMA flood zone
- X (unshaded)
- Chance of flooding over 30 yrs
- 0.0%
- Est. flood insurance / yr
- $473 – $860
Fire risk 1/10 · Minimal
- Est. fire insurance / yr
- $804 – $1,492
Heat risk 2/10 · Minimal
- Hot days now (above 102°F)
- 7 days/yr
- Hot days in 30 yrs
- 15 days/yr
Wind risk 2/10 · Minimal
- Chance of severe wind over 30 yrs
- —
Air-quality risk 2/10 · Minimal
- Unhealthy air days now
- 1 days/yr
- Unhealthy air days in 30 yrs
- 2 days/yr
Risk factors via First Street. Map © Google.
Why this score? — see what drove the B- grade
The composite is a weighted blend of 9 inputs, each scored 0–100. Each bar is that input's sub-score; the figure is the points it added to the 100-point composite (weight × sub-score).
- Cash flow +30.0/30.0
- 1% rule +10.0/10.0
- DSCR +10.0/10.0
- ARV discount +7.5/15.0
- Rent growth +4.5/5.0
- Livability +3.1/5.0
- Condition / age +2.5/5.0
- Schools +1.2/10.0
- Appreciation +0.0/10.0
$110,000
🖨 Deal sheet 📄 Offer letter ✓ Due diligence
Multi-family units
County records classify this as Multi-Family (2-4 Unit). Listing-text estimate: 2 units. confirmed
Listing remarks MLS
Great investment opportunity! Spacious 2,422 sq ft duplex featuring two large 2-bedroom units. Property needs some TLC but offers tremendous sweat equity potential for investors looking to build their portfolio or owner-occupants wanting to live in one unit and rent out the other. Generous room sizes and solid layout provide a strong foundation to add value. Conveniently located near Sinnissippi Park, local schools, and downtown Rockford, offering easy access to recreation, dining, and shopping. Opportunity awaits—bring your vision and make it shine!
Key facts
- Local schools
- Desirable area
- Built 1900
Tags
Property features AI
Finance
- Other: Built before 1978
- Financial info: Building contains 2 units; Unit 1 rent $889 (security deposit $889); lease info available; Unit 2 rent/amenities: tenant pays all; no appliances listed for unit 2; Special Service Area: No
Exterior
- Utilities: Public water; Public sewer
- Home design: Two- to four-unit property; Fee simple ownership; 100+ years old; Not rebuilt or rehabbed
- Construction: Vinyl siding
- Exterior features: Lot less than 0.25 acre; Lot dimensions: 6864
Interior
- Kitchen: Stove; Refrigerator
- Bedrooms: 4 bedrooms (two 2-bedroom units: one on 1st floor, one on 2nd floor)
- Bathrooms: 2 full bathrooms (one in each unit)
- Heating & cooling: Forced air heating
- Interior features: 4 total rooms; Unfinished full basement
- Laundry & utility: Tenant pays all utilities
Neighborhood map
What this means for you Summary
Snapshot
- This is a 2 × 2-bed/1.0-bath units multifamily listed at $110k.
Deal economics
- At list price, monthly cash flow is $1k ($12k/yr) — positive. Per door: $521/mo.
- The deal already cash-flows at list — no discount required.
- Meets the 1% rule at list price ($2k rent vs $110k).
- Recommended offer: $108k (1.5% below list) — sets the bar for market timing.
- Cap rate 17.7% vs local median 6.1% in Rockford — top-decile yield for the area; either an underpriced asset or a hidden risk that comps aren't pricing in. Stress-test before assuming the spread holds.
Location & tenants
- Location reads 62/100 on livability (#876 in IL) — a middle-class / working-renter tenant base. Strengths: cost of living A+, housing A+, health & safety A+; Watch: crime F, amenities F, commute F.
- Rockford SD 205 (urban): math 12% / reading 16% proficiency, ranked #533 of 620 in IL (top 86%) — low school quality limits family demand, transient renter base, plan for 1-2y turnover; 73% free/reduced lunch — lower-income household profile, screen leases tightly.
- Zoned schools: West Middle School (math 3% / reading 11%, grade F, #627 of 665 statewide, top 95%, 849 students, 0% FRL); Auburn High School (math 26% / reading 32%, grade F, #210 of 693 statewide, top 30%, 1,936 students, 0% FRL) — zoned schools average 0% FRL vs 73% district-wide (73 pts lower); this property's tenant base skews higher-income than the district average.
- Market conditions: Rents rising fast (+8.1%/yr); 103 active listings in the ZIP; 25 comparable units currently listed for rent nearby; rentals at typical pace (median 21d on market — plan ~3-4 weeks tenant-placement turnaround); 40% of comp listings sitting > 30 days — soft ceiling on asking rent; 285 units permitted in Winnebago County in 2024 (0 in 5+ unit buildings).
- At $2,373/mo this rent would consume 56% of the median local household income ($51k/yr) (locally 1402% of renters already pay >50% of income on rent) — very limited rent-growth headroom before tenants either downsize or default.
Forward outlook
- Local home prices are declining (-3.0%/yr); year-one equity from $761 of loan paydown is wiped out by about $3k of value loss. Plan a longer hold.
- Winnebago County population projected at -20% by 2050 — secular population decline; favor cash flow + early exit over multi-decade hold.
- At projected returns (-3.0% appreciation + 8.0% rent growth), your $31k cash investment doubles in ~3 years — after that, you're playing with house money.
Negotiation context
- It's been on market 16 days — a 2% lower offer ($108k) is reasonable based on typical stale-listing flexibility.
- 14 sale attempts since 19y ago with the ask held roughly flat each time — persistent listings suggest the price (not the market) is what's stuck; bring a comps-based counter.
- Current owner paid $82k; 35% above their basis — modest negotiation headroom, anchor on the comps not their cost.
Risks & watch-outs
- Watch-outs: built in 1900 — expect roof / HVAC / electrical / plumbing capex.
Questions for the listing agent
- Can we see the unit-by-unit rent roll, current vacancy, and any below-market leases? What's the average tenancy length?
- What capital expenditures (roof, boiler, parking lot, exteriors) have been made in the last 5 years, and what's planned in the next 2?
- Built in 1900 — when were the roof, HVAC, electrical panel, plumbing, and water heater last replaced?
- Is there a deadline driving the sale (1031 exchange, divorce, estate, relocation)? That informs how much negotiation room exists.
- Schools are F-rated, which usually means shorter tenancies and higher turnover. Who's the typical renter profile here, and what's been the actual vacancy rate?
- Crime grade is F in this area — have there been break-ins, vandalism, or insurance claims at this property in the last 3 years? What carrier currently insures it and at what premium?
- What's the average days-on-market for RENTAL listings here right now (not sales)? A rising rental-DOM trend means longer vacancies and softer asking-rent achievability than the comps imply.
- What's the recent tenant-quality profile in this submarket — average credit score on applications, eviction rate, late-payment / NSF rate, and stable-employment percentage? A property-management company in the area should have these aggregated.
- How much new apartment / multifamily construction is in the pipeline within 1–3 miles? Heavy new supply (>2% of stock underway) typically softens rents 12–24 months out; light construction supports rent growth.
Investment metrics
- 1% rule
- 2.16% ✓
- Cap rate
- 17.65%
- Cash-on-cash
- 40.57%
- DSCR
- 2.81
- GRM
- 3.9
CMA / ARV
No comps found within radius.
Show comp detail 12 sales within ~0.75 mi
| Address | Dist | Beds/Ba | Sqft | Sold | Price | $/sf | Match |
|---|---|---|---|---|---|---|---|
| 1023 N Court St | 0.04mi | 4/2.0 | — | 6mo | $160,000 | — | 80 |
| 1128 Grant Ave | 0.13mi | 4/2.0 | — | 3mo | $185,000 | — | 79 |
| 1315 N Court St | 0.29mi | 4/2.0 | — | 1mo | $135,000 | — | 73 |
| 1305 Garrison Ave | 0.32mi | 4/2.0 | — | 3mo | $215,000 | — | 70 |
| 1401 N Court St | 0.34mi | 5/2.0 (+1) | — | 3mo | $160,000 | — | 65 |
| 801 N Winnebago St | 0.37mi | 3/2.0 (-1) | — | 2mo | $91,000 | — | 64 |
| 915-917 N Winnebago St | 0.34mi | 5/2.0 (+1) | — | 4mo | $105,000 | — | 63 |
| 635 Garfield Ave | 0.36mi | 4/2.0 | — | 10mo | $171,000 | — | 62 |
| 1324 Evelyn St | 0.34mi | 4/3.0 | 1,240 | 6mo | $1,320,000 | $1,065 | 62 |
| 2308 Auburn St | 0.52mi | 4/2.0 | 942 | 3mo | $165,000 | $175 | 61 |
| 2121 Auburn St | 0.46mi | 4/4.0 | — | 7mo | $270,000 | — | 52 |
| 416 N Horsman St | 0.72mi | 3/5.0 (-1) | — | 3mo | $135,000 | — | 34 |
Match score weights: distance 35% · size 25% · config 20% · recency 20%. Top-matched comps best support the ARV.
Projected returns pro-forma
-3.0% appreciation · 8.0% rent growth · sell at horizon
- IRR
- 42.8%
- Equity multiple
- 2.98×
- Total profit
- $61,120
- Equity at exit
- $16,401
- IRR
- 51.3%
- Equity multiple
- 7.36×
- Total profit
- $196,031
- Equity at exit
- $9,511
Cash invested: $30,800 (down + closing). Projections, not guarantees.
Landlord ↔ Tenant lean methodology
- Overall (STATE)
- 43 Moderately Tenant-Leaning
- State Illinois
- 43 Moderately Tenant-Leaning · D+7
- County
- — inherits STATE
- City
- — inherits STATE
ZIP-level market 61103
- Home prices YoY
- -27.3%
- Rents YoY
- 8.1%
- Active inventory
- 103
- Price-to-rent
- 7.7×
Monthly cashflow live
- Estimated rent
- $2,373 high interval (Pro) →
- Mortgage (P&I)
- −$577
- Tax from tax record
- −$211 /mo · $2,528/yr
- Insurance
- −$46
- HOA
- −$0
- Vacancy / Maint / Mgmt
- −$498
- Net cashflow
- $1,041
Break-even live
2-unit breakdown (identical units grouped — click to expand)
| Units | Beds | Baths | Est. rent |
|---|---|---|---|
| 2× units | 2 | 1 | $2,374 |
| #1 | 2 | 1 | $1,187 |
| #2 | 2 | 1 | $1,187 |
| Total (2 units) | $2,373 | ||
UW: 25.0% down · 7.5% · 30yr · 1.5% tax · 5.0% vac · 8.0% maint · 8.0% mgmt
Financing live
Cash to close
- Down payment
- $27,500
- Closing costs
- $3,300
- Reserves months
- —
- Total cash needed
- —
Loan-product check · same deal, 3 products live
Conventional
25% down · 7.5% · 30yr
- Down + closing
- —
- Monthly P&I
- —
- Monthly cashflow
- —
- DSCR
- —
- Eligible?
- —
Personal DTI + credit; lowest rate.
DSCR
20% down · 8.5% · 30yr
- Down + closing
- —
- Monthly P&I
- —
- Monthly cashflow
- —
- DSCR
- —
- Eligible?
- —
No personal income docs; deal must DSCR.
Hard money
10% down · 12.0% · 12mo
- Down + closing
- —
- Monthly P&I
- —
- Monthly cashflow
- —
- DSCR
- —
- Eligible?
- —
Short-term bridge; refi at stabilization.
Rent comps 25 comps
| Address | Beds | Baths | Sqft | Rent | $/sqft | DOM | Units | Dist |
|---|---|---|---|---|---|---|---|---|
| 977 Indian Ter Rockford, IL | 3.0 | 2.5 | — | $3,250 | — | 43d | 1 | 0.25mi |
| 330 King St Rockford, IL | 4.0 | 2.0 | — | $1,700 | — | 43d | 1 | 0.37mi |
| 728 N Winnebago St Rockford, IL | 4.0 | 1.0 | 1250 | $1,600 | $1.28 | 13d | 1 | 0.41mi |
| 718 Locust St Rockford, IL | 3.0 | 1.0 | — | $1,550 | — | 13d | 1 | 0.64mi |
| 1832 N Main St Rockford, IL | 2.0–3.0 | 1.0–2.0 | 872 | $1,199 | $1.37 | 13d | 1 | 0.71mi |
| 2208 Fremont St Rockford, IL | 3.0 | 1.0 | 938 | $1,400 | $1.49 | 13d | 1 | 0.98mi |
| 512 Market St Unit 512 UPPER Rockford, IL | 3.0 | 1.0 | — | $1,750 | — | 43d | 1 | 1.00mi |
| 2215 Hecker Ave Unit 2215 Rockford, IL | 3.0 | 1.0 | 800 | $1,095 | $1.37 | 43d | 1 | 1.04mi |
| 2308 Fremont St Rockford, IL | 3.0 | 1.0 | 1320 | $1,600 | $1.21 | 43d | 1 | 1.04mi |
| 1146 Fairview Ave Rockford, IL | 4.0 | 1.5 | 1344 | $1,250 | $0.93 | 20d | 1 | 1.09mi |
| 222 S 2nd St Unit 224 Rockford, IL | 3.0 | 1.0 | — | $1,350 | — | 20d | 1 | 1.17mi |
| 3133 Liberty Dr Rockford, IL | 3.0 | 1.5 | — | $1,675 | — | 20d | 1 | 1.18mi |
| 303 Forest Ave Rockford, IL | 4.0 | 1.0 | 1568 | $1,800 | $1.15 | 43d | 1 | 1.19mi |
| 507 Oak St Unit 2 Rockford, IL | 3.0 | 2.5 | — | $1,250 | — | 20d | 1 | 1.21mi |
| 418 Orchard Park Rockford, IL | 3.0 | 1.0 | 1232 | $1,500 | $1.22 | 13d | 1 | 1.33mi |
| 1803 Sauber Ave Rockford, IL | 3.0 | 1.0 | — | $1,400 | — | 20d | 1 | 1.34mi |
| 1510 School St Unit 1 Rockford, IL | 3.0 | 1.5 | 1400 | $1,200 | $0.86 | 43d | 1 | 1.40mi |
| 1823 Overdene Ave Rockford, IL | 3.0 | 1.0 | 875 | $1,500 | $1.71 | 20d | 1 | 1.40mi |
| 1823 Overdene Ave Rockford, IL | 3.0 | 1.0 | 875 | $1,400 | $1.60 | 13d | 1 | 1.40mi |
| 3007 Huffman Blvd Rockford, IL | 3.0 | 1.5 | 1296 | $1,450 | $1.12 | 43d | 1 | 1.41mi |
| 2019 Overdene Ave Rockford, IL | 3.0 | 1.0 | 875 | $1,400 | $1.60 | 13d | 1 | 1.41mi |
| 2019 Overdene Ave Rockford, IL | 3.0 | 1.0 | 875 | $1,500 | $1.71 | 43d | 1 | 1.41mi |
| 210 Irving Ave Rockford, IL | 5.0 | 1.0 | 1202 | $1,850 | $1.54 | 43d | 1 | 1.42mi |
| 2330 Kilburn Ave Rockford, IL | 2.0–3.0 | 1.0–2.0 | 950 | $1,199 | $1.26 | 13d | 1 | 1.44mi |
| 620 Paris Ave Rockford, IL | 5.0 | 3.5 | — | $2,200 | — | 20d | 1 | 1.46mi |
Listing history 47 events
-
2026-05-06status Pending 562-char remark
Show marketing remark (562 chars)
Great investment opportunity! Spacious 2,422 sq ft duplex featuring two large 2-bedroom units. Property needs some TLC but offers tremendous sweat equity potential for investors looking to build their portfolio or owner-occupants wanting to live in one unit and rent out the other. Generous room sizes and solid layout provide a strong foundation to add value. Conveniently located near Sinnissippi Park, local schools, and downtown Rockford, offering easy access to recreation, dining, and shopping. Opportunity awaits—bring your vision and make it shine!
-
2026-05-06status Pending
Show marketing remark (562 chars)
Great investment opportunity! Spacious 2,422 sq ft duplex featuring two large 2-bedroom units. Property needs some TLC but offers tremendous sweat equity potential for investors looking to build their portfolio or owner-occupants wanting to live in one unit and rent out the other. Generous room sizes and solid layout provide a strong foundation to add value. Conveniently located near Sinnissippi Park, local schools, and downtown Rockford, offering easy access to recreation, dining, and shopping. Opportunity awaits—bring your vision and make it shine!
-
2026-05-05status Active 562-char remark
Show marketing remark (562 chars)
Great investment opportunity! Spacious 2,422 sq ft duplex featuring two large 2-bedroom units. Property needs some TLC but offers tremendous sweat equity potential for investors looking to build their portfolio or owner-occupants wanting to live in one unit and rent out the other. Generous room sizes and solid layout provide a strong foundation to add value. Conveniently located near Sinnissippi Park, local schools, and downtown Rockford, offering easy access to recreation, dining, and shopping. Opportunity awaits—bring your vision and make it shine!
-
2026-05-05status Active
Show marketing remark (562 chars)
Great investment opportunity! Spacious 2,422 sq ft duplex featuring two large 2-bedroom units. Property needs some TLC but offers tremendous sweat equity potential for investors looking to build their portfolio or owner-occupants wanting to live in one unit and rent out the other. Generous room sizes and solid layout provide a strong foundation to add value. Conveniently located near Sinnissippi Park, local schools, and downtown Rockford, offering easy access to recreation, dining, and shopping. Opportunity awaits—bring your vision and make it shine!
-
2026-04-22status Pending 562-char remark
Show marketing remark (562 chars)
Great investment opportunity! Spacious 2,422 sq ft duplex featuring two large 2-bedroom units. Property needs some TLC but offers tremendous sweat equity potential for investors looking to build their portfolio or owner-occupants wanting to live in one unit and rent out the other. Generous room sizes and solid layout provide a strong foundation to add value. Conveniently located near Sinnissippi Park, local schools, and downtown Rockford, offering easy access to recreation, dining, and shopping. Opportunity awaits—bring your vision and make it shine!
-
2026-04-22status Pending
Show marketing remark (562 chars)
Great investment opportunity! Spacious 2,422 sq ft duplex featuring two large 2-bedroom units. Property needs some TLC but offers tremendous sweat equity potential for investors looking to build their portfolio or owner-occupants wanting to live in one unit and rent out the other. Generous room sizes and solid layout provide a strong foundation to add value. Conveniently located near Sinnissippi Park, local schools, and downtown Rockford, offering easy access to recreation, dining, and shopping. Opportunity awaits—bring your vision and make it shine!
-
2026-04-07$110,000 Active 562-char remark
Show marketing remark (562 chars)
Great investment opportunity! Spacious 2,422 sq ft duplex featuring two large 2-bedroom units. Property needs some TLC but offers tremendous sweat equity potential for investors looking to build their portfolio or owner-occupants wanting to live in one unit and rent out the other. Generous room sizes and solid layout provide a strong foundation to add value. Conveniently located near Sinnissippi Park, local schools, and downtown Rockford, offering easy access to recreation, dining, and shopping. Opportunity awaits—bring your vision and make it shine!
-
2026-04-07$110,000 Active
Show marketing remark (562 chars)
Great investment opportunity! Spacious 2,422 sq ft duplex featuring two large 2-bedroom units. Property needs some TLC but offers tremendous sweat equity potential for investors looking to build their portfolio or owner-occupants wanting to live in one unit and rent out the other. Generous room sizes and solid layout provide a strong foundation to add value. Conveniently located near Sinnissippi Park, local schools, and downtown Rockford, offering easy access to recreation, dining, and shopping. Opportunity awaits—bring your vision and make it shine!
-
2023-03-24status Pending 311-char remark
Show marketing remark (311 chars)
CONSISTENTLY BRINGS IN $1,726/MONTH IN RENTAL INCOME! DUE TO PARTICIPATION IN IHDA PROGRAM, YOU CAN COUNT ON COLLECTING RENT EVERY MONTH. IN ADDITION, THIS BUILDING HAS GREAT ARCHITECTURAL DETAILS LIKE HARDWOOD FLOORS, MILLWORK IN THE DINING ROOM, AND TALL CEILINGS. SPACIOUS, 1200 SQ FT 2-BEDROOM/1 BATH UNITS.
-
2022-12-02status Pending 311-char remark
Show marketing remark (311 chars)
CONSISTENTLY BRINGS IN $1,726/MONTH IN RENTAL INCOME! DUE TO PARTICIPATION IN IHDA PROGRAM, YOU CAN COUNT ON COLLECTING RENT EVERY MONTH. IN ADDITION, THIS BUILDING HAS GREAT ARCHITECTURAL DETAILS LIKE HARDWOOD FLOORS, MILLWORK IN THE DINING ROOM, AND TALL CEILINGS. SPACIOUS, 1200 SQ FT 2-BEDROOM/1 BATH UNITS.
-
2022-06-03soldstatus $81,500
-
2022-05-20soldstatus $81,500 Closed 311-char remark
Show marketing remark (311 chars)
CONSISTENTLY BRINGS IN $1,726/MONTH IN RENTAL INCOME! DUE TO PARTICIPATION IN IHDA PROGRAM, YOU CAN COUNT ON COLLECTING RENT EVERY MONTH. IN ADDITION, THIS BUILDING HAS GREAT ARCHITECTURAL DETAILS LIKE HARDWOOD FLOORS, MILLWORK IN THE DINING ROOM, AND TALL CEILINGS. SPACIOUS, 1200 SQ FT 2-BEDROOM/1 BATH UNITS.
-
2022-05-20soldstatus $81,500 311-char remark
Show marketing remark (311 chars)
CONSISTENTLY BRINGS IN $1,726/MONTH IN RENTAL INCOME! DUE TO PARTICIPATION IN IHDA PROGRAM, YOU CAN COUNT ON COLLECTING RENT EVERY MONTH. IN ADDITION, THIS BUILDING HAS GREAT ARCHITECTURAL DETAILS LIKE HARDWOOD FLOORS, MILLWORK IN THE DINING ROOM, AND TALL CEILINGS. SPACIOUS, 1200 SQ FT 2-BEDROOM/1 BATH UNITS.
-
2022-05-20soldstatus $81,500 Closed
Show marketing remark (311 chars)
CONSISTENTLY BRINGS IN $1,726/MONTH IN RENTAL INCOME! DUE TO PARTICIPATION IN IHDA PROGRAM, YOU CAN COUNT ON COLLECTING RENT EVERY MONTH. IN ADDITION, THIS BUILDING HAS GREAT ARCHITECTURAL DETAILS LIKE HARDWOOD FLOORS, MILLWORK IN THE DINING ROOM, AND TALL CEILINGS. SPACIOUS, 1200 SQ FT 2-BEDROOM/1 BATH UNITS.
-
2022-04-03status Pending
-
2022-03-29status Active
-
2022-03-23status Pending
-
2022-03-17price $89,000
-
2022-03-06$89,000 311-char remark
Show marketing remark (311 chars)
CONSISTENTLY BRINGS IN $1,726/MONTH IN RENTAL INCOME! DUE TO PARTICIPATION IN IHDA PROGRAM, YOU CAN COUNT ON COLLECTING RENT EVERY MONTH. IN ADDITION, THIS BUILDING HAS GREAT ARCHITECTURAL DETAILS LIKE HARDWOOD FLOORS, MILLWORK IN THE DINING ROOM, AND TALL CEILINGS. SPACIOUS, 1200 SQ FT 2-BEDROOM/1 BATH UNITS.
-
2022-03-06$99,000 Active
Show marketing remark (311 chars)
CONSISTENTLY BRINGS IN $1,726/MONTH IN RENTAL INCOME! DUE TO PARTICIPATION IN IHDA PROGRAM, YOU CAN COUNT ON COLLECTING RENT EVERY MONTH. IN ADDITION, THIS BUILDING HAS GREAT ARCHITECTURAL DETAILS LIKE HARDWOOD FLOORS, MILLWORK IN THE DINING ROOM, AND TALL CEILINGS. SPACIOUS, 1200 SQ FT 2-BEDROOM/1 BATH UNITS.
-
2020-01-21soldstatus $50,000 Closed Sale
-
2020-01-21soldstatus $50,000
-
2019-11-06status Pending
-
2019-06-18$70,000 New
-
2019-06-18$70,000
-
2017-04-26soldstatus $20,000
-
2017-04-21soldstatus $20,000 Closed Sale
-
2017-04-21soldstatus $20,000
-
2016-12-05status Pending
-
2016-04-18price $39,500
-
2016-03-21$43,900 New
-
2016-03-18$39,500
-
2014-07-01historical
-
2014-02-19New
-
2008-09-30historical
-
2008-06-27
-
2007-09-21historical
-
2007-03-27
-
2003-10-31soldstatus $55,000
-
2002-03-26soldstatus $59,000
-
1997-04-30soldstatus $56,000
-
1997-04-30soldstatus $56,000
-
1993-02-22soldstatus $57,500
-
1993-02-22soldstatus $57,500
-
1990-10-01soldstatus $53,500
-
1989-01-03soldstatus $68,000
ⓘ Source: listings_history table (triggers on properties + properties_extension) + one-shot
backfill from property_details.listing_events for pre-trigger history.
Tax reassessment forecast IL · Partial reset (capped growth)
- Current annual tax
- $2,528 · $211/mo
- Projected year-2 tax
- $2,528 · $211/mo
- Expected delta
- $0/yr ($0/mo · 0.0%)
ⓘ Screening estimate from a state-policy table — verify with the county assessor before closing.
Climate risk First Street
- Flood 1/10 Low FEMA zone X (unshaded) · 0% chance over 30 yrs
- Wildfire 1/10 Low
- Heat 2/10 Low 7 d/yr ≥102°F today · 15 d/yr by 30 yrs out
- Wind 2/10 Low
- Air quality 2/10 Low 1 unhealthy d/yr today · 2 by 30 yrs out
Nearby sold comps map
Loading sold comps map…
Walkable amenities ~0.75 mi
Loading nearby amenities…
Taxation est. · year 1
- Rental income
- $28,476
- − Mortgage interest
- −$6,162
- − Property taxes
- −$2,528
- − Insurance
- −$550
- − Repairs & maintenance
- −$2,278
- − Management
- −$2,278
- − Depreciation
- −$3,200
- Taxable income
- $11,480
- Est. tax owed @ 24.0%
- −$2,755
- After-tax cash flow
- $9,741/yr
For passive investors: Depreciation is non-cash, so a rental often shows a tax loss while cash-flowing — sheltering income. Rental losses are passive: they offset passive income freely, and up to $25,000/yr can offset ordinary (W-2) income if you actively participate and your MAGI is under $100k (phasing out to $0 by $150k); unused losses carry forward. On sale, claimed depreciation is recaptured at up to 25%, and gains may owe capital-gains tax (a 1031 exchange can defer both). Figures are a year-1 estimate at your 24.0% rate — not tax advice; consult a CPA.
Schools (NCES district)
- District
- Rockford SD 205
- NCES district ID
- 1734510
- Math proficiency
- 12% ▼ -2.00%
- Reading proficiency
- 16% ▼ -3.00%
- Median HH income
- $42,533
- Composite
- 12.21/100
- National rank
- #9649
- State rank
- #533 of 620 in IL
Livability — Rockford
- Score
- 62/100
- State rank
- #876
- US rank
- #17035
Category grades
Schools grade is shown separately in the Schools card above.
Census & demographics
- Census place
- Rockford, IL
- County
- Winnebago County · 147,297 people
- City population
- 147,297
- Metro
- Rockford, IL
- Population (ZIP)
- 22,869
- Household income
- $51,161
- Rent vs Own
- Severe rent burden
- 1402.0
Population outlook (Winnebago County) Hauer SSP2
- Today (2025)
- 271,080 people
- By 2030
- 260,684 · -3.8%
- By 2040
- 238,405 · -12.1%
- By 2050
- 216,129 · -20.3%
- By 2075
- 172,882 · -36.2%
- By 2100
- 135,336 · -50.1%
Race, ethnicity, and origin ACS 2023
- Neighborhood character
- Diverse neighborhood (Simpson 0.61)
- Race & ethnicity
- White 56% Black 25% Two or more races 13% Hispanic / Latino 12%
- Hispanic origin (detail)
- Mexican 10%
- Common ancestry
- Romanian 3% Portuguese 2% Italian 2%
- Foreign-born
- 7% · Canada
- Languages at home
- 88% English-only · Spanish 9% Russian/Polish/Slavic 1%
Political lean MEDSL · Winnebago
- 2024 margin
- Toss-up / Even · D 49.5% · R 49.0% · Other 1.5%
- 2008→2024 swing
- -12.2pp toward R · 2008: 12.8pp · 2024: 0.6pp
- All cycles
- 2024: D+0.6 2020: D+2.5 2016: R+1.2 2012: D+5.7 2008: D+12.8
Not yet ingested
- Civics
- —
Market trends
- HPI YoY
- ▼ -81.02%
- Current HPI
- 215.8559
- Rent YoY
- ▲ 8.11%
- Metro
- Rockford, IL
- State GDP YoY
- ▲ 1.59%
- F500 in state
- 60
Industry mix (Fortune 500 HQ in IL)
| Industry | F500 HQs | Revenue |
|---|---|---|
| Insurance | 4 | $201B |
|
||
| Consumer Goods | 4 | $87B |
|
||
| Industrial Machinery | 3 | $64B |
|
||
| Healthcare | 2 | $55B |
|
||
| Retail / Pharmacy | 1 | $148B |
|
||
| Agriculture / Food | 1 | $86B |
|
||
Price history
+61.8% since first listed47 events — show timeline
- 2026-05-06 Pending — NWIAR
- 2026-05-06 Pending — MRED as Distributed by MLS Grid
- 2026-05-05 Relisted — NWIAR
- 2026-05-05 Relisted — MRED as Distributed by MLS Grid
- 2026-04-22 Pending — NWIAR
- 2026-04-22 Pending — MRED as Distributed by MLS Grid
- 2026-04-07 Listed $110,000 NWIAR
- 2026-04-07 Listed $110,000 MRED as Distributed by MLS Grid
- 2023-03-24 Pending — NWIAR
- 2022-12-02 Pending — NWIAR
- 2022-06-03 Sold (Public Records) $81,500 Public Records
- 2022-05-20 Sold (MLS) $81,500 MRED as Distributed by MLS Grid
- 2022-05-20 Sold (MLS) $81,500 NWIAR
- 2022-05-20 Sold (MLS) $81,500 NWIAR
- 2022-05-20 Sold (MLS) $81,500 NWIAR
- 2022-04-03 Pending — MRED as Distributed by MLS Grid
- 2022-03-29 Relisted — MRED as Distributed by MLS Grid
- 2022-03-23 Pending — MRED as Distributed by MLS Grid
- 2022-03-17 Price Changed $89,000 MRED as Distributed by MLS Grid
- 2022-03-06 Listed $99,000 MRED as Distributed by MLS Grid
- 2022-03-06 Listed $89,000 NWIAR
- 2020-01-21 Sold (MLS) $50,000 MRED as Distributed by MLS Grid
- 2020-01-21 Sold (MLS) $50,000 NWIAR
- 2019-11-06 Pending — MRED as Distributed by MLS Grid
- 2019-06-18 Listed $70,000 MRED as Distributed by MLS Grid
- 2019-06-18 Listed $70,000 NWIAR
- 2017-04-26 Sold (Public Records) $20,000 Public Records
- 2017-04-21 Sold (MLS) $20,000 MRED as Distributed by MLS Grid
- 2017-04-21 Sold (MLS) $20,000 NWIAR
- 2016-12-05 Pending — MRED as Distributed by MLS Grid
- 2016-04-18 Price Changed $39,500 MRED as Distributed by MLS Grid
- 2016-03-21 Listed $43,900 MRED as Distributed by MLS Grid
- 2016-03-18 Listed $39,500 NWIAR
- 2014-07-01 Listing Removed — MRED as Distributed by MLS Grid
- 2014-02-19 Listed — MRED as Distributed by MLS Grid
- 2008-09-30 Listing Removed — MRED as Distributed by MLS Grid
- 2008-06-27 Listed — MRED as Distributed by MLS Grid
- 2007-09-21 Listing Removed — MRED as Distributed by MLS Grid
- 2007-03-27 Listed — MRED as Distributed by MLS Grid
- 2003-10-31 Sold (Public Records) $55,000 Public Records
- 2002-03-26 Sold (Public Records) $59,000 Public Records
- 1997-04-30 Sold (Public Records) $56,000 Public Records
- 1997-04-30 Sold (Public Records) $56,000 Public Records
- 1993-02-22 Sold (Public Records) $57,500 Public Records
- 1993-02-22 Sold (Public Records) $57,500 Public Records
- 1990-10-01 Sold (Public Records) $53,500 Public Records
- 1989-01-03 Sold (Public Records) $68,000 Public Records
Property tax history
+0.3%/yrLatest (2024): $2,528 · +3.5% YoY. Source: county tax records.
Cash-flow waterfall
monthlySold comps — $/sqft
last 12 mo · ≤1 miLoading sold comps…