 🏢 Co-op
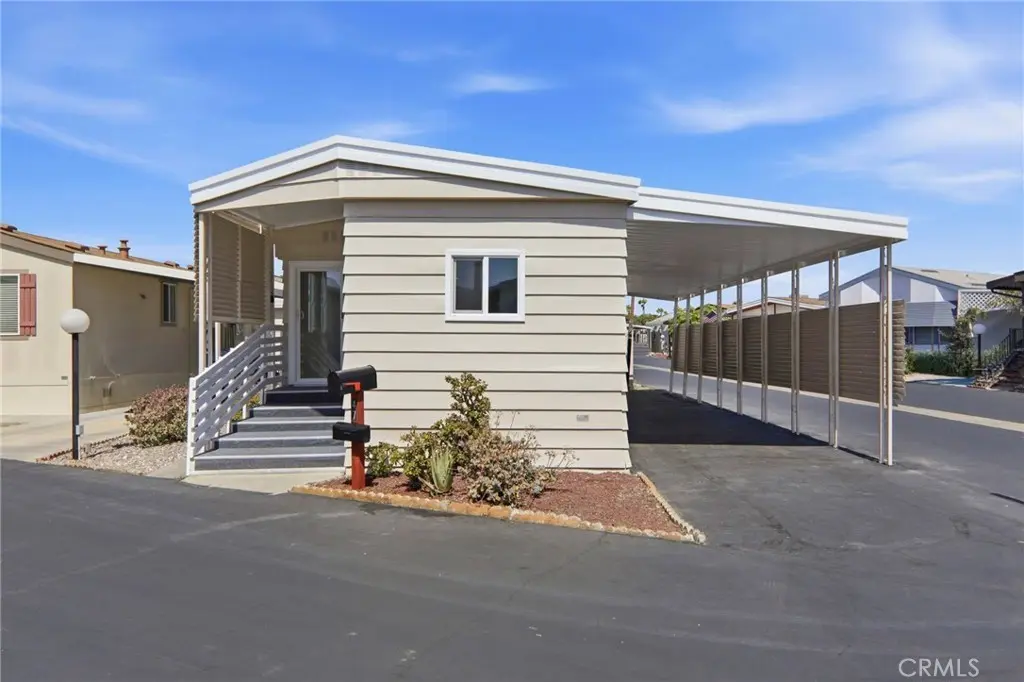
235 S Beach Blvd #47 · Anaheim, CA
Flood risk 6/10 · Moderate
- FEMA flood zone
- X (shaded)
- Chance of flooding over 30 yrs
- 0.8%
- Est. flood insurance / yr
- $507 – $1,088
Fire risk 1/10 · Minimal
- Est. fire insurance / yr
- $659 – $1,223
Heat risk 5/10 · Moderate
- Hot days now (above 91°F)
- 7 days/yr
- Hot days in 30 yrs
- 23 days/yr
Wind risk 1/10 · Minimal
- Chance of severe wind over 30 yrs
- —
Air-quality risk 5/10 · Moderate
- Unhealthy air days now
- 7 days/yr
- Unhealthy air days in 30 yrs
- 8 days/yr
Risk factors via First Street. Map © Google.
Why this score? — see what drove the C- grade
The composite is a weighted blend of 9 inputs, each scored 0–100. Each bar is that input's sub-score; the figure is the points it added to the 100-point composite (weight × sub-score).
- Cash flow +17.9/30.0
- 1% rule +7.6/10.0
- ARV discount +7.5/15.0
- DSCR +5.6/10.0
- Schools +5.5/10.0
- Livability +3.5/5.0
- Rent growth +2.6/5.0
- Condition / age +2.5/5.0
- Appreciation +0.0/10.0
$170,000
🖨 Deal sheet 📄 Offer letter ✓ Due diligence
Listing remarks
Welcome to Space 47 in the desirable Cherokee Senior Mobile Home Park, a well-maintained 55+ community offering comfort, convenience, and true ownership. This beautifully updated 2-bedroom home features a modernized kitchen with elegant quartz countertops and new appliances, perfect for everyday living and entertaining. The interior has been freshly painted throughout, complemented by new flooring that creates a clean, cohesive feel. The spacious, updated bathroom adds to the home’s move-in-ready appeal. One of the standout benefits of this community is co-op ownership, residents are co-owner, meaning no space rent or land lease, a rare and valuable advantage. The community maintains
Key facts
- Quartz countertops
- Modernized kitchen
- New flooring
Tags
Property features AI
Finance
- Other: Park name: Cherokee Mobile Home Park; Pets allowed: Dogs and cats; Builder: Homark Co Inc; Directions: On Beach Blvd and Youth Center Drive between Lincoln and Orange
- Financial info: Special assessments
- HOA & community: Part of an association; Monthly association fee of $255; Secondary monthly association fee of $292; Association amenities include water, pet rules, pets permitted, playground, pool, trash service, club house, controlled access; Senior community; Street lighting in neighborhood; Manager approval required for tenancy
Exterior
- Parking: Covered parking; Driveway-level parking; Attached carport; Parking available in Cherokee Mobile Home Park
- Security: Controlled access (community amenity)
- Utilities: Public sewer; District/public water
- Home design: Mobile home (14' x 50'); Single-story; Entry at level 1
- Construction: Mobile home remains on site; Built year per assessor
- Exterior features: Community pool; Corner lot
Interior
- Flooring: Laminate flooring
- Bathrooms: 1 full bathroom
- Interior features: Sliding glass door(s); Community spa
- Laundry & utility: Laundry room inside; Individual laundry room; Washer hookup
Neighborhood map
What this means for you Summary
Snapshot
- This is a 2-bed/1.0-bath manufactured listed at $170k.
Deal economics
- At list price, monthly cash flow is $144 ($2k/yr) — positive.
- The deal already cash-flows at list — no discount required.
- Meets the 1% rule at list price ($2k rent vs $170k).
- Recommended offer: $165k (3.0% below list) — sets the bar for market timing.
- Cap rate 7.3% vs local median 2.2% in Anaheim — top-decile yield for the area; either an underpriced asset or a hidden risk that comps aren't pricing in. Stress-test before assuming the spread holds.
Location & tenants
- Location reads 70/100 on livability (#240 in CA) — a middle-class / working-renter tenant base. Strengths: amenities A+, commute A+, employment A+; Watch: health & safety C-, crime F, cost of living F.
- Centralia Elementary (suburban): math 59% / reading 63% proficiency, ranked #213 of 1,400 in CA (top 15%) — acceptable for families but not a draw, mixed tenant base, ~2y average lease.
- Market conditions: Rents flat; 86 active listings in the ZIP; 40 comparable units currently listed for rent nearby; rentals leasing fast (median 1d on market — plan ~1-2 weeks tenant-placement turnaround); solid renter incomes; 6,974 units permitted in Orange County in 2024 (3,839 in 5+ unit buildings).
- This rent runs 34% of the median local income ($76k/yr) — at the standard rent-burdened threshold; future hikes will face affordability resistance.
Forward outlook
- Local home prices are declining (-3.0%/yr); year-one equity from $1k of loan paydown is wiped out by about $5k of value loss. Plan a longer hold.
- Orange County population projected at +14% by 2050 — modest demand growth; plan on rents tracking national, not racing it.
Negotiation context
- It's been on market 59 days — a 3% lower offer ($165k) is reasonable based on typical stale-listing flexibility.
Risks & watch-outs
- Watch-outs: HOA is 25% of rent.
- Climate carrying-cost: major flood risk; extreme-heat days projected 7→23/yr by 2055 (HVAC capex compounding) — expect insurance premiums to compound above CPI over the hold.
Questions for the listing agent
- It's been on market 59 days. Have you received any prior offers? Is the seller open to a 3% concession, seller financing, or rate buy-down credit?
- Built in 1963 — when were the roof, HVAC, electrical panel, plumbing, and water heater last replaced?
- What does the HOA fee cover, when was the last increase, and are there any pending special assessments or reserve-fund shortfalls?
- Is there a deadline driving the sale (1031 exchange, divorce, estate, relocation)? That informs how much negotiation room exists.
- Crime grade is F in this area — have there been break-ins, vandalism, or insurance claims at this property in the last 3 years? What carrier currently insures it and at what premium?
- What's the average days-on-market for RENTAL listings here right now (not sales)? A rising rental-DOM trend means longer vacancies and softer asking-rent achievability than the comps imply.
- What's the recent tenant-quality profile in this submarket — average credit score on applications, eviction rate, late-payment / NSF rate, and stable-employment percentage? A property-management company in the area should have these aggregated.
- How much new for-sale + rental construction is in the pipeline within 1–3 miles? Heavy new supply typically softens prices + rents 12–24 months out; constrained supply supports both.
Investment metrics
- 1% rule
- 1.26% ✓
- Cap rate
- 7.31%
- Cash-on-cash
- 3.63%
- DSCR
- 1.16
- GRM
- 6.6
CMA / ARV
No comps found within radius.
Projected returns pro-forma
-3.0% appreciation · 0.57% rent growth · sell at horizon
- IRR
- -14.0%
- Equity multiple
- 0.51×
- Total profit
- $-23,247
- Equity at exit
- $25,348
- IRR
- -11.1%
- Equity multiple
- 0.42×
- Total profit
- $-27,415
- Equity at exit
- $14,698
Cash invested: $47,600 (down + closing). Projections, not guarantees.
Landlord ↔ Tenant lean methodology
- Overall (STATE)
- 18 Strongly Tenant-Friendly
- State California
- 18 Strongly Tenant-Friendly · D+13
- County
- — inherits STATE
- City
- — inherits STATE
ZIP-level market 92804
- Rents YoY
- 0.6%
- Active inventory
- 86
- Price-to-rent
- 6.6×
Monthly cashflow live
- Estimated rent
- $2,149 high interval (Pro) →
- Mortgage (P&I)
- −$891
- Tax from tax record
- −$45 /mo · $535/yr
- Insurance
- −$71
- HOA
- −$547
- Vacancy / Maint / Mgmt
- −$451
- Net cashflow
- $144
Break-even live
UW: 25.0% down · 7.5% · 30yr · 1.5% tax · 5.0% vac · 8.0% maint · 8.0% mgmt
Financing live
Cash to close
- Down payment
- $42,500
- Closing costs
- $5,100
- Reserves months
- —
- Total cash needed
- —
Loan-product check · same deal, 3 products live
Conventional
25% down · 7.5% · 30yr
- Down + closing
- —
- Monthly P&I
- —
- Monthly cashflow
- —
- DSCR
- —
- Eligible?
- —
Personal DTI + credit; lowest rate.
DSCR
20% down · 8.5% · 30yr
- Down + closing
- —
- Monthly P&I
- —
- Monthly cashflow
- —
- DSCR
- —
- Eligible?
- —
No personal income docs; deal must DSCR.
Hard money
10% down · 12.0% · 12mo
- Down + closing
- —
- Monthly P&I
- —
- Monthly cashflow
- —
- DSCR
- —
- Eligible?
- —
Short-term bridge; refi at stabilization.
Rent comps 40 comps
| Address | Beds | Baths | Sqft | Rent | $/sqft | DOM | Units | Dist |
|---|---|---|---|---|---|---|---|---|
| 401 S Beach Blvd Unit 208 Anaheim, CA | 1.0 | 1.0 | 722 | $1,850 | $2.56 | 1d | 1 | 0.08mi |
| 401 S Beach Blvd Unit 207 Anaheim, CA | 1.0 | 1.0 | 722 | $1,850 | $2.56 | 2d | 1 | 0.08mi |
| 401 S Beach Blvd Unit 215 Anaheim, CA | 1.0 | 1.0 | 722 | $1,850 | $2.56 | 16d | 1 | 0.08mi |
| 8 Banick Dr Unit 9181-8 Anaheim, CA | 1.0 | 1.0 | 525 | $1,850 | $3.52 | 1d | 1 | 0.17mi |
| 120 S Grand Ave Unit 102 Anaheim, CA | 1.0 | 1.0 | 735 | $2,270 | $3.09 | 19d | 1 | 0.26mi |
| 120 S Grand Ave Unit 36 Anaheim, CA | 1.0 | 1.0 | 735 | $2,290 | $3.12 | 10d | 1 | 0.26mi |
| 225 S Western Ave Anaheim, CA | 1.0 | 1.0 | 528 | $1,904 | $3.60 | 1d | 2 | 0.48mi |
| 2828 W Lincoln Ave Anaheim, CA | 1.0–2.0 | 1.0–1.5 | 870 | $2,550 | $2.93 | 1d | 4 | 0.49mi |
| 3233 W Lincoln Ave Anaheim, CA | 1.0–2.0 | 1.0–2.0 | 855 | $2,700 | $3.16 | 1d | 5 | 0.60mi |
| 111 N Western Ave Anaheim, CA | 1.0–2.0 | 1.0 | 846 | $2,140 | $2.53 | 1d | 1 | 0.61mi |
| 3230 W Lincoln Ave Anaheim, CA | 1.0–2.0 | 1.0 | 750 | $2,550 | $3.40 | 1d | 1 | 0.62mi |
| 145 S Westchester Dr Anaheim, CA | 1.0–2.0 | 1.0 | 800 | $2,595 | $3.24 | 1d | 4 | 0.69mi |
| 3300 W Lincoln Ave Anaheim, CA | 1.0–2.0 | 1.0–2.0 | 809 | $2,800 | $3.46 | 1d | 3 | 0.73mi |
| 2910 W Ball Rd Anaheim, CA | 1.0 | 1.0 | 650 | $2,045 | $3.15 | 1d | 2 | 0.79mi |
| 120 N Syracuse St Anaheim, CA | 1.0–2.0 | 1.0 | 771 | $2,540 | $3.29 | 1d | 6 | 0.79mi |
| 121 N La Reina Cir Anaheim, CA | 1.0 | 1.0 | 750 | $1,938 | $2.58 | 1d | 2 | 0.87mi |
| 3424 W Orange Ave Anaheim, CA | 1.0 | 1.0 | 580 | $1,925 | $3.32 | 1d | 1 | 0.92mi |
| 3428 W Orange Ave Anaheim, CA | 1.0–2.0 | 1.0–2.0 | 800 | $2,650 | $3.31 | 1d | 5 | 0.94mi |
| 2642 W Lincoln Ave Anaheim, CA | 2.0 | 1.0–2.0 | 725 | $2,559 | $3.53 | 10d | 6 | 0.94mi |
| 1200 Sharon Cir Unit 5 Anaheim, CA | 1.0 | 1.0 | 575 | $1,895 | $3.30 | 1d | 1 | 0.99mi |
| 119 S Magnolia Ave Unit 15 Anaheim, CA | 1.0 | 1.0 | 650 | $1,895 | $2.92 | 1d | 1 | 1.04mi |
| 7862 2nd St Stanton, CA | 1.0 | 1.0 | 720 | $2,000 | $2.78 | 18d | 1 | 1.05mi |
| 150 S Magnolia Ave Anaheim, CA | 1.0 | 1.0 | 680 | $2,345 | $3.45 | 1d | 5 | 1.06mi |
| 150 S Magnolia Ave Unit 253 Anaheim, CA | 1.0 | 1.0 | 680 | $2,290 | $3.37 | 5d | 1 | 1.06mi |
| 2704 W Ball Rd Apt 6G Anaheim, CA | 1.0 | 1.0 | 700 | $2,240 | $3.20 | 16d | 1 | 1.13mi |
| 3523 W Savanna St Unit 19 Anaheim, CA | 1.0 | 1.0 | 600 | $1,900 | $3.17 | 2d | 1 | 1.16mi |
| 3700 W Mungall Dr Anaheim, CA | 1.0 | 1.0 | 700 | $1,995 | $2.85 | 1d | 1 | 1.17mi |
| 120 N Magnolia Ave Anaheim, CA | 1.0–2.0 | 1.0 | 855 | $2,745 | $3.21 | 1d | 6 | 1.17mi |
| 7187 Santa Lucia Cir Buena Park, CA | 1.0 | 1.0 | 700 | $1,900 | $2.71 | 1d | 1 | 1.19mi |
| 2660 W Ball Rd Anaheim, CA | 1.0 | 1.0 | 704 | $1,950 | $2.77 | 1d | 2 | 1.19mi |
| 2648 W Ball Rd Anaheim, CA | 1.0–2.0 | 1.0–2.0 | 843 | $2,600 | $3.08 | 1d | 1 | 1.22mi |
| 3931 W Orange Ave Anaheim, CA | 1.0–2.0 | 1.0 | 847 | $2,699 | $3.18 | 1d | 6 | 1.29mi |
| 2515 W Lincoln Ave Anaheim, CA | 1.0–3.0 | 1.0–2.0 | 1024 | $2,525 | $2.47 | 1d | 1 | 1.31mi |
| 3534 W Ball Rd Anaheim, CA | 1.0 | 1.0 | 632 | $2,075 | $3.28 | 1d | 1 | 1.34mi |
| 10453 Westchester Dr Stanton, CA | 2.0 | 2.0 | 700 | $3,300 | $4.71 | 2d | 1 | 1.37mi |
| 8641 W Cerritos Ave Unit F Stanton, CA | 1.0 | 1.0 | 620 | $1,650 | $2.66 | 1d | 1 | 1.39mi |
| 8641 W Cerritos Ave Unit B Stanton, CA | 1.0 | 1.0 | 620 | $1,800 | $2.90 | 1d | 1 | 1.39mi |
| 905 S Webster Ave Anaheim, CA | 1.0 | 1.0 | 655 | $2,060 | $3.15 | 1d | 3 | 1.43mi |
| 6882 San Paco Cir Unit B Buena Park, CA | 1.0 | 1.0 | 550 | $2,500 | $4.55 | 18d | 1 | 1.45mi |
| 2520 W Ball Rd Anaheim, CA | 1.0 | 1.0 | 650 | $2,128 | $3.27 | 1d | 2 | 1.46mi |
HOA detail
- Monthly dues
- $547 · $6,564/yr
Listing history 15 events
-
2026-06-18days on market $170,000 Active 59 DOM
-
2026-06-17days on market $170,000 Active 58 DOM
-
2026-06-16days on market $170,000 Active 57 DOM
-
2026-06-15days on market $170,000 Active 56 DOM
-
2026-06-13days on market $170,000 Active 54 DOM
-
2026-06-13days on market $170,000 Active 53 DOM
-
2026-06-09days on market $170,000 Active 50 DOM
-
2026-06-08days on market $170,000 Active 49 DOM
-
2026-06-07days on market $170,000 Active 48 DOM
-
2026-06-04days on market $170,000 Active 45 DOM
-
2026-06-03days on market $170,000 Active 44 DOM
-
2026-06-02days on market $170,000 Active 43 DOM
-
2026-06-01days on market $170,000 Active 42 DOM
-
2026-05-31days on market $170,000 Active 41 DOM
-
2026-04-20$170,000 Active
ⓘ Source: listings_history table (triggers on properties + properties_extension) + one-shot
backfill from property_details.listing_events for pre-trigger history.
Tax reassessment forecast CA · Resets to sale price
- Current annual tax
- $535 · $45/mo
- Projected year-2 tax
- $1,292 · $108/mo
- Expected delta
- +$757/yr (+$63/mo · 141.5%)
ⓘ Screening estimate from a state-policy table — verify with the county assessor before closing.
Climate risk First Street
- Flood 6/10 Major FEMA zone X (shaded) · 80% chance over 30 yrs
- Wildfire 1/10 Low
- Heat 5/10 Major 7 d/yr ≥91°F today · 23 d/yr by 30 yrs out
- Wind 1/10 Low
- Air quality 5/10 Major 7 unhealthy d/yr today · 8 by 30 yrs out
Nearby sold comps map
Loading sold comps map…
Walkable amenities ~0.75 mi
Loading nearby amenities…
Taxation est. · year 1
- Rental income
- $25,790
- − Mortgage interest
- −$9,523
- − Property taxes
- −$535
- − Insurance
- −$850
- − Repairs & maintenance
- −$2,063
- − Management
- −$2,063
- − HOA
- −$6,564
- − Depreciation
- −$4,945
- Taxable loss
- −$754
- Est. tax savings @ 24.0%
- +$181
- After-tax cash flow
- $1,908/yr
For passive investors: Depreciation is non-cash, so a rental often shows a tax loss while cash-flowing — sheltering income. Rental losses are passive: they offset passive income freely, and up to $25,000/yr can offset ordinary (W-2) income if you actively participate and your MAGI is under $100k (phasing out to $0 by $150k); unused losses carry forward. On sale, claimed depreciation is recaptured at up to 25%, and gains may owe capital-gains tax (a 1031 exchange can defer both). Figures are a year-1 estimate at your 24.0% rate — not tax advice; consult a CPA.
Schools (NCES district)
- District
- Centralia Elementary
- NCES district ID
- 0608070
- Math proficiency
- 59% ▲ 1.00%
- Reading proficiency
- 63% ▬ 0.00%
- Median HH income
- $66,022
- Composite
- 55.0/100
- National rank
- #2782
- State rank
- #213 of 1400 in CA
Livability — Anaheim
- Score
- 70/100
- State rank
- #240
- US rank
- #7861
Category grades
Schools grade is shown separately in the Schools card above.
Census & demographics
- Census place
- Anaheim, CA
- County
- Orange County · 3,096,323 people
- City population
- 361,715
- Metro
- Los Angeles-Long Beach-Anaheim, CA
- Population (ZIP)
- 83,537
- Household income
- $76,141
- Rent vs Own
- Severe rent burden
- 5698.0
Population outlook (Orange County) Hauer SSP2
- Today (2025)
- 3,477,456 people
- By 2030
- 3,613,117 · +3.9%
- By 2040
- 3,835,945 · +10.3%
- By 2050
- 3,968,736 · +14.1%
- By 2075
- 4,097,053 · +17.8%
- By 2100
- 3,903,633 · +12.3%
Race, ethnicity, and origin ACS 2023
- Neighborhood character
- Diverse neighborhood (Simpson 0.68)
- Race & ethnicity
- Hispanic / Latino 46% Asian 27% White 20% Two or more races 17% Black 3% Pacific Islander 1% Native American 1%
- Hispanic origin (detail)
- Mexican 40%
- Common ancestry
- Lithuanian 1%
- Foreign-born
- 40% · Canada, Vietnam, South Korea
- Languages at home
- 37% English-only · Spanish 36% Vietnamese 13% Tagalog/Filipino 4%
Political lean MEDSL · Orange
- 2024 margin
- Toss-up / Even · D 49.7% · R 47.1% · Other 3.2%
- 2008→2024 swing
- +5.2pp toward D · 2008: -2.6pp · 2024: 2.6pp
- All cycles
- 2024: D+2.6 2020: D+9.0 2016: D+7.7 2012: R+8.3 2008: R+2.6
Not yet ingested
- Civics
- —
Market trends
- HPI YoY
- ▼ -875.49%
- Current HPI
- 443.6764
- Rent YoY
- ▲ 0.57%
- Metro
- Los Angeles-Long Beach-Anaheim, CA
- State GDP YoY
- ▲ 3.21%
- F500 in state
- 116
Industry mix (Fortune 500 HQ in CA)
| Industry | F500 HQs | Revenue |
|---|---|---|
| Technology | 27 | $1,492B |
|
||
| Financial Services | 3 | $174B |
|
||
| Retail | 3 | $44B |
|
||
| Insurance | 3 | $26B |
|
||
| Media / Entertainment | 2 | $115B |
|
||
| Pharmaceuticals / Biotech | 2 | $62B |
|
||
Price history
1 event — show timeline
- 2026-04-20 Listed $170,000 CRMLS
Property tax history
+7.0%/yrLatest (2025): $535 · +4.4% YoY. Source: county tax records.
Cash-flow waterfall
monthlySold comps — $/sqft
last 12 mo · ≤1 miLoading sold comps…