617 Oak Park #617 · Boerne, TX
Flood risk 1/10 · Minimal
- FEMA flood zone
- X (unshaded)
- Chance of flooding over 30 yrs
- 0.0%
- Est. flood insurance / yr
- $507 – $1,088
Fire risk 5/10 · Moderate
- Est. fire insurance / yr
- $1,222 – $2,270
Heat risk 7/10 · Major
- Hot days now (above 104°F)
- 7 days/yr
- Hot days in 30 yrs
- 24 days/yr
Wind risk 6/10 · Moderate
- Chance of severe wind over 30 yrs
- 66.0%
Air-quality risk 2/10 · Minimal
- Unhealthy air days now
- 0 days/yr
- Unhealthy air days in 30 yrs
- 1 days/yr
Risk factors via First Street. Map © Google.
Why this score? — see what drove the C- grade
The composite is a weighted blend of 9 inputs, each scored 0–100. Each bar is that input's sub-score; the figure is the points it added to the 100-point composite (weight × sub-score).
- ARV discount +15.0/15.0
- Cash flow +12.6/30.0
- Schools +5.4/10.0
- 1% rule +4.5/10.0
- Livability +3.9/5.0
- DSCR +3.8/10.0
- Rent growth +3.5/5.0
- Condition / age +2.5/5.0
- Appreciation +0.0/10.0
$199,965
🖨 Deal sheet (PDF) 📄 Offer letter ✓ Due diligence
Listing remarks MLS
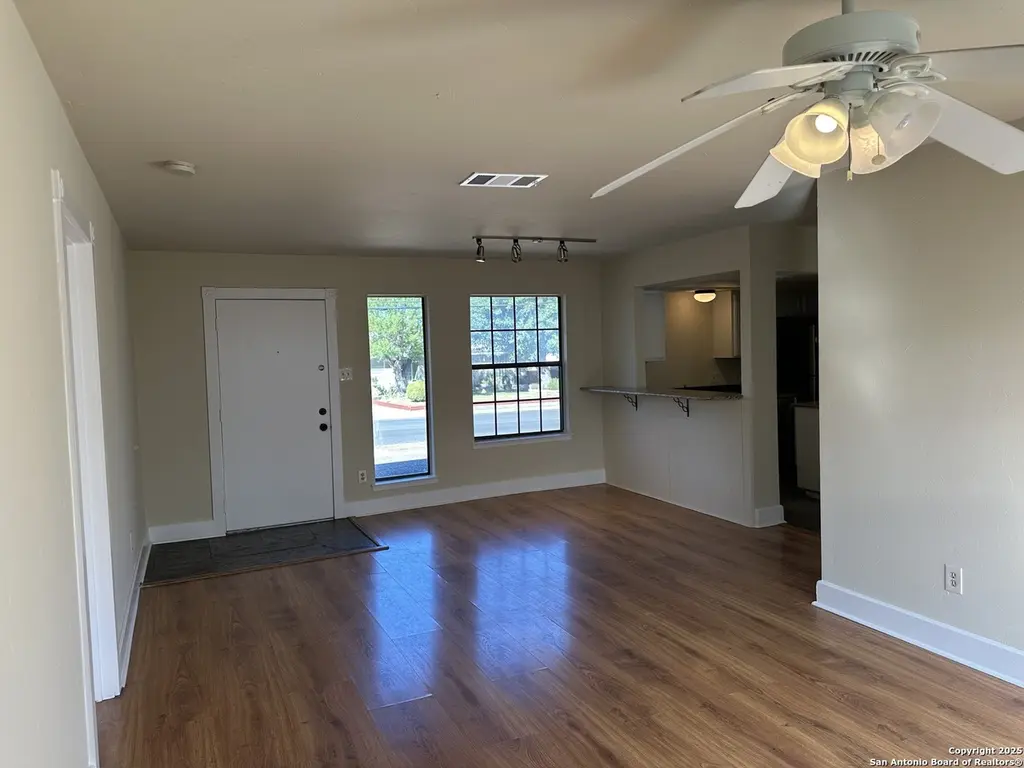
Excellent Location in the heart of Boerne! Incredible condominium opportunity walking distance to downtown Boerne. This unit has just received a fresh renovation, brand new appliances and a brand new water heater! This adorable home is ready for a new owner to move in and make it their own. Granite counter tops and fresh paint throughout make this unit an inviting opportunity for the owner occupant or investor alike. One covered parking spot and another open parking spot in security gated parking round out the amenities. Minutes to downtown Boerne, shopping or to I10 for commuting, this is everywhere you want to be. Owner occupants can get financed with preferred lender! Come see it today!
Key facts
- Brand new appliances
- Granite counter tops
- Fresh renovation
Tags
Neighborhood map
What this means for you Summary
Snapshot
- This is a 3-bed/2.0-bath condo listed at $200k.
Deal economics
- At list price, monthly cash flow is $-25 ($-294/yr) — negative.
- To cash-flow at today's rent, offer at most $196k (1.8% below list).
- To meet the 1% rule (rent ≥ 1% of price), the offer needs to be $190k (4.9% below list).
- Recommended offer: $176k (12.0% below list) — sets the bar for market timing.
- Cap rate 6.1% vs local median 2.4% in Boerne — top-decile yield for the area; either an underpriced asset or a hidden risk that comps aren't pricing in. Stress-test before assuming the spread holds.
Location & tenants
- Location reads 77/100 on livability (#87 in TX, #3,046 nationally) — a middle-class / working-renter tenant base. Strengths: employment A+, housing A+, crime A; Watch: cost of living C-, amenities D+, commute F.
- Boerne ISD (town): math 59% / reading 61% proficiency, ranked #42 of 826 in TX (top 5%) — acceptable for families but not a draw, mixed tenant base, ~2y average lease.
- Market conditions: Rents rising (+4.0%/yr); 1119 active listings in the ZIP; 22 comparable units currently listed for rent nearby; rentals leasing fast (median 6d on market — plan ~1-2 weeks tenant-placement turnaround); high-income renter base; 517 units permitted in Kendall County in 2024 (0 in 5+ unit buildings).
Forward outlook
- Local home prices are declining (-3.0%/yr); year-one equity from $1k of loan paydown is wiped out by about $6k of value loss. Plan a longer hold.
- Kendall County population projected at +76% by 2050 — long-run rental-demand tailwind backs the buy-and-hold thesis.
Negotiation context
- It's been on market 234 days — a 12% lower offer ($176k) is reasonable based on typical stale-listing flexibility.
- 3 sale attempts since 19y ago with the ask held roughly flat each time — persistent listings suggest the price (not the market) is what's stuck; bring a comps-based counter.
Risks & watch-outs
- Climate carrying-cost: major wind risk, 66% chance of damaging wind over 30y; moderate wildfire risk; extreme-heat days projected 7→24/yr by 2055 (HVAC capex compounding) — expect insurance premiums to compound above CPI over the hold.
Questions for the listing agent
- What do current leases actually rent for vs. the listed asking? Can we see a recent rent roll and the last 12 months of T-12 income?
- It's been on market 234 days. Have you received any prior offers? Is the seller open to a 12% concession, seller financing, or rate buy-down credit?
- Built in 1976 — when were the roof, HVAC, electrical panel, plumbing, and water heater last replaced?
- What does the HOA fee cover, when was the last increase, and are there any pending special assessments or reserve-fund shortfalls?
- Any open or pending special assessments — roof, HVAC, plumbing, elevator, façade? What's the per-unit balance and payoff schedule, and is the seller paying it off at close or rolling it to the buyer?
- Why hasn't it sold? Are there any deal-killer items the seller is aware of (foundation, flood, title, zoning, code violations)?
- Is there a deadline driving the sale (1031 exchange, divorce, estate, relocation)? That informs how much negotiation room exists.
- Schools are B-rated — typically a magnet for longer-tenancy family renters. What's the average tenant stay here, and is there a school-zone premium baked into asking?
- What's the average days-on-market for RENTAL listings here right now (not sales)? A rising rental-DOM trend means longer vacancies and softer asking-rent achievability than the comps imply.
- What's the recent tenant-quality profile in this submarket — average credit score on applications, eviction rate, late-payment / NSF rate, and stable-employment percentage? A property-management company in the area should have these aggregated.
- How much new apartment / multifamily construction is in the pipeline within 1–3 miles? Heavy new supply (>2% of stock underway) typically softens rents 12–24 months out; light construction supports rent growth.
Investment metrics
- 1% rule
- 0.95% ✗
- Cap rate
- 6.15%
- Cash-on-cash
- -0.53%
- DSCR
- 0.98
- GRM
- 8.8
CMA / ARV
- ARV (median comp)
- $319,029
- List price
- $199,965
- Delta
- -37.32%
- Verdict
- UNDERPRICED
- Comps
- 20 within 1.0 mi
Projected returns pro-forma
-3.0% appreciation · 3.99% rent growth · sell at horizon
- IRR
- -15.9%
- Equity multiple
- 0.43×
- Total profit
- $-31,934
- Equity at exit
- $29,815
- IRR
- -5.6%
- Equity multiple
- 0.62×
- Total profit
- $-21,329
- Equity at exit
- $17,289
Cash invested: $55,990 (down + closing). Projections, not guarantees.
Landlord ↔ Tenant lean methodology
- Overall (STATE)
- 87 Strongly Landlord-Friendly
- State Texas
- 87 Strongly Landlord-Friendly · R+5
- County
- — inherits STATE
- City
- — inherits STATE
ZIP-level market 78006
- Home prices YoY
- -28.5%
- Rents YoY
- 4.0%
- Active inventory
- 1119
- Price-to-rent
- 8.8×
Monthly cashflow live
- Estimated rent
- $1,902 high interval (Pro) →
- Mortgage (P&I)
- −$1,049
- Tax est. 1.5%
- −$250 /mo · $2,999/yr
- Insurance
- −$83
- HOA
- −$145
- Vacancy / Maint / Mgmt
- −$399
- Net cashflow
- $-25
Break-even live
Sensitivity live
| Price | -10% $114 | -5% $45 | +0% $-25 | +5% $-94 | +10% $-163 |
|---|---|---|---|---|---|
| Rent | -10% $-175 | -5% $-100 | +0% $-25 | +5% $51 | +10% $126 |
| Rate | -1.0pp $76 | -0.5pp $26 | base $-25 | +0.5pp $-76 | +1.0pp $-129 |
UW: 25.0% down · 7.5% · 30yr · 1.5% tax · 5.0% vac · 8.0% maint · 8.0% mgmt
Financing live
Cash to close
- Down payment
- $49,991
- Closing costs
- $5,999
- Reserves months
- —
- Total cash needed
- —
Loan-product check · same deal, 3 products live
Conventional
25% down · 7.5% · 30yr
- Down + closing
- —
- Monthly P&I
- —
- Monthly cashflow
- —
- DSCR
- —
- Eligible?
- —
Personal DTI + credit; lowest rate.
DSCR
20% down · 8.5% · 30yr
- Down + closing
- —
- Monthly P&I
- —
- Monthly cashflow
- —
- DSCR
- —
- Eligible?
- —
No personal income docs; deal must DSCR.
Hard money
10% down · 12.0% · 12mo
- Down + closing
- —
- Monthly P&I
- —
- Monthly cashflow
- —
- DSCR
- —
- Eligible?
- —
Short-term bridge; refi at stabilization.
Rent comps 22 comps
| Address | Beds | Baths | Sqft | Rent | $/sqft | DOM | Units | Dist |
|---|---|---|---|---|---|---|---|---|
| 2150 Paniolo Dr Boerne, TX | 2.0 | 2.5 | 1421 | $2,200 | $1.55 | 15d | 1 | 0.08mi |
| 515 Oak Park Dr #515 Boerne, TX | 2.0 | 2.0 | 1116 | $1,950 | $1.75 | 5d | 1 | 0.09mi |
| 701 Oak Park Dr Unit 2213 Boerne, TX | 2.0 | 2.0 | 1086 | $1,322 | $1.22 | 4d | 1 | 0.24mi |
| 701 Oak Park Dr Unit 3213 Boerne, TX | 3.0 | 2.0 | 1261 | $2,102 | $1.67 | 4d | 1 | 0.24mi |
| 224 Frey St Boerne, TX | 3.0 | 2.0 | 1413 | $2,300 | $1.63 | 3d | 1 | 0.25mi |
| 130 Gallant Fox Ln Boerne, TX | 1.0–3.0 | 1.0–2.0 | 1003 | $2,462 | $2.45 | 0d | 23 | 0.35mi |
| 711 River Rd Boerne, TX | 1.0–3.0 | 1.0–2.0 | 884 | $2,157 | $2.44 | 2d | 13 | 0.46mi |
| 718 River Rd Boerne, TX | 2.0 | 1.0 | 950 | $1,650 | $1.74 | 44d | 1 | 0.50mi |
| 114 Aransas Pass Boerne, TX | 3.0 | 1.0 | 1252 | $1,775 | $1.42 | 15d | 1 | 0.51mi |
| 143 County Rd 290 Boerne, TX | 2.0 | 2.0 | 966 | $2,050 | $2.12 | 44d | 1 | 0.51mi |
| 1218 S Main St Boerne, TX | 1.0–2.0 | 1.0–2.0 | 700 | $1,000 | $1.43 | 24d | 1 | 0.68mi |
| 728 Rosewood Ave Boerne, TX | 2.0 | 1.0 | 891 | $1,300 | $1.46 | 3d | 1 | 0.77mi |
| 400 Rosewood Ave Boerne, TX | 2.0 | 1.0 | 830 | $1,185 | $1.43 | 2d | 3 | 0.88mi |
| 216 Ivy Ln Boerne, TX | 2.0 | 1.0–2.0 | 912 | $1,199 | $1.31 | 2d | 5 | 0.95mi |
| 116 Bentwood Dr Unit 0132 Boerne, TX | 2.0 | 1.5 | 1200 | $1,379 | $1.15 | 44d | 1 | 1.06mi |
| 1681 River Rd Unit 710 Boerne, TX | 2.0 | 2.0 | 997 | $1,213 | $1.22 | 11d | 1 | 1.15mi |
| 1681 River Rd Boerne, TX | 1.0–3.0 | 1.0–2.0 | 995 | $2,013 | $2.02 | 2d | 13 | 1.15mi |
| 150 Medical Dr Boerne, TX | 1.0–2.0 | 1.0–2.0 | 817 | $1,276 | $1.56 | 2d | 12 | 1.18mi |
| 111 N Brackenridge Boerne, TX | 2.0 | 2.0 | 1075 | $1,750 | $1.63 | 44d | 1 | 1.21mi |
| 1687 River Rd Boerne, TX | 2.0 | 2.0 | 997 | $1,700 | $1.71 | 44d | 1 | 1.22mi |
| 102 N School St Boerne, TX | 2.0 | 1.0 | 980 | $2,600 | $2.65 | 5d | 1 | 1.26mi |
| 143 Oak Grove Dr Boerne, TX | 3.0 | 2.0 | 1197 | $1,995 | $1.67 | 44d | 1 | 1.47mi |
HOA detail condo
- Monthly dues
- $145 · $1,740/yr
- Likely covers
- watersecurity
- Assessments
- None detected in remarks — confirm with the listing agent.
Listing history 20 events
-
2026-06-21days on market $199,965 Active 234 DOM
-
2026-06-18days on market $199,965 Active 231 DOM
-
2026-06-17days on market $199,965 Active 230 DOM
-
2026-06-16days on market $199,965 Active 229 DOM
-
2026-06-15days on market $199,965 Active 228 DOM
-
2026-06-13days on market $199,965 Active 226 DOM
-
2026-06-13days on market $199,965 Active 225 DOM
-
2026-06-09days on market $199,965 Active 222 DOM
-
2026-06-08days on market $199,965 Active 221 DOM
-
2026-06-07days on market $199,965 Active 220 DOM
-
2026-06-04days on market $199,965 Active 217 DOM
-
2026-06-03days on market $199,965 Active 216 DOM
-
2026-06-02days on market $199,965 Active 215 DOM
-
2026-06-01days on market $199,965 Active 214 DOM
-
2026-05-31days on market $199,965 Active 213 DOM
-
2025-10-30$199,965 New 699-char remark
Show marketing remark (699 chars)
Excellent Location in the heart of Boerne! Incredible condominium opportunity walking distance to downtown Boerne. This unit has just received a fresh renovation, brand new appliances and a brand new water heater! This adorable home is ready for a new owner to move in and make it their own. Granite counter tops and fresh paint throughout make this unit an inviting opportunity for the owner occupant or investor alike. One covered parking spot and another open parking spot in security gated parking round out the amenities. Minutes to downtown Boerne, shopping or to I10 for commuting, this is everywhere you want to be. Owner occupants can get financed with preferred lender! Come see it today!
-
2007-05-15historical
-
2007-02-09$150,000
-
2007-02-09historical
-
2007-02-05$150,000
ⓘ Source: listings_history table (triggers on properties + properties_extension) + one-shot
backfill from property_details.listing_events for pre-trigger history.
Climate risk First Street
- Flood 1/10 Low FEMA zone X (unshaded) · 0% chance over 30 yrs
- Wildfire 5/10 Major
- Heat 7/10 Severe 7 d/yr ≥104°F today · 24 d/yr by 30 yrs out
- Wind 6/10 Major 66% chance of damaging wind over 30 yrs
- Air quality 2/10 Low 0 unhealthy d/yr today · 1 by 30 yrs out
Nearby sold comps map
Loading sold comps map…
Walkable amenities ~0.75 mi
Loading nearby amenities…
Taxation est. · year 1
- Rental income
- $22,821
- − Mortgage interest
- −$11,201
- − Property taxes
- −$2,999
- − Insurance
- −$1,000
- − Repairs & maintenance
- −$1,826
- − Management
- −$1,826
- − HOA
- −$1,740
- − Depreciation
- −$5,817
- Taxable loss
- −$3,588
- Est. tax savings @ 24.0%
- +$861
- After-tax cash flow
- $567/yr
For passive investors: Depreciation is non-cash, so a rental often shows a tax loss while cash-flowing — sheltering income. Rental losses are passive: they offset passive income freely, and up to $25,000/yr can offset ordinary (W-2) income if you actively participate and your MAGI is under $100k (phasing out to $0 by $150k); unused losses carry forward. On sale, claimed depreciation is recaptured at up to 25%, and gains may owe capital-gains tax (a 1031 exchange can defer both). Figures are a year-1 estimate at your 24.0% rate — not tax advice; consult a CPA.
Schools (NCES district)
- District
- Boerne ISD
- NCES district ID
- 4810710
- Math proficiency
- 59% ▼ -9.00%
- Reading proficiency
- 61% ▼ -6.00%
- Median HH income
- $85,478
- Composite
- 54.47/100
- National rank
- #1350
- State rank
- #42 of 826 in TX
Livability — Boerne
- Score
- 77/100
- State rank
- #87
- US rank
- #3046
Category grades
Schools grade is shown separately in the Schools card above.
Census & demographics
- Census place
- Boerne, TX
- County
- Kendall County · 44,560 people
- City population
- 44,560
- Metro
- San Antonio-New Braunfels, TX
- Population (ZIP)
- 44,560
- Household income
- $116,156
- Rent vs Own
- Severe rent burden
- 1446.0
Population outlook (Kendall County) Hauer SSP2
- Today (2025)
- 56,273 people
- By 2030
- 64,578 · +14.8%
- By 2040
- 81,624 · +45.1%
- By 2050
- 99,180 · +76.2%
- By 2075
- 144,012 · +155.9%
- By 2100
- 177,185 · +214.9%
Race, ethnicity, and origin ACS 2023
- Neighborhood character
- Predominantly White (72%)
- Race & ethnicity
- White 72% Hispanic / Latino 22% Two or more races 14% Asian 1% Black 1%
- Hispanic origin (detail)
- Mexican 16%
- Common ancestry
- Slovak 3% Romanian 2% Lithuanian 2%
- Foreign-born
- 6% · Canada, Jamaica, China
- Languages at home
- 86% English-only · Spanish 11%
Political lean MEDSL · Kendall
- 2024 margin
- Solid R (+55.7) · D 21.7% · R 77.4%
- 2008→2024 swing
- +0.3pp no change · 2008: -56.0pp · 2024: -55.7pp
- All cycles
- 2024: R+55.7 2020: R+53.2 2016: R+60.4 2012: R+64.5 2008: R+56.0
Not yet ingested
- Civics
- —
Market trends
- HPI YoY
- ▼ -108.83%
- Current HPI
- 273.2929
- Rent YoY
- ▲ 3.99%
- Metro
- San Antonio-New Braunfels, TX
- State GDP YoY
- ▲ 3.95%
- F500 in state
- 110
Industry mix (Fortune 500 HQ in TX)
| Industry | F500 HQs | Revenue |
|---|---|---|
| Energy | 16 | $1,198B |
|
||
| Technology | 5 | $198B |
|
||
| Engineering / Construction | 4 | $72B |
|
||
| Energy Services | 3 | $60B |
|
||
| Utilities | 3 | $41B |
|
||
| Healthcare | 2 | $330B |
|
||
Price history
+33.3% since first listed5 events — show timeline
- 2025-10-30 Listed $199,965 LERA
- 2007-05-15 Listing Removed — LERA
- 2007-02-09 Listing Removed — LERA
- 2007-02-09 Listed $150,000 LERA
- 2007-02-05 Listed $150,000 LERA
Cash-flow waterfall
monthlySold comps — $/sqft
last 12 mo · ≤1 miLoading sold comps…