 8-Plex
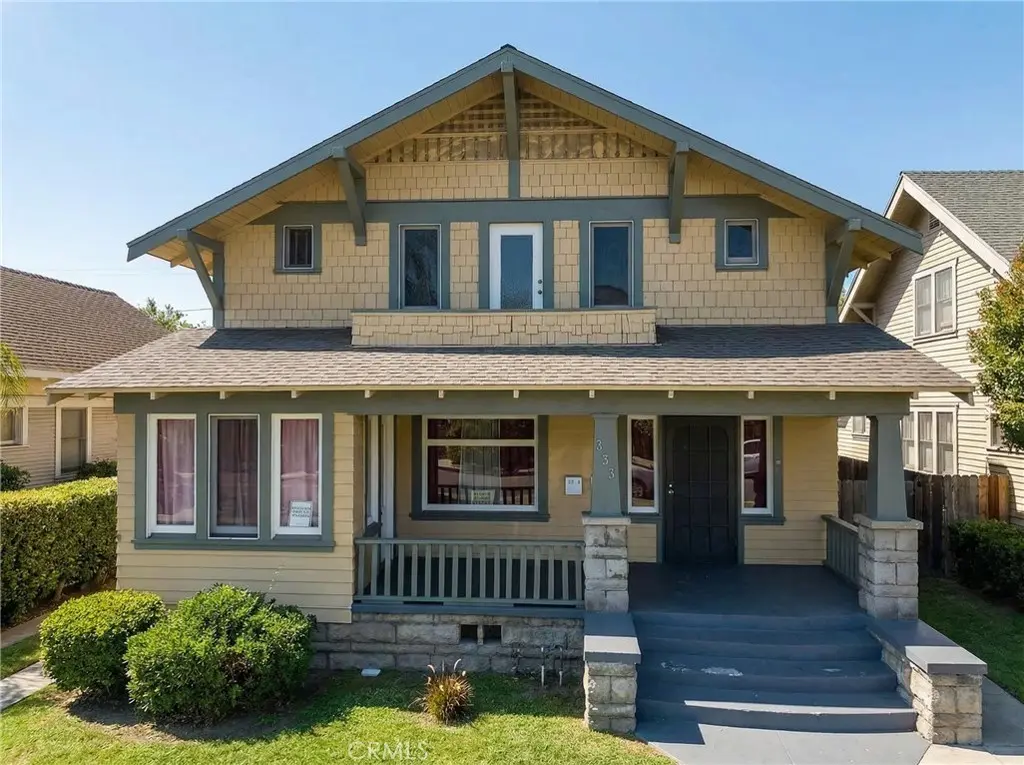
833 Cedar · Long Beach, CA
Flood risk 1/10 · Minimal
- FEMA flood zone
- X (unshaded)
- Chance of flooding over 30 yrs
- 0.0%
- Est. flood insurance / yr
- $507 – $1,088
Fire risk 1/10 · Minimal
- Est. fire insurance / yr
- $659 – $1,223
Heat risk 4/10 · Minor
- Hot days now (above 88°F)
- 7 days/yr
- Hot days in 30 yrs
- 24 days/yr
Wind risk 1/10 · Minimal
- Chance of severe wind over 30 yrs
- —
Air-quality risk 6/10 · Moderate
- Unhealthy air days now
- 9 days/yr
- Unhealthy air days in 30 yrs
- 10 days/yr
Risk factors via First Street. Map © Google.
Why this score? — see what drove the D grade
The composite is a weighted blend of 9 inputs, each scored 0–100. Each bar is that input's sub-score; the figure is the points it added to the 100-point composite (weight × sub-score).
- Cash flow +19.0/30.0
- DSCR +6.0/10.0
- 1% rule +4.4/10.0
- Schools +3.7/10.0
- Livability +3.4/5.0
- Condition / age +2.5/5.0
- Rent growth +2.4/5.0
- ARV discount +0.0/15.0
- Appreciation +0.0/10.0
$1,850,000
🖨 Deal sheet 📄 Offer letter ✓ Due diligence
Multi-family units
County records classify this as Multi-Family (5+ Unit). Listing-text estimate: 8 units. confirmed
5+ unit building — per-unit beds/baths from public records are typically unavailable; the breakdown below (if shown) is an estimate from the listing text.
Listing remarks MLS
9% cap rate! Beautiful Craftsmen Available in Downtown Long Beach, minutes to the beach, Shoreline Village, and the Pike! Discover an exceptional investment opportunity at 833 Cedar Avenue, a prominent 8-unit apartment building located in the heart of Long Beach. This unique multifamily property, just 5 minutes from the beach, boasts two buildings with a total of 6,494 square feet situated on a generous 7,506 square foot lot, offering significant rental income potential. Recent upgrades enhance this property's appeal, including 100% new plumbing installed three to four years ago and new vinyl windows throughout. The conversion to electric heaters means tenants now cover their own heating costs, as they pay for electricity. Strategically zoned LBPD10, this property benefits from one of Long Beach's most desirable and flexible planning districts, allowing for higher density development. This prime location provides residents with excellent access to downtown Long Beach amenities, including diverse dining, entertainment, shopping, and public transportation options. With its robust unit count, considerable square footage, advantageous zoning, and recent improvements, 833 Cedar Avenue is an ideal acquisition for investors seeking a strong performing asset with potential for future upside in a dynamic Long Beach market.
Key facts
- New plumbing
- New vinyl windows
- Zoned lbpd10
Tags
Neighborhood map
What this means for you Summary
Snapshot
- This is a 8 × 4-bed/?-bath units multifamily listed at $1.85M.
Deal economics
- At list price, monthly cash flow is $2k ($23k/yr) — positive. Per door: $239/mo.
- The deal already cash-flows at list — no discount required.
- To meet the 1% rule (rent ≥ 1% of price), the offer needs to be $1.73M (6.4% below list).
- Recommended offer: $1.73M (6.4% below list) — sets the bar for 1% rule.
- Cap rate 7.5% vs local median 1.9% in Long Beach — top-decile yield for the area; either an underpriced asset or a hidden risk that comps aren't pricing in. Stress-test before assuming the spread holds.
Location & tenants
- Location reads 67/100 on livability (#319 in CA) — a middle-class / working-renter tenant base. Strengths: amenities A+, commute A+, employment B+; Watch: health & safety C-, crime F, cost of living F.
- Long Beach Unified (urban): math 34% / reading 50% proficiency, ranked #216 of 517 in CA (top 42%) — families likely to look elsewhere, expect single-tenant / working-renter base with shorter leases.
- Market conditions: Rents soft (-0.3%/yr); 82 active listings in the ZIP; 19,697 units permitted in Los Angeles County in 2024 (9,426 in 5+ unit buildings).
- At $17,319/mo this rent would consume 381% of the median local household income ($55k/yr) (locally 4941% of renters already pay >50% of income on rent) — very limited rent-growth headroom before tenants either downsize or default.
Forward outlook
- Local home prices are declining (-3.0%/yr); year-one equity from $13k of loan paydown is wiped out by about $56k of value loss. Plan a longer hold.
- Los Angeles County population projected at +9% by 2050 — modest demand growth; plan on rents tracking national, not racing it.
Negotiation context
- It's been on market 44 days — a 3% lower offer ($1.79M) is reasonable based on typical stale-listing flexibility.
- 5 sale attempts since 28y ago with the ask held roughly flat each time — persistent listings suggest the price (not the market) is what's stuck; bring a comps-based counter.
- Current owner paid $948k; list at $1.85M implies a 95% gain — meaningful room to come down on a strong offer.
Risks & watch-outs
- Watch-outs: built in 1931 — expect roof / HVAC / electrical / plumbing capex.
Questions for the listing agent
- It's been on market 44 days. Have you received any prior offers? Is the seller open to a 6% concession, seller financing, or rate buy-down credit?
- Can we see the unit-by-unit rent roll, current vacancy, and any below-market leases? What's the average tenancy length?
- What capital expenditures (roof, boiler, parking lot, exteriors) have been made in the last 5 years, and what's planned in the next 2?
- Built in 1931 — when were the roof, HVAC, electrical panel, plumbing, and water heater last replaced?
- Is there a deadline driving the sale (1031 exchange, divorce, estate, relocation)? That informs how much negotiation room exists.
- Crime grade is F in this area — have there been break-ins, vandalism, or insurance claims at this property in the last 3 years? What carrier currently insures it and at what premium?
- The area grade is low — what's the realistic commute time and amenity access for the typical tenant pool here? Any planned neighborhood developments (good or bad) we should know about?
- What's the average days-on-market for RENTAL listings here right now (not sales)? A rising rental-DOM trend means longer vacancies and softer asking-rent achievability than the comps imply.
- What's the recent tenant-quality profile in this submarket — average credit score on applications, eviction rate, late-payment / NSF rate, and stable-employment percentage? A property-management company in the area should have these aggregated.
- How much new apartment / multifamily construction is in the pipeline within 1–3 miles? Heavy new supply (>2% of stock underway) typically softens rents 12–24 months out; light construction supports rent growth.
Investment metrics
- 1% rule
- 0.94% ✗
- Cap rate
- 7.54%
- Cash-on-cash
- 4.44%
- DSCR
- 1.20
- GRM
- 8.9
CMA / ARV
- ARV (median comp)
- $1,495,462
- List price
- $1,850,000
- Delta
- 23.71%
- Verdict
- OVERPRICED
- Comps
- 20 within 1.0 mi
Projected returns pro-forma
-3.0% appreciation · 0.0% rent growth · sell at horizon
- IRR
- -12.6%
- Equity multiple
- 0.56×
- Total profit
- $-228,875
- Equity at exit
- $275,841
- IRR
- -8.5%
- Equity multiple
- 0.54×
- Total profit
- $-239,805
- Equity at exit
- $159,954
Cash invested: $518,000 (down + closing). Projections, not guarantees.
Landlord ↔ Tenant lean methodology
- Overall (STATE)
- 18 Strongly Tenant-Friendly
- State California
- 18 Strongly Tenant-Friendly · D+13
- County
- — inherits STATE
- City
- — inherits STATE
ZIP-level market 90813
- Rents YoY
- -0.3%
- Active inventory
- 82
- Price-to-rent
- 71.2×
Monthly cashflow live
- Estimated rent
- $17,319 medium interval (Pro) →
- Mortgage (P&I)
- −$9,702
- Tax from tax record
- −$1,294 /mo · $15,524/yr
- Insurance
- −$771
- HOA
- −$0
- Vacancy / Maint / Mgmt
- −$3,637
- Net cashflow
- $1,916
Break-even live
8-unit breakdown (identical units grouped — click to expand)
| Units | Beds | Baths | Est. rent |
|---|---|---|---|
| 8× units | 4 | — | $17,320 |
| #1 | 4 | — | $2,165 |
| #2 | 4 | — | $2,165 |
| #3 | 4 | — | $2,165 |
| #4 | 4 | — | $2,165 |
| #5 | 4 | — | $2,165 |
| #6 | 4 | — | $2,165 |
| #7 | 4 | — | $2,165 |
| #8 | 4 | — | $2,165 |
| Total (8 units) | $17,319 | ||
UW: 25.0% down · 7.5% · 30yr · 1.5% tax · 5.0% vac · 8.0% maint · 8.0% mgmt
Financing live
Cash to close
- Down payment
- $462,500
- Closing costs
- $55,500
- Reserves months
- —
- Total cash needed
- —
Loan-product check · same deal, 3 products live
Conventional
25% down · 7.5% · 30yr
- Down + closing
- —
- Monthly P&I
- —
- Monthly cashflow
- —
- DSCR
- —
- Eligible?
- —
Personal DTI + credit; lowest rate.
DSCR
20% down · 8.5% · 30yr
- Down + closing
- —
- Monthly P&I
- —
- Monthly cashflow
- —
- DSCR
- —
- Eligible?
- —
No personal income docs; deal must DSCR.
Hard money
10% down · 12.0% · 12mo
- Down + closing
- —
- Monthly P&I
- —
- Monthly cashflow
- —
- DSCR
- —
- Eligible?
- —
Short-term bridge; refi at stabilization.
Listing history 30 events
-
2026-06-18days on market $1,850,000 Active 44 DOM
-
2026-06-17days on market $1,850,000 Active 43 DOM
-
2026-06-16days on market $1,850,000 Active 42 DOM
-
2026-06-15days on market $1,850,000 Active 41 DOM
-
2026-06-13days on market $1,850,000 Active 39 DOM
-
2026-06-13days on market $1,850,000 Active 38 DOM
-
2026-06-09days on market $1,850,000 Active 35 DOM
-
2026-06-08days on market $1,850,000 Active 34 DOM
-
2026-06-07days on market $1,850,000 Active 33 DOM
-
2026-06-04days on market $1,850,000 Active 30 DOM
-
2026-06-03days on market $1,850,000 Active 29 DOM
-
2026-06-02days on market $1,850,000 Active 28 DOM
-
2026-06-01days on market $1,850,000 Active 27 DOM
-
2026-05-31days on market $1,850,000 Active 26 DOM
-
2026-05-05$1,850,000 Active 1335-char remark
Show marketing remark (1335 chars)
9% cap rate! Beautiful Craftsmen Available in Downtown Long Beach, minutes to the beach, Shoreline Village, and the Pike! Discover an exceptional investment opportunity at 833 Cedar Avenue, a prominent 8-unit apartment building located in the heart of Long Beach. This unique multifamily property, just 5 minutes from the beach, boasts two buildings with a total of 6,494 square feet situated on a generous 7,506 square foot lot, offering significant rental income potential. Recent upgrades enhance this property's appeal, including 100% new plumbing installed three to four years ago and new vinyl windows throughout. The conversion to electric heaters means tenants now cover their own heating costs, as they pay for electricity. Strategically zoned LBPD10, this property benefits from one of Long Beach's most desirable and flexible planning districts, allowing for higher density development. This prime location provides residents with excellent access to downtown Long Beach amenities, including diverse dining, entertainment, shopping, and public transportation options. With its robust unit count, considerable square footage, advantageous zoning, and recent improvements, 833 Cedar Avenue is an ideal acquisition for investors seeking a strong performing asset with potential for future upside in a dynamic Long Beach market.
-
2026-01-02historical
-
2025-07-18$2,050,000 Active
-
2006-07-03soldstatus $947,500
-
2006-06-01soldstatus $947,500
-
2005-10-24$947,500
-
2002-09-20soldstatus $420,000
-
2002-03-14$429,000
-
1999-02-12soldstatus $220,000
-
1999-01-30soldstatus $222,000
-
1998-10-05$209,000
-
1997-04-01soldstatus $145,000
-
1993-07-01soldstatus $332,500
-
1989-02-24soldstatus $425,000
-
1987-05-01soldstatus $270,000
-
1986-12-23soldstatus $270,000
ⓘ Source: listings_history table (triggers on properties + properties_extension) + one-shot
backfill from property_details.listing_events for pre-trigger history.
Tax reassessment forecast CA · Resets to sale price
- Current annual tax
- $15,524 · $1,294/mo
- Projected year-2 tax
- $15,524 · $1,294/mo
- Expected delta
- $0/yr ($0/mo · 0.0%)
ⓘ Screening estimate from a state-policy table — verify with the county assessor before closing.
Climate risk First Street
- Flood 1/10 Low FEMA zone X (unshaded) · 0% chance over 30 yrs
- Wildfire 1/10 Low
- Heat 4/10 Moderate 7 d/yr ≥88°F today · 24 d/yr by 30 yrs out
- Wind 1/10 Low
- Air quality 6/10 Major 9 unhealthy d/yr today · 10 by 30 yrs out
Nearby sold comps map
Loading sold comps map…
Walkable amenities ~0.75 mi
Loading nearby amenities…
Taxation est. · year 1
- Rental income
- $207,828
- − Mortgage interest
- −$103,629
- − Property taxes
- −$15,524
- − Insurance
- −$9,250
- − Repairs & maintenance
- −$16,626
- − Management
- −$16,626
- − Depreciation
- −$53,818
- Taxable loss
- −$7,646
- Est. tax savings @ 24.0%
- +$1,835
- After-tax cash flow
- $24,826/yr
For passive investors: Depreciation is non-cash, so a rental often shows a tax loss while cash-flowing — sheltering income. Rental losses are passive: they offset passive income freely, and up to $25,000/yr can offset ordinary (W-2) income if you actively participate and your MAGI is under $100k (phasing out to $0 by $150k); unused losses carry forward. On sale, claimed depreciation is recaptured at up to 25%, and gains may owe capital-gains tax (a 1031 exchange can defer both). Figures are a year-1 estimate at your 24.0% rate — not tax advice; consult a CPA.
Schools (NCES district)
- District
- Long Beach Unified
- NCES district ID
- 0622500
- Math proficiency
- 34% ▼ -11.00%
- Reading proficiency
- 50% ▼ -4.00%
- Median HH income
- $56,092
- Composite
- 36.67/100
- National rank
- #4607
- State rank
- #216 of 517 in CA
Livability — Long Beach
- Score
- 67/100
- State rank
- #319
- US rank
- #10758
Category grades
Schools grade is shown separately in the Schools card above.
Census & demographics
- Census place
- Long Beach, CA
- County
- Los Angeles County · 9,444,647 people
- City population
- 466,088
- Metro
- Los Angeles-Long Beach-Anaheim, CA
- Population (ZIP)
- 51,241
- Household income
- $54,526
- Rent vs Own
- Severe rent burden
- 4941.0
Population outlook (Los Angeles County) Hauer SSP2
- Today (2025)
- 10,940,515 people
- By 2030
- 11,256,481 · +2.9%
- By 2040
- 11,729,929 · +7.2%
- By 2050
- 11,948,407 · +9.2%
- By 2075
- 11,818,114 · +8.0%
- By 2100
- 10,842,928 · -0.9%
Race, ethnicity, and origin ACS 2023
- Neighborhood character
- Diverse neighborhood (Simpson 0.55)
- Race & ethnicity
- Hispanic / Latino 64% Two or more races 13% Asian 12% Black 11% White 9% Native American 2%
- Hispanic origin (detail)
- Mexican 53%
- Common ancestry
- Lithuanian 1% Serbian 1%
- Foreign-born
- 36% · Canada, South Korea, Vietnam
- Languages at home
- 33% English-only · Spanish 56% Other Asian/Pacific 6% Tagalog/Filipino 1%
Political lean MEDSL · Los Angeles
- 2024 margin
- Solid D (+32.9) · D 64.8% · R 31.9% · Other 3.3%
- 2008→2024 swing
- -7.4pp toward R · 2008: 40.4pp · 2024: 32.9pp
- All cycles
- 2024: D+32.9 2020: D+44.2 2016: D+48.0 2012: D+40.0 2008: D+40.4
Not yet ingested
- Civics
- —
Market trends
- HPI YoY
- ▼ -468.88%
- Current HPI
- 480.8118
- Rent YoY
- ▼ -0.34%
- Metro
- Los Angeles-Long Beach-Anaheim, CA
- State GDP YoY
- ▲ 3.21%
- F500 in state
- 116
Industry mix (Fortune 500 HQ in CA)
| Industry | F500 HQs | Revenue |
|---|---|---|
| Technology | 27 | $1,492B |
|
||
| Financial Services | 3 | $174B |
|
||
| Retail | 3 | $44B |
|
||
| Insurance | 3 | $26B |
|
||
| Media / Entertainment | 2 | $115B |
|
||
| Pharmaceuticals / Biotech | 2 | $62B |
|
||
Price history
+585.2% since first listed16 events — show timeline
- 2026-05-05 Listed $1,850,000 CRMLS
- 2026-01-02 Listing Removed — CRMLS
- 2025-07-18 Listed $2,050,000 CRMLS
- 2006-07-03 Sold (Public Records) $947,500 Public Records
- 2006-06-01 Sold (MLS) $947,500 CRMLS
- 2005-10-24 Listed $947,500 CRMLS
- 2002-09-20 Sold (MLS) $420,000 CRMLS
- 2002-03-14 Listed $429,000 CRMLS
- 1999-02-12 Sold (Public Records) $220,000 Public Records
- 1999-01-30 Sold (MLS) $222,000 CRMLS
- 1998-10-05 Listed $209,000 CRMLS
- 1997-04-01 Sold (Public Records) $145,000 Public Records
- 1993-07-01 Sold (Public Records) $332,500 Public Records
- 1989-02-24 Sold (Public Records) $425,000 Public Records
- 1987-05-01 Sold (Public Records) $270,000 Public Records
- 1986-12-23 Sold (Public Records) $270,000 Public Records
Property tax history
+2.0%/yrLatest (2025): $15,524 · +4.5% YoY. Source: county tax records.
Cash-flow waterfall
monthlySold comps — $/sqft
last 12 mo · ≤1 miLoading sold comps…