6780 N Trico Rd · Picture Rocks, AZ
Flood risk 4/10 · Minor
- FEMA flood zone
- AO
- Chance of flooding over 30 yrs
- 0.2%
- Est. flood insurance / yr
- $848 – $2,087
Fire risk 5/10 · Moderate
- Est. fire insurance / yr
- $610 – $1,132
Heat risk 8/10 · Major
- Hot days now (above 109°F)
- 7 days/yr
- Hot days in 30 yrs
- 19 days/yr
Wind risk 1/10 · Minimal
- Chance of severe wind over 30 yrs
- —
Air-quality risk 1/10 · Minimal
- Unhealthy air days now
- 0 days/yr
- Unhealthy air days in 30 yrs
- 0 days/yr
Risk factors via First Street. Map © Google.
Why this score? — see what drove the B- grade
The composite is a weighted blend of 9 inputs, each scored 0–100. Each bar is that input's sub-score; the figure is the points it added to the 100-point composite (weight × sub-score).
- Cash flow +25.3/30.0
- ARV discount +15.0/15.0
- DSCR +8.3/10.0
- 1% rule +5.4/10.0
- Rent growth +3.4/5.0
- Schools +3.1/10.0
- Livability +2.8/5.0
- Condition / age +2.5/5.0
- Appreciation +0.0/10.0
$160,000
🖨 Deal sheet (PDF) 📄 Offer letter ✓ Due diligence
Listing remarks MLS
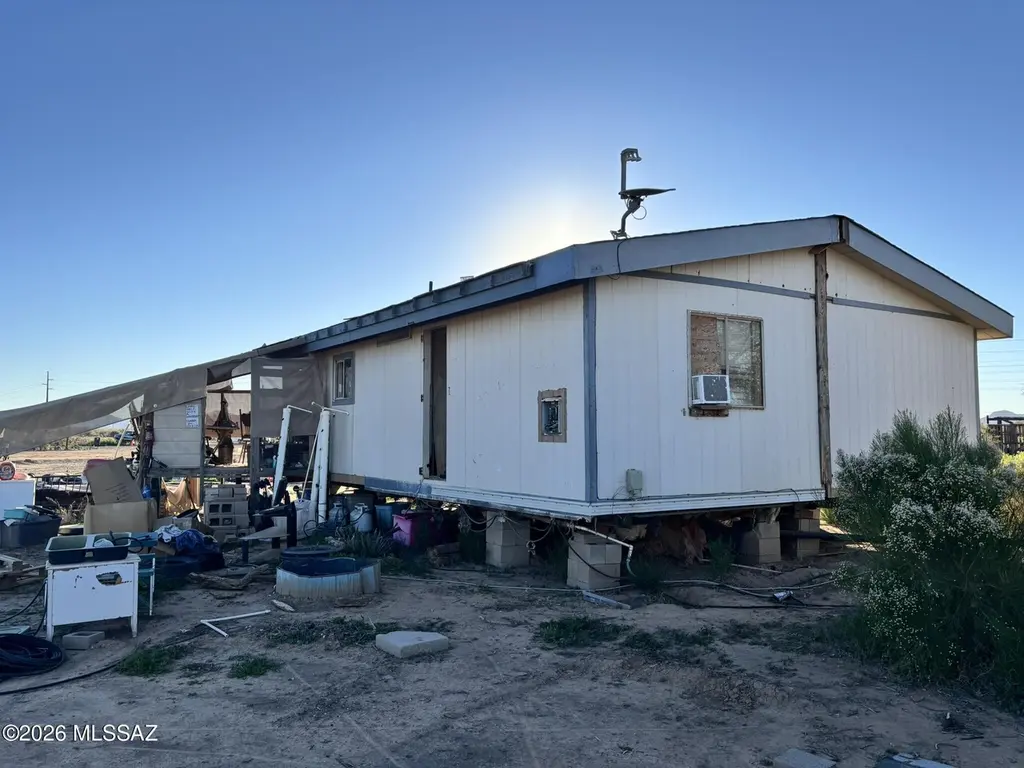
Home needs remodel (fixer upper), vaulted living room and kitchen ceilings. Property is nearly 5 acres (4.80) with private gravel driveway. Zoned RH, so you can live out your homesteading dreams here. Historical permit building to the west side of the home, used to be a stable for horses, water spigot near it as well. Reconstruction does not require permits
Key facts
- Zoned rh
- Water spigot
- Built 1984
Tags
Neighborhood map
What this means for you Summary
Snapshot
- This is a 2-bed/1.0-bath manufactured listed at $160k.
Deal economics
- At list price, monthly cash flow is $241 ($3k/yr) — positive.
- The deal already cash-flows at list — no discount required.
- Meets the 1% rule at list price ($2k rent vs $160k).
- Recommended offer: $141k (12.0% below list) — sets the bar for market timing.
- Cap rate 9.0% vs local median 5.6% in Picture Rocks — top-decile yield for the area; either an underpriced asset or a hidden risk that comps aren't pricing in. Stress-test before assuming the spread holds.
Location & tenants
- Location reads 55/100 on livability (#261 in AZ) — a working-class tenant base; expect higher turnover. Strengths: cost of living A+, housing A+; Watch: employment C-, crime D, amenities F.
- Marana Unified District (4404) (suburban): math 31% / reading 37% proficiency, ranked #83 of 249 in AZ (top 33%) — families likely to look elsewhere, expect single-tenant / working-renter base with shorter leases.
- Zoned schools: Picture Rocks Elementary (math 15% / reading 24%, grade F, #752 of 1,109 statewide, top 70%, 493 students, 67% FRL); Marana Middle School (math 24% / reading 30%, grade F, #97 of 218 statewide, top 45%, 907 students, 44% FRL); Marana High School (math 21% / reading 24%, grade F, #210 of 381 statewide, top 55%, 2,379 students, 36% FRL).
- Market conditions: Rents rising (+3.4%/yr); 416 active listings in the ZIP; solid renter incomes; 5,268 units permitted in Pima County in 2024 (996 in 5+ unit buildings).
Forward outlook
- Local home prices are declining (-3.0%/yr); year-one equity from $1k of loan paydown is wiped out by about $5k of value loss. Plan a longer hold.
- Pima County population projected at +8% by 2050 — modest demand growth; plan on rents tracking national, not racing it.
Negotiation context
- It's been on market 154 days — a 12% lower offer ($141k) is reasonable based on typical stale-listing flexibility.
- 3 sale attempts; this cycle's ask is 7% above the opening price — seller raised mid-cycle; expect resistance to lowballs.
- Current owner paid $78k; list at $160k implies a 105% gain — meaningful room to come down on a strong offer.
Risks & watch-outs
- Watch-outs: flood insurance adds $122/mo.
- Climate carrying-cost: in FEMA flood zone AO (mandatory federal flood insurance); moderate wildfire risk; extreme-heat days projected 7→19/yr by 2055 (HVAC capex compounding) — expect insurance premiums to compound above CPI over the hold.
Questions for the listing agent
- It's been on market 154 days. Have you received any prior offers? Is the seller open to a 12% concession, seller financing, or rate buy-down credit?
- What's the actual annual flood-insurance premium (NFIP or private), and is the property in a SFHA with mandatory coverage?
- Why hasn't it sold? Are there any deal-killer items the seller is aware of (foundation, flood, title, zoning, code violations)?
- Is there a deadline driving the sale (1031 exchange, divorce, estate, relocation)? That informs how much negotiation room exists.
- Schools are F-rated, which usually means shorter tenancies and higher turnover. Who's the typical renter profile here, and what's been the actual vacancy rate?
- Crime grade is D in this area — have there been break-ins, vandalism, or insurance claims at this property in the last 3 years? What carrier currently insures it and at what premium?
- What's the average days-on-market for RENTAL listings here right now (not sales)? A rising rental-DOM trend means longer vacancies and softer asking-rent achievability than the comps imply.
- What's the recent tenant-quality profile in this submarket — average credit score on applications, eviction rate, late-payment / NSF rate, and stable-employment percentage? A property-management company in the area should have these aggregated.
- How much new for-sale + rental construction is in the pipeline within 1–3 miles? Heavy new supply typically softens prices + rents 12–24 months out; constrained supply supports both.
Investment metrics
- 1% rule
- 1.04% ✓
- Cap rate
- 9.02%
- Cash-on-cash
- 9.74%
- DSCR
- 1.43
- GRM
- 8.0
CMA / ARV
- ARV (median comp)
- $223,452
- List price
- $160,000
- Delta
- -44.06%
- Verdict
- UNDERPRICED
- Comps
- 2 within 2.0 mi
Projected returns pro-forma
-3.0% appreciation · 3.43% rent growth · sell at horizon
- IRR
- -5.9%
- Equity multiple
- 0.78×
- Total profit
- $-9,830
- Equity at exit
- $23,857
- IRR
- 4.3%
- Equity multiple
- 1.32×
- Total profit
- $14,225
- Equity at exit
- $13,834
Cash invested: $44,800 (down + closing). Projections, not guarantees.
Landlord ↔ Tenant lean methodology
- Overall (STATE)
- 87 Strongly Landlord-Friendly
- State Arizona
- 87 Strongly Landlord-Friendly · R+3
- County
- — inherits STATE
- City
- — inherits STATE
ZIP-level market 85653
- Home prices YoY
- -21.8%
- Rents YoY
- 3.4%
- Active inventory
- 416
- Price-to-rent
- 8.0×
Monthly cashflow live
- Estimated rent
- $1,657 medium interval (Pro) →
- Mortgage (P&I)
- −$839
- Tax from tax record
- −$39 /mo · $472/yr
- Insurance
- −$67
- Flood insurance flood zone
- −$122 /mo · $1,468/yr
- HOA
- −$0
- Vacancy / Maint / Mgmt
- −$348
- Net cashflow
- $241
Break-even live
Sensitivity live
| Price | -10% $332 | -5% $287 | +0% $241 | +5% $196 | +10% $151 |
|---|---|---|---|---|---|
| Rent | -10% $111 | -5% $176 | +0% $241 | +5% $307 | +10% $372 |
| Rate | -1.0pp $322 | -0.5pp $282 | base $241 | +0.5pp $200 | +1.0pp $158 |
UW: 25.0% down · 7.5% · 30yr · 1.5% tax · 5.0% vac · 8.0% maint · 8.0% mgmt
Financing live
Cash to close
- Down payment
- $40,000
- Closing costs
- $4,800
- Reserves months
- —
- Total cash needed
- —
Loan-product check · same deal, 3 products live
Conventional
25% down · 7.5% · 30yr
- Down + closing
- —
- Monthly P&I
- —
- Monthly cashflow
- —
- DSCR
- —
- Eligible?
- —
Personal DTI + credit; lowest rate.
DSCR
20% down · 8.5% · 30yr
- Down + closing
- —
- Monthly P&I
- —
- Monthly cashflow
- —
- DSCR
- —
- Eligible?
- —
No personal income docs; deal must DSCR.
Hard money
10% down · 12.0% · 12mo
- Down + closing
- —
- Monthly P&I
- —
- Monthly cashflow
- —
- DSCR
- —
- Eligible?
- —
Short-term bridge; refi at stabilization.
Listing history 24 events
-
2026-06-21days on market $160,000 Active 154 DOM
-
2026-06-18days on market $160,000 Active 151 DOM
-
2026-06-17days on market $160,000 Active 150 DOM
-
2026-06-16days on market $160,000 Active 149 DOM
-
2026-06-15days on market $160,000 Active 148 DOM
-
2026-06-13days on market $160,000 Active 146 DOM
-
2026-06-13days on market $160,000 Active 145 DOM
-
2026-06-10days on market $160,000 Active 143 DOM
-
2026-06-09days on market $160,000 Active 142 DOM
-
2026-06-08days on market $160,000 Active 141 DOM
-
2026-06-07days on market $160,000 Active 140 DOM
-
2026-06-05days on market $160,000 Active 137 DOM
-
2026-06-03days on market $160,000 Active 136 DOM
-
2026-06-02days on market $160,000 Active 135 DOM
-
2026-06-01days on market $160,000 Active 134 DOM
-
2026-05-31days on market $160,000 Active 133 DOM
-
2026-05-17historical
-
2026-05-04status Active
-
2026-04-16historical Active Contingent
-
2026-04-14price $125,000
-
2026-03-02price $135,000
-
2026-01-19$150,000 Active
-
2026-01-14$160,000 Active 359-char remark
Show marketing remark (359 chars)
Home needs remodel (fixer upper), vaulted living room and kitchen ceilings. Property is nearly 5 acres (4.80) with private gravel driveway. Zoned RH, so you can live out your homesteading dreams here. Historical permit building to the west side of the home, used to be a stable for horses, water spigot near it as well. Reconstruction does not require permits
-
2022-04-12soldstatus $78,000
ⓘ Source: listings_history table (triggers on properties + properties_extension) + one-shot
backfill from property_details.listing_events for pre-trigger history.
Tax reassessment forecast AZ · Resets to sale price
- Current annual tax
- $472 · $39/mo
- Projected year-2 tax
- $1,056 · $88/mo
- Expected delta
- +$584/yr (+$49/mo · 123.8%)
ⓘ Screening estimate from a state-policy table — verify with the county assessor before closing.
Climate risk First Street
- Flood 4/10 Moderate FEMA zone AO · 20% chance over 30 yrs
- Wildfire 5/10 Major
- Heat 8/10 Severe 7 d/yr ≥109°F today · 19 d/yr by 30 yrs out
- Wind 1/10 Low
- Air quality 1/10 Low 0 unhealthy d/yr today · 0 by 30 yrs out
Nearby sold comps map
Loading sold comps map…
Walkable amenities ~0.75 mi
Loading nearby amenities…
Taxation est. · year 1
- Rental income
- $19,880
- − Mortgage interest
- −$8,962
- − Property taxes
- −$472
- − Insurance
- −$2,268
- − Repairs & maintenance
- −$1,590
- − Management
- −$1,590
- − Depreciation
- −$4,655
- Taxable income
- $343
- Est. tax owed @ 24.0%
- −$82
- After-tax cash flow
- $2,815/yr
For passive investors: Depreciation is non-cash, so a rental often shows a tax loss while cash-flowing — sheltering income. Rental losses are passive: they offset passive income freely, and up to $25,000/yr can offset ordinary (W-2) income if you actively participate and your MAGI is under $100k (phasing out to $0 by $150k); unused losses carry forward. On sale, claimed depreciation is recaptured at up to 25%, and gains may owe capital-gains tax (a 1031 exchange can defer both). Figures are a year-1 estimate at your 24.0% rate — not tax advice; consult a CPA.
Schools (NCES district)
- District
- Marana Unified District (4404)
- NCES district ID
- 0404630
- Math proficiency
- 31% ▼ -11.00%
- Reading proficiency
- 37% ▼ -5.00%
- Median HH income
- $65,282
- Composite
- 30.96/100
- National rank
- #6103
- State rank
- #83 of 249 in AZ
Livability — Picture Rocks
- Score
- 55/100
- State rank
- #261
- US rank
- #23370
Category grades
Schools grade is shown separately in the Schools card above.
Census & demographics
- Census place
- Picture Rocks, AZ
- County
- Pima County · 1,012,107 people
- Metro
- Tucson, AZ
- Population (ZIP)
- 23,574
- Household income
- $86,154
- Rent vs Own
- Severe rent burden
- 181.0
Population outlook (Pima County) Hauer SSP2
- Today (2025)
- 1,066,056 people
- By 2030
- 1,086,684 · +1.9%
- By 2040
- 1,117,160 · +4.8%
- By 2050
- 1,149,778 · +7.9%
- By 2075
- 1,271,480 · +19.3%
- By 2100
- 1,321,160 · +23.9%
Race, ethnicity, and origin ACS 2023
- Neighborhood character
- Diverse neighborhood (Simpson 0.55)
- Race & ethnicity
- White 61% Hispanic / Latino 27% Two or more races 15% Black 3% Native American 2% Asian 1%
- Hispanic origin (detail)
- Mexican 22% Puerto Rican 2%
- Common ancestry
- Romanian 4% Lithuanian 2% Slovak 2%
- Foreign-born
- 6% · Canada
- Languages at home
- 88% English-only · Spanish 9% Other Asian/Pacific 1%
Political lean MEDSL · Pima
- 2024 margin
- D (+15.2) · D 57.0% · R 41.8% · Other 1.2%
- 2008→2024 swing
- +9.1pp toward D · 2008: 6.1pp · 2024: 15.2pp
- All cycles
- 2024: D+15.2 2020: D+18.7 2016: D+13.5 2012: D+5.8 2008: D+6.1
Not yet ingested
- Civics
- —
Market trends
- HPI YoY
- ▼ -69.29%
- Current HPI
- 249.3403
- Rent YoY
- ▲ 3.43%
- Metro
- Tucson, AZ
- State GDP YoY
- ▲ 4.54%
- F500 in state
- 20
Industry mix (Fortune 500 HQ in AZ)
| Industry | F500 HQs | Revenue |
|---|---|---|
| Technology | 2 | $13B |
|
||
| Mining / Metals | 1 | $23B |
|
||
| Environmental Services | 1 | $16B |
|
||
| Metals / Steel | 1 | $14B |
|
||
| Technology Distribution | 1 | $9B |
|
||
| Homebuilding | 1 | $8B |
|
||
Price history
+60.3% since first listed8 events — show timeline
- 2026-05-17 Listing Removed — MLSSAZ
- 2026-05-04 Relisted — MLSSAZ
- 2026-04-16 Contingent — MLSSAZ
- 2026-04-14 Price Changed $125,000 MLSSAZ
- 2026-03-02 Price Changed $135,000 MLSSAZ
- 2026-01-19 Listed $150,000 MLSSAZ
- 2026-01-14 Listed $160,000 Fizber.com
- 2022-04-12 Sold (Public Records) $78,000 Public Records
Property tax history
+5.3%/yrLatest (2025): $472 · +4.9% YoY. Source: county tax records.
Cash-flow waterfall
monthlySold comps — $/sqft
last 12 mo · ≤1 miLoading sold comps…