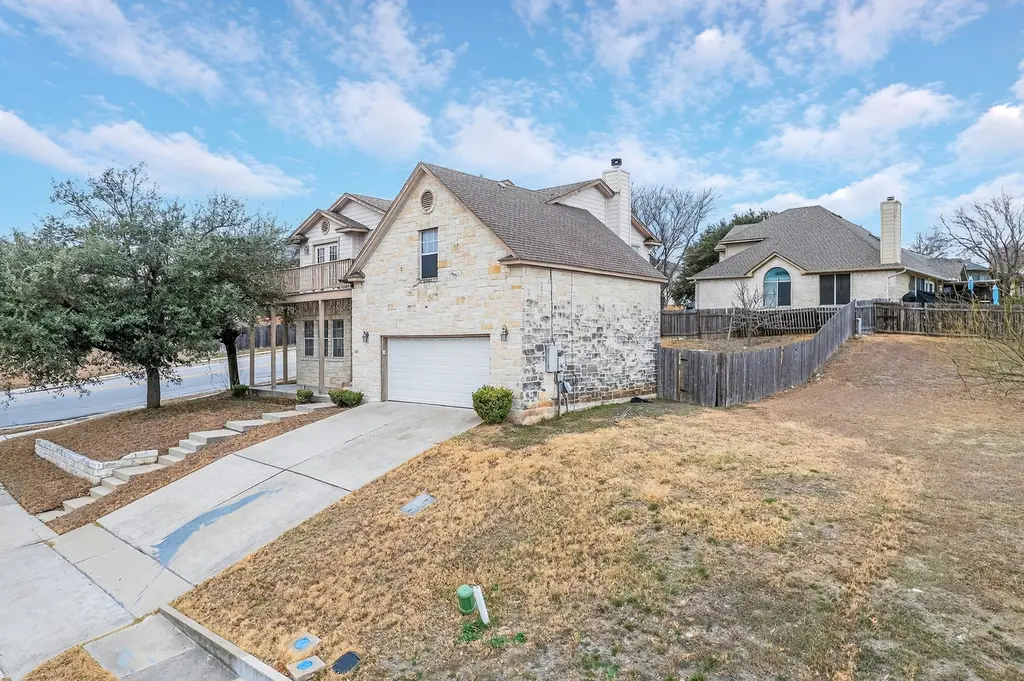
3811 Hawk View St · Round Rock, TX
Flood risk 1/10 · Minimal
- FEMA flood zone
- X (unshaded)
- Chance of flooding over 30 yrs
- 0.0%
- Est. flood insurance / yr
- $507 – $1,088
Fire risk 3/10 · Minor
- Est. fire insurance / yr
- $1,222 – $2,270
Heat risk 8/10 · Major
- Hot days now (above 108°F)
- 7 days/yr
- Hot days in 30 yrs
- 24 days/yr
Wind risk 6/10 · Moderate
- Chance of severe wind over 30 yrs
- 77.0%
Air-quality risk 2/10 · Minimal
- Unhealthy air days now
- 1 days/yr
- Unhealthy air days in 30 yrs
- 1 days/yr
Risk factors via First Street. Map © Google.
Why this score? — see what drove the D grade
The composite is a weighted blend of 9 inputs, each scored 0–100. Each bar is that input's sub-score; the figure is the points it added to the 100-point composite (weight × sub-score).
- ARV discount +15.0/15.0
- Cash flow +8.1/30.0
- Schools +4.9/10.0
- Livability +4.0/5.0
- 1% rule +3.3/10.0
- Condition / age +2.5/5.0
- DSCR +2.2/10.0
- Rent growth +1.7/5.0
- Appreciation +0.0/10.0
$289,900
🖨 Deal sheet (PDF) 📄 Offer letter ✓ Due diligence
Listing remarks MLS
INVESTOR SPECIAL OR SOMEONE WANTING TO GIVE IT SOME MAJOR TCL. Positioned on a desirable corner lot, this spacious 3-bedroom, 2.5-bath home offers a functional layout with room to grow. Featuring two living areas and two dining spaces, it’s perfect for both everyday living and entertaining. The main level showcases durable laminate flooring, while all bedrooms are tucked upstairs with comfortable carpeting for added warmth. Step out onto the private balcony for a quiet retreat, and enjoy the oversized backyard
Key facts
- Two dining spaces
- Private balcony
- Two living areas
Tags
Neighborhood map
What this means for you Summary
Snapshot
- This is a 3-bed/2.0-bath single-family listed at $290k.
Deal economics
- At list price, monthly cash flow is $-280 ($-3k/yr) — negative.
- To cash-flow at today's rent, offer at most $240k (17.1% below list).
- To meet the 1% rule (rent ≥ 1% of price), the offer needs to be $242k (16.6% below list).
- Recommended offer: $240k (17.1% below list) — sets the bar for cash-flow.
- Cap rate 5.1% vs local median 2.7% in Round Rock — top-decile yield for the area; either an underpriced asset or a hidden risk that comps aren't pricing in. Stress-test before assuming the spread holds.
Location & tenants
- Location reads 79/100 on livability (#56 in TX, #2,184 nationally) — a middle-class / working-renter tenant base. Strengths: employment A+, housing A+, health & safety A+; Watch: amenities D-, commute F.
- Round Rock ISD (urban): math 51% / reading 59% proficiency, ranked #86 of 826 in TX (top 10%) — acceptable for families but not a draw, mixed tenant base, ~2y average lease.
- Zoned schools: Caldwell Heights El (math 28% / reading 38%, grade F, #2,208 of 4,322 statewide, top 52%, 654 students, 59% FRL); Hopewell Middle (math 35% / reading 46%, grade F, #637 of 1,662 statewide, top 39%, 1,184 students, 32% FRL); Stony Point H S (math 40% / reading 57%, grade D, #560 of 1,632 statewide, top 35%, 2,570 students, 35% FRL) — zoned schools average 42% FRL vs 26% district-wide (16 pts higher); higher-poverty schools than district average — tighter screening recommended.
- Zoned-school proficiency averages 41% at this address vs 55% district-wide (-14 pts) — the specific schools serving this property underperform the Round Rock ISD average; the district grade overstates school quality for this exact location.
- Market conditions: Rents falling (-3.2%/yr); 456 active listings in the ZIP; 40 comparable units currently listed for rent nearby; rentals at typical pace (median 20d on market — plan ~3-4 weeks tenant-placement turnaround); high-income renter base; 7,543 units permitted in Williamson County in 2024 (1,425 in 5+ unit buildings).
Forward outlook
- Local home prices are declining (-3.0%/yr); year-one equity from $2k of loan paydown is wiped out by about $9k of value loss. Plan a longer hold.
- Williamson County population projected at +69% by 2050 — long-run rental-demand tailwind backs the buy-and-hold thesis.
Negotiation context
- It's been on market 94 days — a 9% lower offer ($264k) is reasonable based on typical stale-listing flexibility.
- 9 sale attempts since 22y ago with the ask held roughly flat each time — persistent listings suggest the price (not the market) is what's stuck; bring a comps-based counter.
Risks & watch-outs
- Climate carrying-cost: major wind risk, 77% chance of damaging wind over 30y; extreme-heat days projected 7→24/yr by 2055 (HVAC capex compounding) — expect insurance premiums to compound above CPI over the hold.
Questions for the listing agent
- What do current leases actually rent for vs. the listed asking? Can we see a recent rent roll and the last 12 months of T-12 income?
- It's been on market 94 days. Have you received any prior offers? Is the seller open to a 17% concession, seller financing, or rate buy-down credit?
- Why hasn't it sold? Are there any deal-killer items the seller is aware of (foundation, flood, title, zoning, code violations)?
- Is there a deadline driving the sale (1031 exchange, divorce, estate, relocation)? That informs how much negotiation room exists.
- Schools are B-rated — typically a magnet for longer-tenancy family renters. What's the average tenant stay here, and is there a school-zone premium baked into asking?
- The area grade is low — what's the realistic commute time and amenity access for the typical tenant pool here? Any planned neighborhood developments (good or bad) we should know about?
- What's the average days-on-market for RENTAL listings here right now (not sales)? A rising rental-DOM trend means longer vacancies and softer asking-rent achievability than the comps imply.
- What's the recent tenant-quality profile in this submarket — average credit score on applications, eviction rate, late-payment / NSF rate, and stable-employment percentage? A property-management company in the area should have these aggregated.
- How much new for-sale + rental construction is in the pipeline within 1–3 miles? Heavy new supply typically softens prices + rents 12–24 months out; constrained supply supports both.
Investment metrics
- 1% rule
- 0.83% ✗
- Cap rate
- 5.13%
- Cash-on-cash
- -4.14%
- DSCR
- 0.82
- GRM
- 10.0
CMA / ARV
- ARV (median comp)
- $406,029
- List price
- $289,900
- Delta
- -28.60%
- Verdict
- UNDERPRICED
- Comps
- 20 within 1.0 mi
Show comp detail 12 sales within ~0.75 mi
| Address | Dist | Beds/Ba | Sqft | Sold | Price | $/sf | Match |
|---|---|---|---|---|---|---|---|
| 3723 Holden Ct | 0.06mi | 4/2.5 (+1) | 2,615 (+8%) | 2mo | $334,900 | $128 | 76 |
| 3811 Laurel Ridge Dr | 0.30mi | 4/2.5 (+1) | 2,386 (-2%) | 1mo | $350,000 | $147 | 75 |
| 1564 Lorson Loop | 0.25mi | 4/3.0 (+1) | 2,396 (-1%) | 3mo | $360,000 | $150 | 75 |
| 3726 Eagles Nest St | 0.07mi | 4/2.5 (+1) | 2,642 (+9%) | 4mo | $375,000 | $142 | 71 |
| 1302 Gulf Way | 0.43mi | 3/2.5 | 2,388 (-2%) | 7mo | $299,000 | $125 | 70 |
| 3837 Laurel Ridge Dr | 0.11mi | 4/2.5 (+1) | 2,224 (-8%) | 8mo | $355,000 | $160 | 68 |
| 1103 Terra St | 0.35mi | 3/2.5 | 2,232 (-8%) | 1mo | $329,900 | $148 | 68 |
| 3635 Bass Loop | 0.48mi | 3/2.0 | 2,264 (-7%) | 2mo | $350,000 | $155 | 64 |
| 1305 Red Stag Pl | 0.50mi | 4/2.0 (+1) | 2,323 (-4%) | 1mo | $379,000 | $163 | 64 |
| 3401 Settlement Dr | 0.45mi | 3/2.5 | 2,240 (-8%) | 4mo | $299,999 | $134 | 61 |
| 3523 Cheyenne St | 0.44mi | 4/2.5 (+1) | 2,650 (+9%) | 2mo | $365,000 | $138 | 56 |
| 1004 Terra St | 0.49mi | 3/2.5 | 2,081 (-14%) | 3mo | $339,000 | $163 | 49 |
Match score weights: distance 35% · size 25% · config 20% · recency 20%. Top-matched comps best support the ARV.
Projected returns pro-forma
-3.0% appreciation · 0.0% rent growth · sell at horizon
- IRR
- -27.0%
- Equity multiple
- 0.12×
- Total profit
- $-71,739
- Equity at exit
- $43,225
- IRR
- -42.2%
- Equity multiple
- -0.38×
- Total profit
- $-112,186
- Equity at exit
- $25,065
Cash invested: $81,172 (down + closing). Projections, not guarantees.
Landlord ↔ Tenant lean methodology
- Overall (STATE)
- 87 Strongly Landlord-Friendly
- State Texas
- 87 Strongly Landlord-Friendly · R+5
- County
- — inherits STATE
- City
- — inherits STATE
ZIP-level market 78665
- Home prices YoY
- -31.7%
- Rents YoY
- -3.2%
- Active inventory
- 456
- Price-to-rent
- 10.0×
Monthly cashflow live
- Estimated rent
- $2,416 high interval (Pro) →
- Mortgage (P&I)
- −$1,520
- Tax from tax record
- −$548 /mo · $6,574/yr
- Insurance
- −$121
- HOA
- −$0
- Vacancy / Maint / Mgmt
- −$507
- Net cashflow
- $-280
Break-even live
Sensitivity live
| Price | -10% $-116 | -5% $-198 | +0% $-280 | +5% $-362 | +10% $-444 |
|---|---|---|---|---|---|
| Rent | -10% $-471 | -5% $-375 | +0% $-280 | +5% $-185 | +10% $-89 |
| Rate | -1.0pp $-134 | -0.5pp $-206 | base $-280 | +0.5pp $-355 | +1.0pp $-432 |
UW: 25.0% down · 7.5% · 30yr · 1.5% tax · 5.0% vac · 8.0% maint · 8.0% mgmt
Financing live
Cash to close
- Down payment
- $72,475
- Closing costs
- $8,697
- Reserves months
- —
- Total cash needed
- —
Loan-product check · same deal, 3 products live
Conventional
25% down · 7.5% · 30yr
- Down + closing
- —
- Monthly P&I
- —
- Monthly cashflow
- —
- DSCR
- —
- Eligible?
- —
Personal DTI + credit; lowest rate.
DSCR
20% down · 8.5% · 30yr
- Down + closing
- —
- Monthly P&I
- —
- Monthly cashflow
- —
- DSCR
- —
- Eligible?
- —
No personal income docs; deal must DSCR.
Hard money
10% down · 12.0% · 12mo
- Down + closing
- —
- Monthly P&I
- —
- Monthly cashflow
- —
- DSCR
- —
- Eligible?
- —
Short-term bridge; refi at stabilization.
Rent comps 40 comps
| Address | Beds | Baths | Sqft | Rent | $/sqft | DOM | Units | Dist |
|---|---|---|---|---|---|---|---|---|
| 3723 Holden Ct Round Rock, TX | 4.0 | 2.5 | 2615 | $2,299 | $0.88 | 23d | 1 | 0.07mi |
| 3723 Holden Ct Round Rock, TX | 4.0 | 3.0 | 2615 | $2,199 | $0.84 | 25d | 1 | 0.07mi |
| 1559 Haynie Bnd Round Rock, TX | 4.0 | 2.5 | 2496 | $2,100 | $0.84 | 45d | 1 | 0.21mi |
| 3640 Sandy Brook Dr Unit 1345542P Round Rock, TX | 4.0 | 2.5 | 2680 | $4,560 | $1.70 | 0d | 1 | 0.23mi |
| 3807 Julianas Way Round Rock, TX | 4.0 | 2.0 | 1863 | $2,450 | $1.32 | 19d | 1 | 0.28mi |
| 1404 Terra St Round Rock, TX | 4.0 | 2.0 | 2214 | $2,100 | $0.95 | 45d | 1 | 0.31mi |
| 3922 Haleys Way Round Rock, TX | 4.0 | 2.5 | 2697 | $2,095 | $0.78 | 9d | 1 | 0.32mi |
| 1413 Terra St Round Rock, TX | 4.0 | 2.5 | 3085 | $3,500 | $1.13 | 19d | 1 | 0.33mi |
| 3906 Haleys Way Round Rock, TX | 3.0 | 2.0 | 1854 | $1,995 | $1.08 | 9d | 1 | 0.33mi |
| 1302 Casa Blanca Cv Round Rock, TX | 4.0 | 2.5 | 2517 | $2,175 | $0.86 | 12d | 1 | 0.36mi |
| 1001 Zodiac Ln Round Rock, TX | 1.0–3.0 | 1.0–2.5 | 1505 | $1,800 | $1.20 | 3d | 2 | 0.38mi |
| 3673 Texana Loop Round Rock, TX | 3.0 | 3.0 | 2178 | $2,200 | $1.01 | 14d | 1 | 0.41mi |
| 725 University Blvd Round Rock, TX | 1.0–3.0 | 1.0–3.5 | 1306 | $2,899 | $2.22 | 4d | 11 | 0.46mi |
| 917 Satellite Vw Round Rock, TX | 4.0 | 2.0 | 2226 | $2,440 | $1.10 | 19d | 1 | 0.48mi |
| 3621 Rams Horn Way Round Rock, TX | 3.0 | 2.0 | 1676 | $2,200 | $1.31 | 12d | 1 | 0.49mi |
| 3521 Cisco Trl Round Rock, TX | 4.0 | 2.5 | 2682 | $2,800 | $1.04 | 19d | 1 | 0.50mi |
| 3521 Cisco Trl Unit 1345539P Round Rock, TX | 4.0 | 1.5 | 2680 | $4,681 | $1.75 | 0d | 1 | 0.50mi |
| 1076 Zeus Cir Round Rock, TX | 4.0 | 2.5 | 2854 | $2,800 | $0.98 | 45d | 1 | 0.60mi |
| 808 Broken Trace Ct Round Rock, TX | 3.0 | 2.0 | 1876 | $2,100 | $1.12 | 19d | 1 | 0.80mi |
| 3017 Settlement Dr Unit 32 Round Rock, TX | 3.0 | 3.0 | 2058 | $2,400 | $1.17 | 16d | 1 | 0.90mi |
| 1893 Greenside Trl Round Rock, TX | 4.0 | 3.5 | 2667 | $2,400 | $0.90 | 45d | 1 | 0.91mi |
| 1008 Double File Trl Round Rock, TX | 3.0 | 2.5 | 2317 | $2,100 | $0.91 | 0d | 1 | 1.01mi |
| 903 Fork Ridge Path Round Rock, TX | 4.0 | 3.5 | 3315 | $2,695 | $0.81 | 14d | 1 | 1.05mi |
| 4216 Flat Stone Ct Round Rock, TX | 4.0 | 2.0 | 2298 | $3,900 | $1.70 | 19d | 1 | 1.06mi |
| 4205 Bent Wood Ct Round Rock, TX | 4.0 | 2.5 | 1884 | $2,375 | $1.26 | 16d | 1 | 1.06mi |
| 1621 Westmeadow Trl Round Rock, TX | 3.0 | 2.0 | 1868 | $2,500 | $1.34 | 45d | 1 | 1.09mi |
| 1907 Windberry Path Round Rock, TX | 4.0 | 2.0 | 2149 | $2,400 | $1.12 | 19d | 1 | 1.11mi |
| 3200 College Park Dr Round Rock, TX | 4.0 | 4.0 | 2534 | $2,550 | $1.01 | 45d | 1 | 1.13mi |
| 3200 College Park Dr #112 Round Rock, TX | 4.0 | 2.5 | 2100 | $2,495 | $1.19 | 9d | 1 | 1.13mi |
| 4207 Windberry Ct Round Rock, TX | 4.0 | 2.0 | 1984 | $2,295 | $1.16 | 25d | 1 | 1.14mi |
| 4308 Park Vista Trl Round Rock, TX | 3.0 | 2.0 | 2550 | $2,400 | $0.94 | 19d | 1 | 1.15mi |
| 1123 Winding Creek Pl Round Rock, TX | 3.0 | 2.5 | 2797 | $2,295 | $0.82 | 12d | 1 | 1.15mi |
| 807 Centerbrook Pl Round Rock, TX | 4.0 | 2.0 | 1860 | $2,300 | $1.24 | 16d | 1 | 1.21mi |
| 4332 Teravista Club Dr #59 Round Rock, TX | 2.0 | 2.0 | 1775 | $2,390 | $1.35 | 4d | 1 | 1.22mi |
| 2019 Westvalley Pl Round Rock, TX | 4.0 | 3.0 | 3044 | $3,350 | $1.10 | 14d | 1 | 1.32mi |
| 542 Centerbrook Pl Round Rock, TX | 4.0 | 2.5 | 2848 | $7,900 | $2.77 | 19d | 1 | 1.33mi |
| 5401 N Mays St Georgetown, TX | 1.0–4.0 | 1.0–3.0 | 1333 | $2,256 | $1.69 | 0d | 51 | 1.33mi |
| 1104 Mastiff Cv Round Rock, TX | 4.0 | 2.5 | 2846 | $2,499 | $0.88 | 45d | 1 | 1.34mi |
| 1405 Sheltie Ln Round Rock, TX | 3.0 | 2.5 | 1736 | $2,100 | $1.21 | 19d | 1 | 1.34mi |
| 217 Birkshire Dr Georgetown, TX | 4.0 | 2.5 | 2674 | $2,500 | $0.93 | 45d | 1 | 1.35mi |
Listing history 50 events
-
2026-06-21days on market $289,900 Active 94 DOM
-
2026-06-18days on market $289,900 Active 91 DOM
-
2026-06-17days on market $289,900 Active 90 DOM
-
2026-06-16days on market $289,900 Active 89 DOM
-
2026-06-15days on market $289,900 Active 88 DOM
-
2026-06-13days on market $289,900 Active 86 DOM
-
2026-06-13days on market $289,900 Active 85 DOM
-
2026-06-09days on market $289,900 Active 82 DOM
-
2026-06-08days on market $289,900 Active 81 DOM
-
2026-06-07days on market $289,900 Active 80 DOM
-
2026-06-05days on market $289,900 Active 77 DOM
-
2026-06-03days on market $289,900 Active 76 DOM
-
2026-06-02days on market $289,900 Active 75 DOM
-
2026-06-01days on market $289,900 Active 74 DOM
-
2026-05-31days on market $289,900 Active 73 DOM
-
2026-03-19$289,900 Active 521-char remark
Show marketing remark (521 chars)
INVESTOR SPECIAL OR SOMEONE WANTING TO GIVE IT SOME MAJOR TCL. Positioned on a desirable corner lot, this spacious 3-bedroom, 2.5-bath home offers a functional layout with room to grow. Featuring two living areas and two dining spaces, it’s perfect for both everyday living and entertaining. The main level showcases durable laminate flooring, while all bedrooms are tucked upstairs with comfortable carpeting for added warmth. Step out onto the private balcony for a quiet retreat, and enjoy the oversized backyard
-
2025-12-26Active
-
2015-01-06soldstatus
-
2015-01-05soldstatus Sold
-
2014-11-26status Pending - Taking Backups
-
2014-10-25price $189,990
-
2014-10-24status Active
-
2014-10-15status Pending - Taking Backups
-
2014-10-10price $194,900
-
2014-10-04$199,900 Active
-
2014-09-02historical Withdrawn
-
2014-08-14price
-
2014-08-12price
-
2014-08-05price
-
2014-07-27price
-
2014-07-18Active
-
2014-02-11soldstatus
-
2012-11-18historical Withdrawn
-
2012-09-06price
-
2012-07-26price
-
2012-07-01price
-
2012-05-31price
-
2012-05-11Active
-
2011-10-23price Withdrawn
-
2011-10-23historical Withdrawn
-
2011-10-07price
-
2011-09-13price
-
2011-08-29price
-
2011-08-05price
-
2011-06-23price
-
2011-06-12price
-
2011-05-30price
-
2011-05-15price
-
2011-04-29price
-
2011-03-16Active
ⓘ Source: listings_history table (triggers on properties + properties_extension) + one-shot
backfill from property_details.listing_events for pre-trigger history.
Tax reassessment forecast TX · Resets to sale price
- Current annual tax
- $6,574 · $548/mo
- Projected year-2 tax
- $6,574 · $548/mo
- Expected delta
- $0/yr ($0/mo · 0.0%)
ⓘ Screening estimate from a state-policy table — verify with the county assessor before closing.
Climate risk First Street
- Flood 1/10 Low FEMA zone X (unshaded) · 0% chance over 30 yrs
- Wildfire 3/10 Moderate
- Heat 8/10 Severe 7 d/yr ≥108°F today · 24 d/yr by 30 yrs out
- Wind 6/10 Major 77% chance of damaging wind over 30 yrs
- Air quality 2/10 Low 1 unhealthy d/yr today · 1 by 30 yrs out
Nearby sold comps map
Loading sold comps map…
Walkable amenities ~0.75 mi
Loading nearby amenities…
Taxation est. · year 1
- Rental income
- $28,997
- − Mortgage interest
- −$16,239
- − Property taxes
- −$6,574
- − Insurance
- −$1,450
- − Repairs & maintenance
- −$2,320
- − Management
- −$2,320
- − Depreciation
- −$8,433
- Taxable loss
- −$8,339
- Est. tax savings @ 24.0%
- +$2,001
- After-tax cash flow
- $-1,358/yr
For passive investors: Depreciation is non-cash, so a rental often shows a tax loss while cash-flowing — sheltering income. Rental losses are passive: they offset passive income freely, and up to $25,000/yr can offset ordinary (W-2) income if you actively participate and your MAGI is under $100k (phasing out to $0 by $150k); unused losses carry forward. On sale, claimed depreciation is recaptured at up to 25%, and gains may owe capital-gains tax (a 1031 exchange can defer both). Figures are a year-1 estimate at your 24.0% rate — not tax advice; consult a CPA.
Schools (NCES district)
- District
- Round Rock ISD
- NCES district ID
- 4838080
- Math proficiency
- 51% ▼ -14.00%
- Reading proficiency
- 59% ▼ -4.00%
- Median HH income
- $75,378
- Composite
- 49.33/100
- National rank
- #2022
- State rank
- #86 of 826 in TX
Livability — Round Rock
- Score
- 79/100
- State rank
- #56
- US rank
- #2184
Category grades
Schools grade is shown separately in the Schools card above.
Census & demographics
- Census place
- Round Rock, TX
- County
- Williamson County · 680,029 people
- City population
- 184,922
- Metro
- Austin-Round Rock-Georgetown, TX
- Population (ZIP)
- 66,171
- Household income
- $122,680
- Rent vs Own
- Severe rent burden
- 2036.0
Population outlook (Williamson County) Hauer SSP2
- Today (2025)
- 699,027 people
- By 2030
- 795,537 · +13.8%
- By 2040
- 990,683 · +41.7%
- By 2050
- 1,184,292 · +69.4%
- By 2075
- 1,623,825 · +132.3%
- By 2100
- 1,924,153 · +175.3%
Race, ethnicity, and origin ACS 2023
- Neighborhood character
- Diverse neighborhood (Simpson 0.69)
- Race & ethnicity
- White 49% Hispanic / Latino 24% Two or more races 18% Black 11% Asian 10%
- Hispanic origin (detail)
- Mexican 17% Puerto Rican 1%
- Common ancestry
- Slovak 2% Lithuanian 2% Romanian 2%
- Foreign-born
- 16% · Canada, Vietnam, South Korea
- Languages at home
- 75% English-only · Spanish 14% Other Indo-European 3% Other Asian/Pacific 3%
Political lean MEDSL · Williamson
- 2024 margin
- Toss-up / Even · D 48.0% · R 50.4% · Other 1.6%
- 2008→2024 swing
- +10.6pp toward D · 2008: -13.0pp · 2024: -2.5pp
- All cycles
- 2024: R+2.5 2020: D+1.4 2016: R+9.9 2012: R+21.5 2008: R+13.0
Not yet ingested
- Civics
- —
Market trends
- HPI YoY
- ▼ -83.58%
- Current HPI
- 179.7075
- Rent YoY
- ▼ -3.23%
- Metro
- Austin-Round Rock-Georgetown, TX
- State GDP YoY
- ▲ 3.95%
- F500 in state
- 110
Industry mix (Fortune 500 HQ in TX)
| Industry | F500 HQs | Revenue |
|---|---|---|
| Energy | 16 | $1,198B |
|
||
| Technology | 5 | $198B |
|
||
| Engineering / Construction | 4 | $72B |
|
||
| Energy Services | 3 | $60B |
|
||
| Utilities | 3 | $41B |
|
||
| Healthcare | 2 | $330B |
|
||
Price history
+45.0% since first listed40 events — show timeline
- 2026-03-19 Listed $289,900 Unlock MLS
- 2025-12-26 Listed — Unlock MLS
- 2015-01-06 Sold (Public Records) — Public Records
- 2015-01-05 Sold (MLS) — Unlock MLS
- 2014-11-26 Pending — Unlock MLS
- 2014-10-25 Price Changed $189,990 Unlock MLS
- 2014-10-24 Relisted — Unlock MLS
- 2014-10-15 Pending — Unlock MLS
- 2014-10-10 Price Changed $194,900 Unlock MLS
- 2014-10-04 Listed $199,900 Unlock MLS
- 2014-09-02 Delisted — Unlock MLS
- 2014-08-14 Price Changed — Unlock MLS
- 2014-08-12 Price Changed — Unlock MLS
- 2014-08-05 Price Changed — Unlock MLS
- 2014-07-27 Price Changed — Unlock MLS
- 2014-07-18 Listed — Unlock MLS
- 2014-02-11 Sold (Public Records) — Public Records
- 2012-11-18 Delisted — Unlock MLS
- 2012-09-06 Price Changed — Unlock MLS
- 2012-07-26 Price Changed — Unlock MLS
- 2012-07-01 Price Changed — Unlock MLS
- 2012-05-31 Price Changed — Unlock MLS
- 2012-05-11 Listed — Unlock MLS
- 2011-10-23 Delisted — Unlock MLS
- 2011-10-23 Price Changed — Unlock MLS
- 2011-10-07 Price Changed — Unlock MLS
- 2011-09-13 Price Changed — Unlock MLS
- 2011-08-29 Price Changed — Unlock MLS
- 2011-08-05 Price Changed — Unlock MLS
- 2011-06-23 Price Changed — Unlock MLS
- 2011-06-12 Price Changed — Unlock MLS
- 2011-05-30 Price Changed — Unlock MLS
- 2011-05-15 Price Changed — Unlock MLS
- 2011-04-29 Price Changed — Unlock MLS
- 2011-03-16 Listed — Unlock MLS
- 2010-10-01 Delisted — Unlock MLS
- 2010-06-29 Listed — Unlock MLS
- 2004-09-16 Delisted — Unlock MLS
- 2004-03-16 Listed — Unlock MLS
- 1996-10-22 Sold (Public Records) — Public Records
Property tax history
+2.8%/yrLatest (2026): $6,574 · -8.7% YoY. Source: county tax records.
Cash-flow waterfall
monthlySold comps — $/sqft
last 12 mo · ≤1 miLoading sold comps…